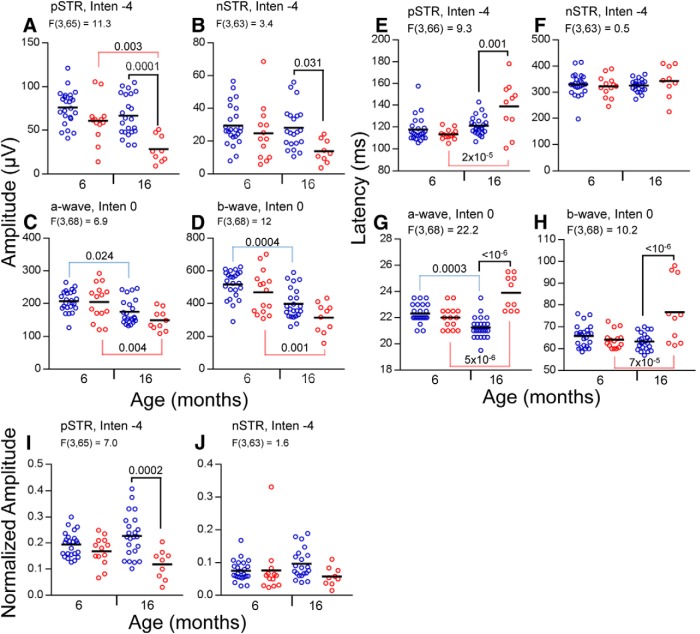
Figure 4.
Amplitudes and latencies of ERG responses of wt and Fbn1Tsk /+ mice. Amplitudes (A–D), latencies (E–H), and normalized amplitudes (I, J) are shown for wt (blue symbols) and Fbn1Tsk /+ mice (red symbols) at six and 16 months of age, with group means indicated by horizontal black lines. At 16 months, statistically significant reductions in amplitude of Fbn1Tsk /+ compared to wt (black brackets) were found for pSTR (A) and nSTR (B), but not for a-wave or b-wave responses (C, D). Significant age-related decline was found for the pSTR of Fbn1Tsk /+ mice (A, red brackets) and the a- and b-waves of both genotypes (C, D, red and blue brackets). For Fbn1Tsk /+ compared to wt, significant increased latencies were found at 16 months (black brackets) for pSTR (E), a-wave (G), and b-wave (H). Comparing six- to 16-month-old mice, significant age-related increased latency was found for Fbn1Tsk /+ mice (red brackets) for the pSTR (E), a-wave (G), and b-wave (H) responses, while wt had decreased a-wave latency (G, blue bracket). Amplitude of the pSTR normalized to the b-wave is significantly lower for Fbn1Tsk /+ mice compared to wt at 16 months of age (I, black bracket), but not for nSTR (J). Stimulus intensities (log cd·s/m2) and F statistics are indicated above each panel.

