Abstract
Fast inhibitory neurotransmission in the brain is principally mediated by the neurotransmitter γ-aminobutyric acid (GABA) and its synaptic target, the GABA-A receptor. Dysfunction of this receptor results in neurological disorders and mental illnesses including epilepsy, anxiety and insomnia. The GABA-A receptor is also a prolific target for therapeutic, illicit, and recreational drugs, including benzodiazepines, barbiturates, anesthetics and ethanol. We present high resolution cryo-electron microscopy structures of the human α1β2γ2 GABA-A receptor, the predominant isoform in the adult brain. The receptor is bound to GABA and the benzodiazepine site antagonist flumazenil, the first-line clinical treatment for benzodiazepine overdose. The receptor architecture reveals unique heteromeric interactions for this important class of inhibitory neurotransmitter receptors. This work provides a template for understanding receptor modulation by GABA and benzodiazepines, and will assist rational approaches to therapeutic targeting of this receptor for neurological disorders and mental illness.
Function of the nervous system is governed by a balance of excitatory and inhibitory signaling. GABA is the major inhibitory neurotransmitter in the central nervous system (CNS) and acts through the GABA-A and GABA-B receptors. GABA-A receptors, found at 20%-50% of synapses in the brain1, react on a millisecond timescale to binding of GABA by opening a transmembrane channel permeable to chloride, which suppresses neuronal activity in the adult brain2. Dysfunction of these channels results in anxiety disorders, epilepsy, and neurodevelopmental disorders including autism3–5.
GABA-A receptors are the targets of a remarkably diverse array of drugs that act through distinct binding sites. GABA was discovered in 19506,7, and shortly after came the discovery of benzodiazepines8, allosteric modulators of GABA-A receptors widely used in the treatment of epilepsy, insomnia, anxiety, and panic disorder9,10. Flumazenil is a competitive antagonist of the benzodiazepine binding site; used clinically to reverse benzodiazepine-induced anesthesia, it is the principal antidote for benzodiazepine overdose11. Allosteric potentiation of the GABA-A receptor toward a therapeutic (or recreational) end extends far beyond benzodiazepines: barbiturates, volatile and intravenous anesthetics, neurosteroids, and ethanol are all allosteric modulators acting on GABA-A receptors12,13.
The rich pharmacology of the GABA-A receptor derives in part from its complex subunit assembly. A total of 19 subunits assemble in limited combinations to make functional receptors14. The predominant synaptic isoform comprises two α1 subunits, two β2 subunits and one γ2 subunit. The general architecture of the receptor is known from structural studies of the pentameric ligand-gated ion channel superfamily15 and from the structure of a homopentameric GABA-A receptor16. In the physiological assembly, GABA binds at β-α subunit interfaces, and benzodiazepines at the α-γ interface10,17. Mutagenesis and functional studies have approximated the loci for these and many other compounds at GABA-A receptors10,17–19, but currently there is no structural information for a physiological GABA-A receptor. Here we present high-resolution structures of the α1β2γ2 GABA-A receptor, which illuminate atomic mechanisms of GABA and flumazenil recognition and features of assembly for this heteromeric receptor.
Biochemistry and structure determination
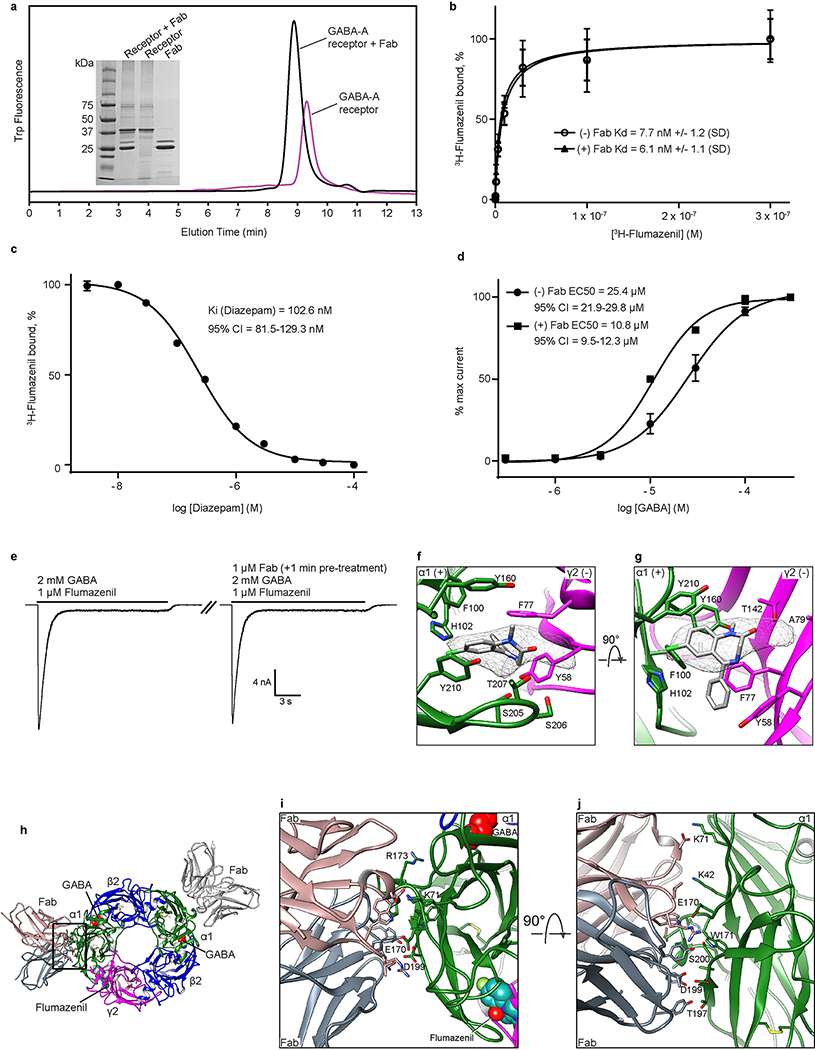
We optimized receptor constructs and expression conditions to produce and purify the receptor assembly comprising the α1, β2 and γ2 subunits (Methods, Extended Data Fig. 1). We raised monoclonal antibodies to the receptor and purified a complex of the receptor + Fab to disrupt the low-resolution pseudo-symmetry and facilitate particle alignment (Extended Data Fig. 2a)20. The purified GABA-A receptor EM construct retained the ability to bind [3H]-flumazenil with low nanomolar affinity (Extended Data Fig. 2b)13,21. We observed a small positive effect of Fab on GABA potency, and found binding of Fab did not affect affinity for [3H]-flumazenil. Fab had no effect on the functional response to GABA and flumazenil applied at concentrations used for EM (Extended Data Fig. 2).
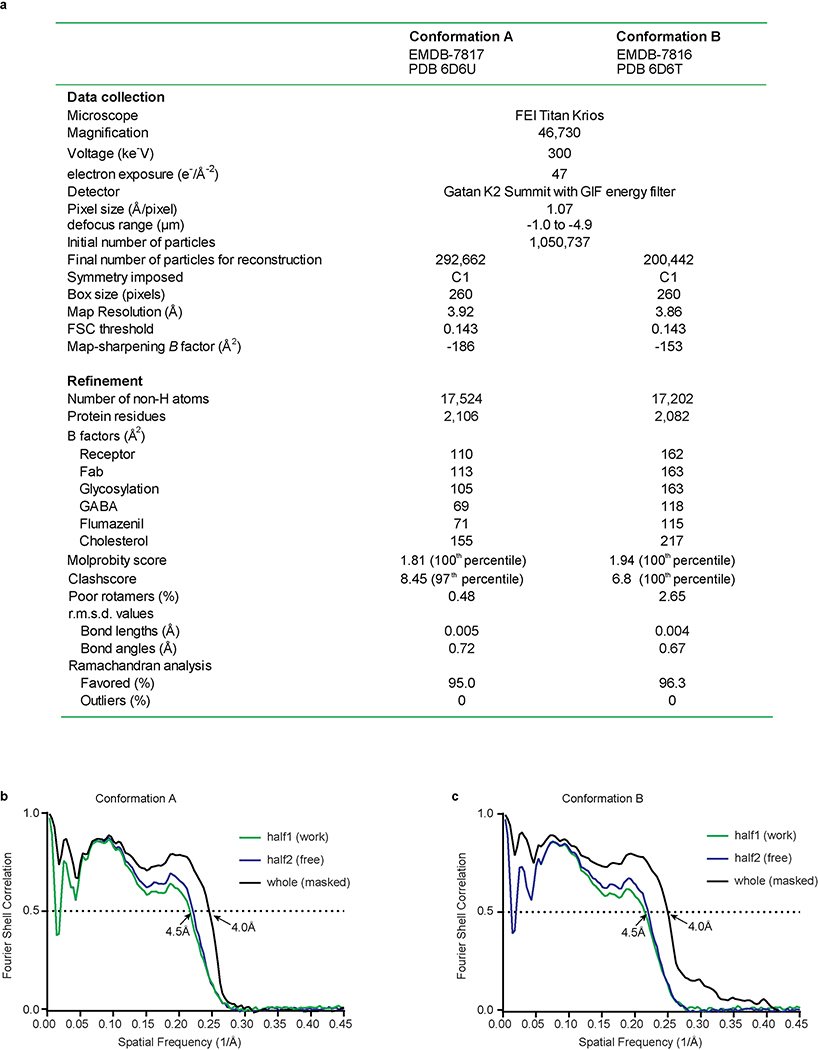
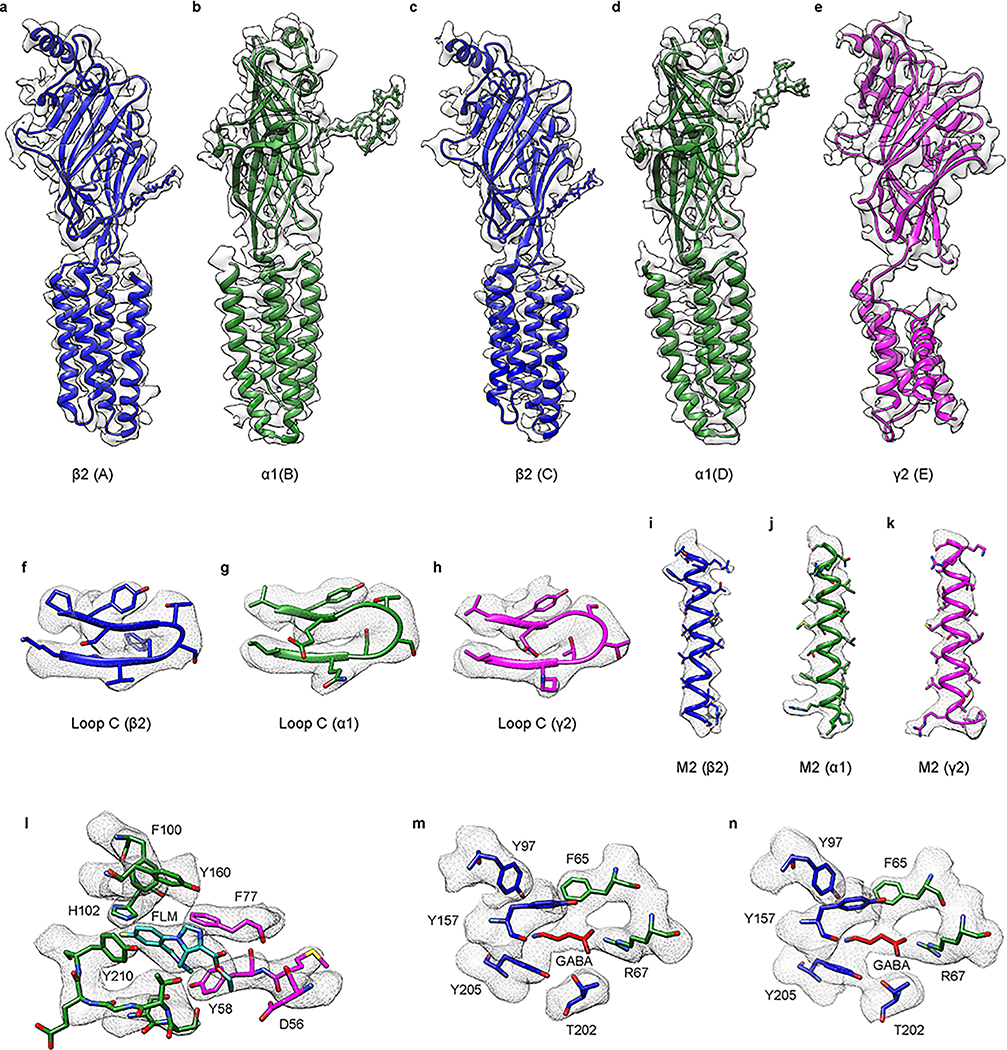
Processing of cryo-EM images of the GABA-A receptor + GABA + flumazenil + Fab sample revealed a homogeneous complex with two Fabs bound (Extended Data Fig. 3). Classification yielded reconstructions with two distinct transmembrane domain (TMD) arrangements, which we call conformation A and conformation B. Refinement of the two reconstructions yielded density maps both at overall resolutions of ~3.9 Å (Extended Data Fig. 4). EM density maps were of sufficient quality to allow modeling of almost the entire receptor and the variable domains of the Fabs (Methods and Extended Data Fig. 5–7). The density map shows clear side chain densities and resolution of 3 Å or better in the extracellular ligand binding sites, whereas the TMD (3-4 Å) and the Fab fragments (4-4.5 Å) are resolved at lower resolution. The γ2 subunit in conformation B, and in particular its TMD, was comparatively more disordered than the rest of the receptor but still exhibited secondary structural features.
Overall Architecture
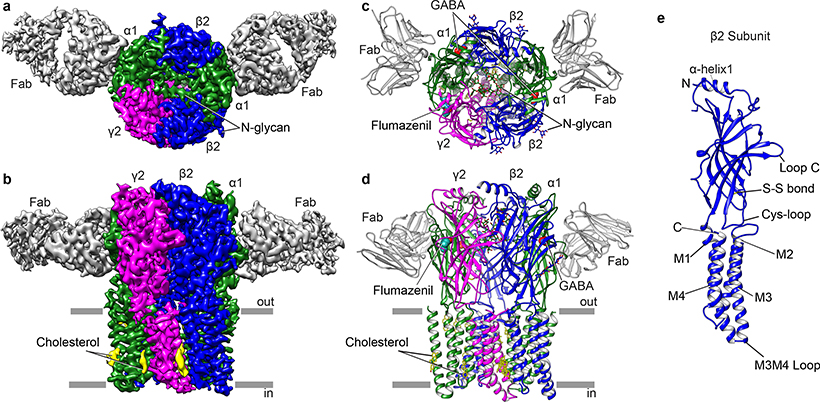
The GABA-A receptor-Fab complex is a cylinder-shaped receptor assembly, with two Fab fragments extending radially from the receptor’s ECD (Fig. 1). Five receptor subunits assemble in a pseudo-symmetrical fashion around an extracellular vestibule and integral ion channel. The two Fab fragments interact exclusively with the ECD of the α1 subunits and orient parallel to the membrane (Extended Data Fig. 2h-j). When viewed from the synaptic cleft, the arrangement of subunits around the pentameric ring is β2-α1-β2-α1-γ2 in a counterclockwise direction consistent with functional studies of concatameric receptors22–24. Each subunit’s ECD, carrying the signature Cys-loop, begins with an amino-terminal α-helix at the apex of the pentameric ring, followed by ten β-strands folded into a β-sandwich. The ECD is followed by four α-helices (M1-M4) with M2 lining the ion channel (Fig. 1e).
Figure 1. Overall structure of the GABA-A receptor-Fab complex.
a,b, Top and side views of the 3D reconstruction of GABA-A receptor-Fab complex colored by subunit: α1-green, β2-blue, γ2- magenta; Fab-gray, CHS-yellow. Conformation A is shown. c,d, Top and side view of the atomic model, colored as in a. Flumazenil is shown as cyan spheres, GABA as red spheres and CHS and N-linked glycans are modeled as sticks. e, Structure of single β2 subunit.
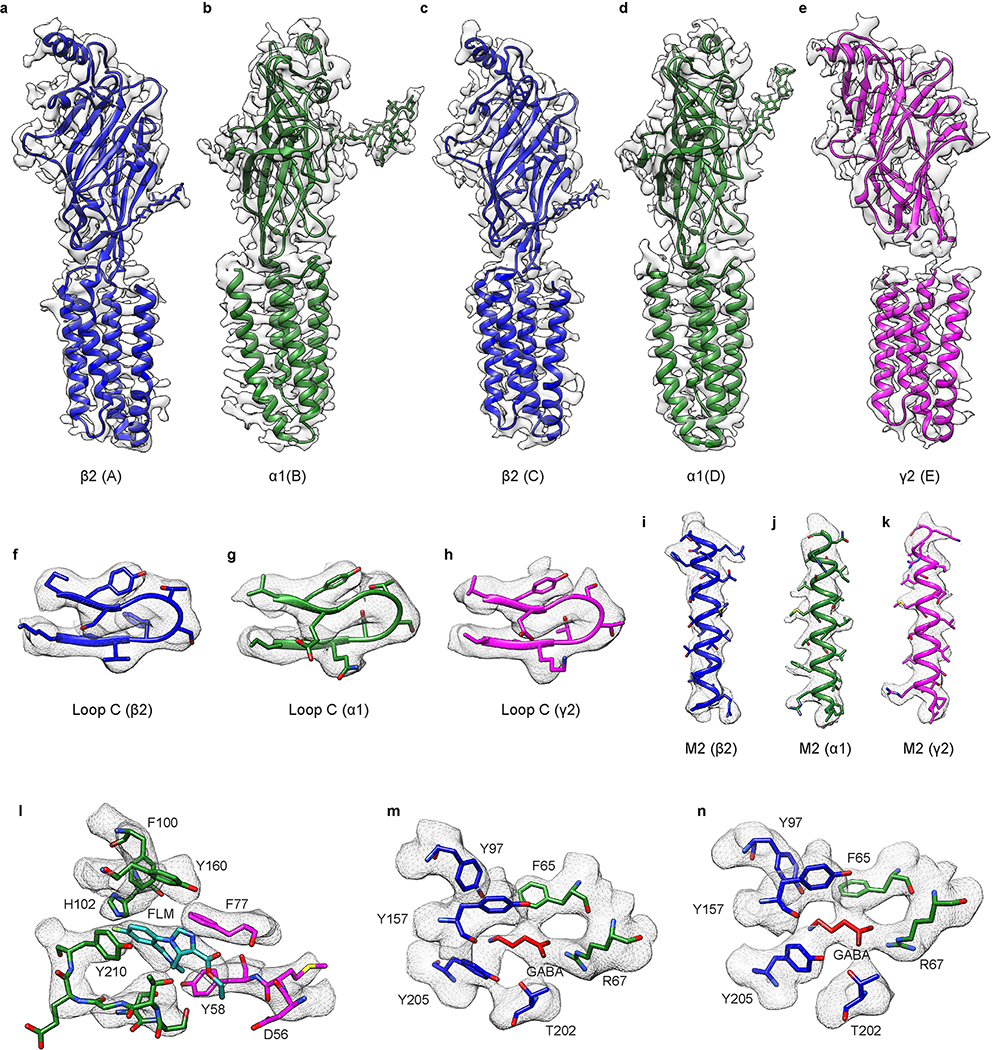
GABA is bound in the classical neurotransmitter site at each of the two β2-α1 interfaces in the ECD (Fig. 1c). Strong density for flumazenil was observed at an analogous position at the single α1-γ2 interface (Extended Data Fig. 6l, 7l). In addition to the conserved N-linked glycans on the periphery of the β subunits16, the extracellular vestibule is populated with a branched network of N-linked glycans emanating from α1 subunits (Fig. 1c). Several ordered densities were observed at the membrane-receptor interface, and at subunit interfaces in the TMD. We have modeled these as CHS, a water-soluble proxy for cholesterol. The ECDs are qualitatively identical between conformations A and B, with the exception of the loops that interact with the TMD (r.m.s.d. of Cα atoms for entire ECD superposition is 0.34 Å). The TMD conformations are distinct, but both in what we suggest are non-conducting desensitized states based on patch-clamp electrophysiology experiments carried out to achieve steady state currents (Extended Data Fig. 2e).
Neurotransmitter and benzodiazepine binding sites
We performed patch-clamp experiments to measure the EM receptor construct’s response to neurotransmitter. We found that application of GABA induced inward currents that were inhibited by bicuculline, a competitive antagonist, in a manner similar to that observed at the wild-type receptor (Fig. 2a and Extended Data Fig. 2d)25,26.
Figure 2. Neurotransmitter binding site.
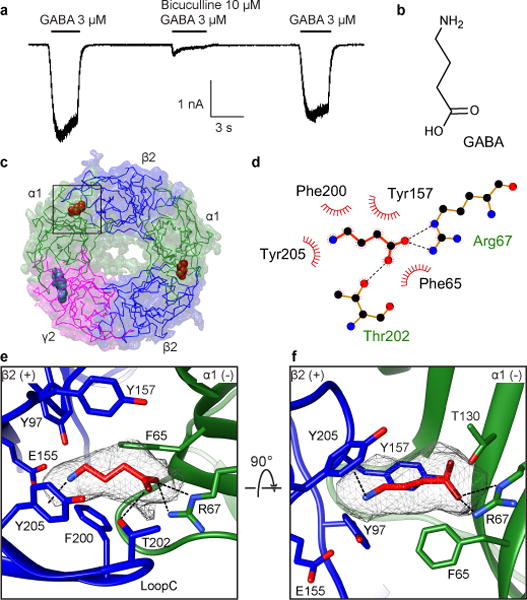
a, Electrophysiology of the GABA-A EM construct in HEK cells. n=3 independent experiments. b, GABA chemical structure. c, View from synapse; box indicates one of two equivalent GABA binding sites at β2-α1 interfaces. d, LigPlot schematic of GABA interactions showing electrostatic (dashes) and hydrophobic interactions (eyelashes). e,f, Detailed architecture of GABA binding pocket boxed in c. e, Synaptic view as in c. Putative hydrogen bonding and cation-π interactions are represented as dashed lines. f, Side view of the GABA binding pocket with loop C backbone hidden for clarity.
The GABA-A receptor has two equivalent neurotransmitter-binding pockets located at the β2-α1 interfaces in the ECD (Fig. 2c). We observed strong, density in both sites correlating in size and shape to GABA (Fig. 2b, e, f). The density and chemical environment permitted orientation of the carboxylate and amine ends of the molecule. The principal (+) side of the neurotransmitter pocket contributes mainly aromatic residues: Y97 on loop A, Y157 on loop B, and F200 and Y205 on loop C (Fig. 2e,f). These side chains form an aromatic glove around GABA’s basic amino nitrogen, with F200 and Y205 positioned to make favorable cation-π interactions. Substitutions of Y157 and Y205 dramatically decreased the GABA sensitivity, supporting the importance of these residues for GABA recognition27. E155 on loop B is modeled outside of strong interaction distance with the GABA amino nitrogen (4.2 Å), but may further anchor this end of the ligand, consistent with the finding that its mutation reduced GABA potency28. Finally, T202 is positioned to form a hydrogen bond with the carboxylate group of GABA.
The structure allowed us to define contributions from the complementary α subunit as well. F65 forms the floor of the binding pocket and contributes important hydrophobic interactions supported by mutagenesis and cysteine crosslinking studies29,30. While T130 may contribute a hydrogen bond with the GABA carboxylate, R67 appears key to GABA recognition, stabilizing the carboxylate head of the ligand through electrostatic interactions with its basic guanidinium group. Furthermore, this arginine is conserved across α subunits but is absent in β and γ subunits, and its mutation decreases GABA potency31. In β subunits, this residue is a glutamine and this difference could account for the weak binding of GABA exhibited by GABA-β3 homopentamers16,32. Thus, GABA binding is coordinated through interactions with conserved aromatic residues and electrostatic interactions with side chains complementing the anionic and cationic ends of the neurotransmitter. These interactions suggest variability on the complementary subunit greatly influences ligand selectivity.
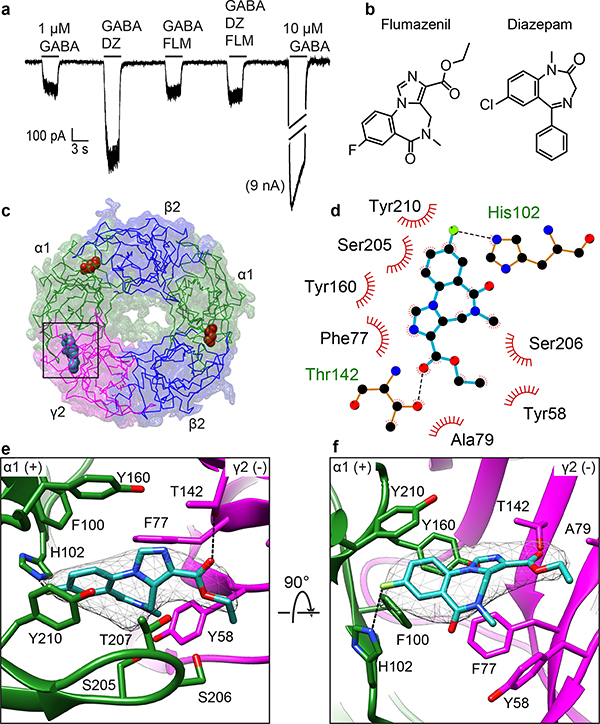
Benzodiazepines are a class of psychoactive drugs that enhance the effect of GABA at the GABA-A receptor, resulting in sedative, hypnotic, anxiolytic, anticonvulsant, and muscle relaxant effects10. Classical benzodiazepines potentiate agonist-mediated activation of the GABA-A receptor by causing a decrease in the concentration of GABA required for activation. Flumazenil, an imidazobenzodiazepine (Fig. 3), is a competitive benzodiazepine antagonist. We tested the effect of flumazenil on our EM constructs and found that it blocks diazepam potentiation of the GABA response and binds with nanomolar affinity (Fig. 3a and Extended Data Fig. 2c).
Figure 3. Flumazenil interactions at the benzodiazepine binding site.
a, Electrophysiology of the cryo-EM construct showing flumazenil (3 μM) blocks GABA-A receptor potentiation by diazepam (1 μM). n=3 independent experiments. b, Flumazenil and diazepam chemical structures. c, View from synapse, as in Fig. 2; box indicates flumazenil bound at α1-γ2 interface. d, Schematic of flumazenil interactions showing electrostatic (dashes) and hydrophobic interactions (eyelashes). e,f, Detailed architecture of flumazenil binding pocket boxed in c, with orientations and representations as in Fig. 2e-f.
Including flumazenil in purification of the GABA-A receptor allowed us to interrogate atomic interactions at the benzodiazepine site. At the α1-γ2 interface in the ECD, we observed strong planar density consistent with the geometry of flumazenil (Fig. 3e, f). The density map shape accommodated the benzene and imidazole extensions off the diazepine ring when the ligand was positioned in only one orientation. The benzodiazepine ring system sits roughly parallel to loop C, with its fluorobenzene end interacting exclusively with the principal (α1) subunit and its ethylcarboxylate extending toward the solvent, between the tip of loop C and the complementary (γ2) subunit. Flumazenil is nestled in an aromatic box formed by three residues from the principal subunit and two from the complementary subunit (Fig. 3d–f). F100 and Y160 from α1 and F77 from γ2 form the back wall of the box; the diazepine ring packs against the phenyl ring of F77. Mutagenesis studies support the aromatic nature of this residue being important for binding: mutation of F77 to tyrosine has little effect on flumazenil affinity33, but other mutations result in large decreases in affinity33,34. Y58 on the complementary subunit packs against the diazepine methyl group and situates on a loop we call D′. It forms an incomplete floor of the box; much of the membrane-side of the binding pocket is open to solvent, suggesting the receptor does not require a substantial conformational change to allow flumazenil to dock or undock from its site. Y210 on loop C forms π-π stacking interactions with the benzene ring of flumazenil, thereby contributing to the front wall of the box. S205, S206 and T207 also on loop C add to the front wall of the box and may form electrostatic interactions with the flumazenil diazepine, imidazole and ester groups (Fig. 3d-e). T142 in the back of the pocket is also positioned to form a hydrogen bond (2.7 Å) with the flumazenil ester carbonyl oxygen.
Strikingly, the distal fluorine of the antagonist is positioned to form a hydrogen bond with the H102 indole nitrogen (3.1 Å) from the principal subunit. H102 was identified early as important in benzodiazepine and flumazenil binding. αβγ receptors that contain α1-α3 or α5 subunits have this histidine and are benzodiazepine-sensitive, while α4 and α6-containing receptors have an arginine at this position and do not respond to benzodiazepines35. Mutation of this residue to any other tolerated residue decreases the affinity of all benzodiazepines examined as well as flumazenil35–37, with the exception of histidine to cysteine in the α5 subunit38. Examination of the structure makes it straightforward to rationalize the exquisite sensitivity of flumazenil affinity to the identity of this residue. A long side chain like arginine would clash with flumazenil in its observed location, and any residue unable to form a hydrogen bond with the halide would be unfavorable. Manual superpositioning of the benzodiazepine rings of diazepam on flumazenil suggests this positive modulator can be accommodated in the same pocket, maintaining the halogen-H102 interaction, without substantial conformational rearrangement (Extended Data Fig. 2f-g). An unanswered question relates to how the antagonist remains inert in its effects on GABA binding and activation while the chemically similar benzodiazepines potentiate activation by GABA.
Pseudo-ligand binding sites
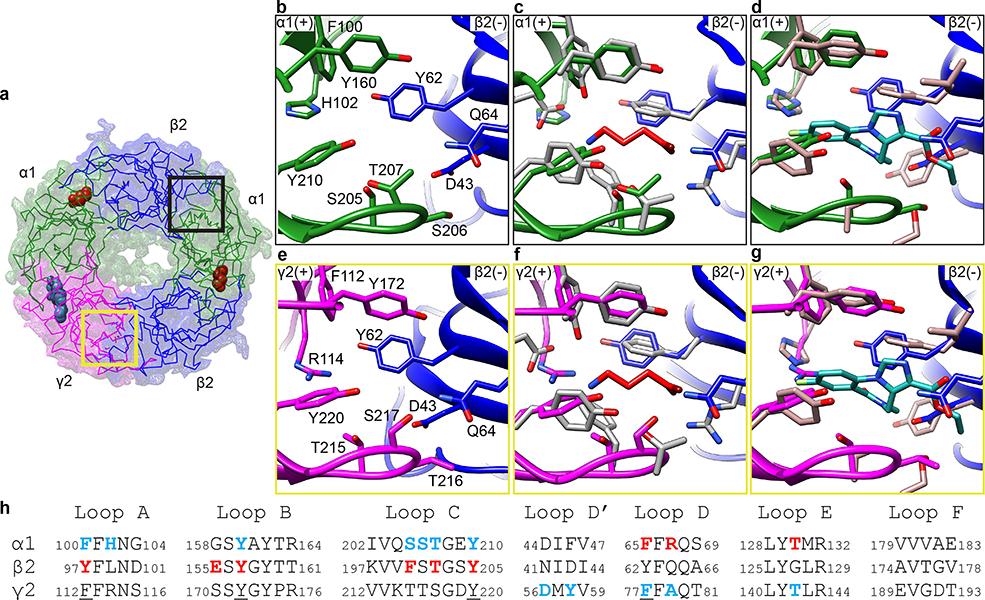
There are two ECD interfaces that lack density for ligands in our structure, α1-β2 and γ2-β2 (Fig. 4a). These are potential sites for design of novel modulators, but thus far only one compound has been characterized as a positive modulator binding at the α-β interface39. Comparison of the architecture of the empty sites with the occupied GABA and benzodiazepine sites allows for clarification of important binding determinants for these classes of ligands. Superposition of vacant and occupied ligand binding sites reveals an overall conservation of backbone conformation (Fig. 4b-g, Extended Data Fig. 8). All interface classes contain four aromatic residues at conserved positions: F/Y on Loop A, Y on Loop B, Y on Loop C and F/Y on Loop D (Fig. 4h, underlined). Their sidechains adopt similar orientations regardless of the presence or absence of ligand. These residues likely contribute to the core architecture of GABA-A receptor binding sites, with other residues defining ligand selectivity. Surprisingly, there are no substantial differences in the positions of Loop C between the agonist, benzodiazepine, and pseudo-ligand binding pockets (Fig. 4 and Extended Data Fig. 8). An illustration of this ligand-insensitive symmetry is found by comparing the backbone conformations of two α1 subunits, one that forms the empty α-β interface and one that forms the flumazenil-bound α-γ interface (Extended Data Fig. 8i and n). Loop C from these subunits may adopt indistinguishable conformations because flumazenil is an inert ligand that simply stabilizes an apo conformation of the α1 subunit, mimicking the empty α-β interface. Alternatively, conformational changes amongst subunits in the pentamer may be concerted, with Loop C symmetrically “closed” or “open”40.
Figure 4. Pseudo-ligand sites vs. GABA and flumazenil sites.
a, Synaptic view, with colored boxes indicating the distinct pseudo-agonist sites. b,e, Detailed structural information of pseudo-agonist interfaces α-β and γ-β boxed in a. c,f, Superposition of GABA binding site (in gray) on α-β and γ-β interfaces respectively. d,g, Superposition of flumazenil binding site (in taupe) on the α-β and γ-β interfaces respectively. h, Sequence alignment of the loops involved in ligand binding pockets. Blue residues are involved in flumazenil binding; red residues are involved in GABA binding.
We leveraged the new structural information to explore the question of why GABA and flumazenil do not bind to the empty α-β and γ-β interfaces. As described above, the principal aromatics are conserved across all interface classes. The β2 subunit forms the complementary face in both of these pseudo-agonist sites. This subunit lacks the Loop D arginine (R67 in α) that appears to be important for high affinity GABA binding; it is replaced in β2 with a glutamine, which could not form a salt bridge with the GABA carboxylate. This salt bridge may not be a strict requirement, as GABA can bind to β2-β2 interfaces to activate β2γ2 recombinant receptors41. A β2 phenylalanine 200 on Loop C that contacts the GABA amino nitrogen is replaced by a polar serine or threonine (α residue 205, Fig.4) when α or γ forms the principal face. The lack of π interactions may destabilize neurotransmitter binding at these interfaces. Moreover, β2 E155 is replaced with glycine and serine in the α and γ subunits, respectively. Thus, both of these sites lack the charge-charge interactions at both ends of the corresponding GABA position that would promote its binding. Specific to the γ-β interface, R114 on the γ subunit would electrostatically repel the GABA amino nitrogen (Fig. 4e, f). This γ2 R114 replaces the α1 H102, akin to the identity at that position in α4 and α6 subunits that are insensitive to benzodiazepines. In our structure an arginine at this position would clash with flumazenil (Fig. 4g). The methyl side chain of A79 in the γ2 subunit orients toward and accommodates the ethyl carboxylate of flumazenil (Fig. 3f). Its substitution to Q64 in β2 would also clash with flumazenil and thus likely contributes to exclusion of flumazenil from the pseudo-ligand binding interfaces.
Glycosylation and ion permeation
The extracellular vestibule in Cys-loop receptors has been characterized as a wide chamber that is filled with bulk solvent and hydrated ions and plays a role in tuning ion conductance15,42. All structures to date have revealed a cavernous architecture that constricts dramatically at the junction of the membrane where it transitions into the ion channel. We observed strong continuous and branched densities extending from consensus glycosylation sites on the α1 subunits inside the vestibule (Fig. 5). Glycan1 comprises eight well-ordered sugars that form an “H” shape, extending across the channel’s central axis to make extensive contacts with the γ2 subunit (Fig. 5b,c). γN101 and γG104 are oriented to form electrostatic interactions with the glycans. The β5 strand (β5-β5′ loop) of the γ2 subunit provides further contacts for anchoring the sugar molecules. Glycan2 adopts a “Y” shape, consisting of five sugar monomers (Fig. 5d and e). It extends along the β2 subunit (chain C) contacting Glycan1. Mutation of the glycosylation sites results in a loss of expression at physiological temperature43.
Figure 5. Vestibule and non-vestibule N-glycosylation.
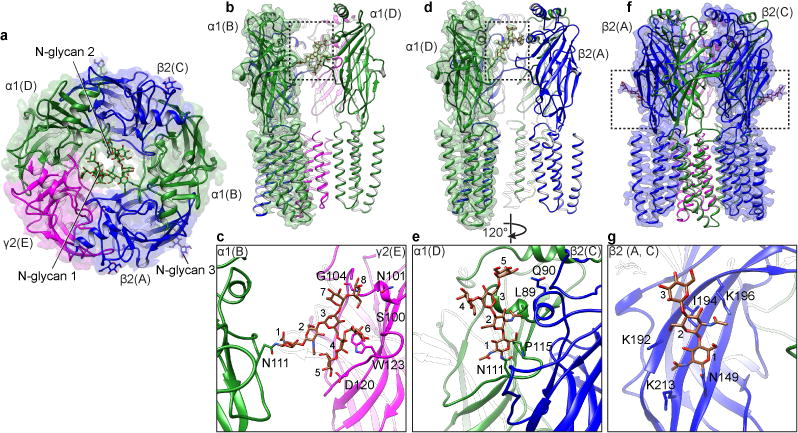
a, Synaptic view of receptor with glycosylation sites indicated. b,d, Side view of vestibule N-glycosylation attached to α1 subunits. Subunits β2 and γ2 are hidden for clarity. N-linked glycans are indicated by dashed black boxes. c,e, Detailed structures of N-linked glycans. c, NAG1-NAG2-BMA3-MAN4-MAN5-MAN6-MAN7-MAN8. e, NAG1-NAG2-BMA3-MAN4-MAN5. f,g, Reference and detailed structures of peripheral N-linked glycosylation on β2 subunits. Chain IDs are in parentheses.
Each glycan chain blocks nearly half of the diameter of the vestibule, leaving a relatively narrow path for ion permeation. The observed gap is approximately 5-8 Å in width, approximating open-channel diameter estimates for the Cys-loop receptor superfamily44,45 (Extended Data Fig. 9). An alternative path for ion entry into the extracellular mouth of the channel is found at subunit interfaces proximal to the membrane. Fenestrations ~7-10 Å wide at a subset of these junctions would allow for hydrated chloride to pass through, similar to what was observed in the β3 homopentamer (Extended Data Fig. 9)16. Thus, permeation through the synaptic GABA-A receptor may involve both the extracellular vestibule and these interfacial fenestrations.
The transmembrane region
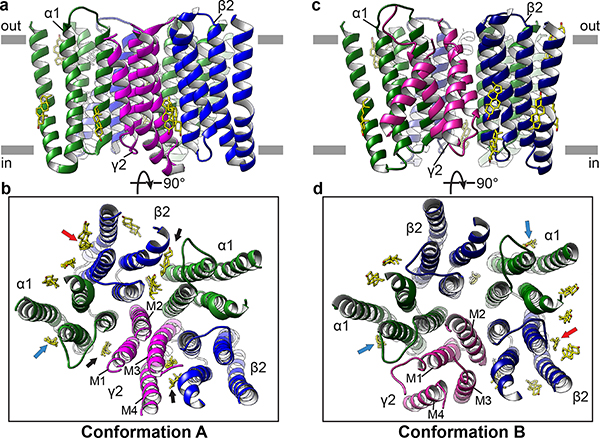
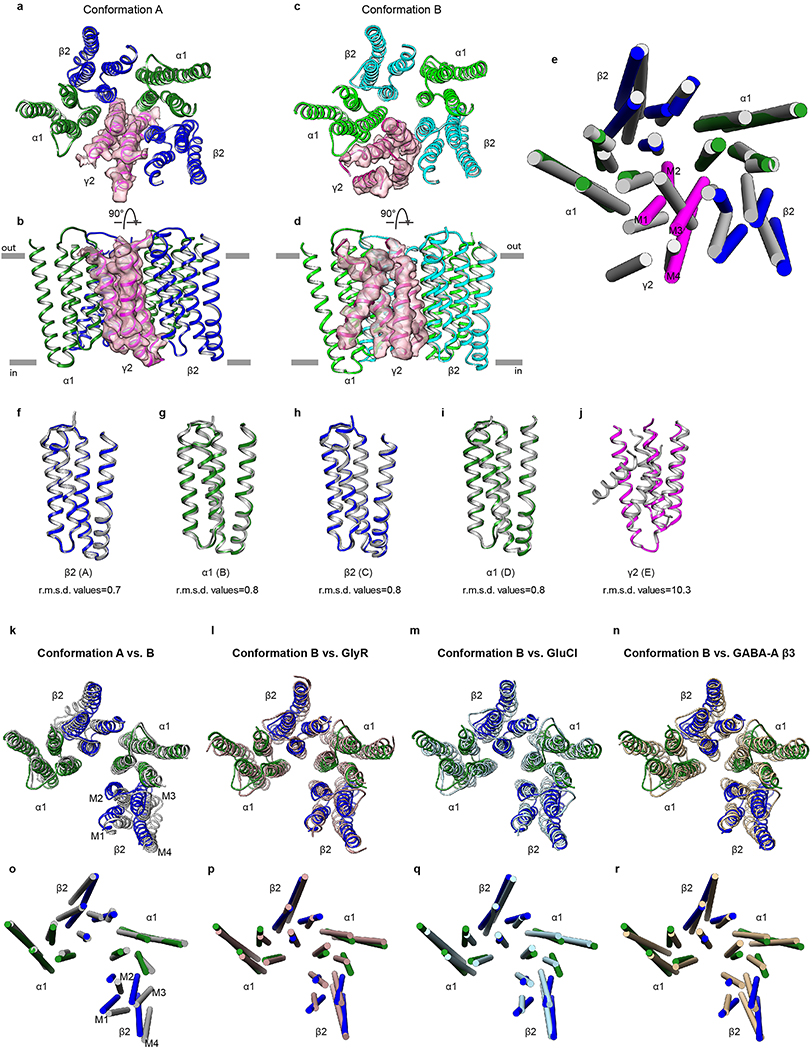
We discovered heterogeneity in the EM data that resulted in two classes of density maps we call conformations A and B, representing approximately 60% and 40% of our particle dataset (Extended Data Fig. 3). The major differences in conformation are restricted to the TMD and to ECD loops that directly contact the TMD (Extended Data Fig. 8). While of great interest, we interpret these conformational differences with caution, as the structures were obtained in the presence of detergent and the TMD deviates from the five-fold symmetry observed in homopentameric receptors (Fig. 6).
Figure 6. Conformational arrangements of transmembrane domain.
a,b Side and top views of the TM domain in conformation A. c,d, Side and top views of the TM domain in Conformation B. In b,d, putative cholesterol molecules are shown as sticks. Red arrows indicate sites that overlap with proposed endocannabinoid and pregnenolone sulfate (PS) sites. Blue arrows indicate sites shared with PS. Black arrows indicate sites shared with the neurosteroids pregnanolone and THDOC.
Conformation B is approximately 5-fold symmetric in the TMD in comparison to conformation A (Extended Data Fig. 10 a-d). In conformation B, this pseudo-symmetry breaks down locally in the γ2 subunit, which adopts a backbone tertiary fold distinct from that observed in the α1 and β2 subunits (Fig. 6C, Extended Data Fig. 8e). The M3 and M4 helices of the γ2 subunit adopt a unique conformation and tilt ~20-30° relative to other TM helices (Extended Data Fig. 10e). While the density for these two helices is not clear enough to determine the register, we can clearly trace the backbone (Extended Data Fig. 10 a-d). The extracellular end of the M2 helix tilts toward the pore axis reducing the pore diameter to below the diameter of Cl− (Extended Data Fig. 9). In conformation A, the γ2 subunit collapses into the pore (Fig. 6b), with its M2 helix approximately parallel to the channel axis and blocking the entire length of the transmembrane permeation pathway (Extended Data Fig. 9). The TMD conformation of the γ2 subunit needs further analysis to test its relevance in the physiological gating cycle of the receptor.
Previous studies indicate the TMD of GABA-A receptors contains a number of solvent-accessible cavities that form the binding sites of numerous drugs and compounds, including barbiturates, anesthetics, neurosteroids and ethanol19,46. In the density maps of the TMD for both conformations A and B, we identified a number of sausage-shaped densities that we modeled as CHS, which may hydrolyze and remain associated with hydrophobic regions as cholesterol47. In our structures, these molecules are located at membrane-subunit interfaces in the TMD or intercalate between two adjacent subunits, forming extensive contacts with the TM helices (Fig. 6b, d). Further, in both conformations A and B, we found cholesterol occupies an intrasubunit site at the junction of M3 and M4 helices facing the lipid bilayer. This finding is consistent with recent studies revealing binding of endogenous cannabinoids48 and neurosteroids49,50 in sites that overlap in part with the cholesterols, suggesting these sites underlie a common mechanism for modulation of the GABA-A receptor family.
Conclusion
Here we present high resolution structures of the predominant synaptic isoform of the human GABA-A receptor. The structures illuminate atomic-scale mechanisms of neurotransmitter binding and GABA selectivity for β-α subunit interfaces. The complex with the benzodiazepine-site antagonist flumazenil reveals principles of selectivity and architecture for this therapeutically important class of drugs. The elucidation of orthosteric and allosteric site recognition provides an expanded blueprint for exploring pharmacologically tractable loci in the other Cys-loop receptor superfamily members. The EM density maps reveal two distinct transmembrane domain conformations that raise questions for future studies and may relate to the ability of this receptor, more so than other Cys-loop receptor superfamily members, to be modulated by many chemically distinct classes of drugs via its transmembrane domain.
Methods
Protein construct optimization, expression and purification
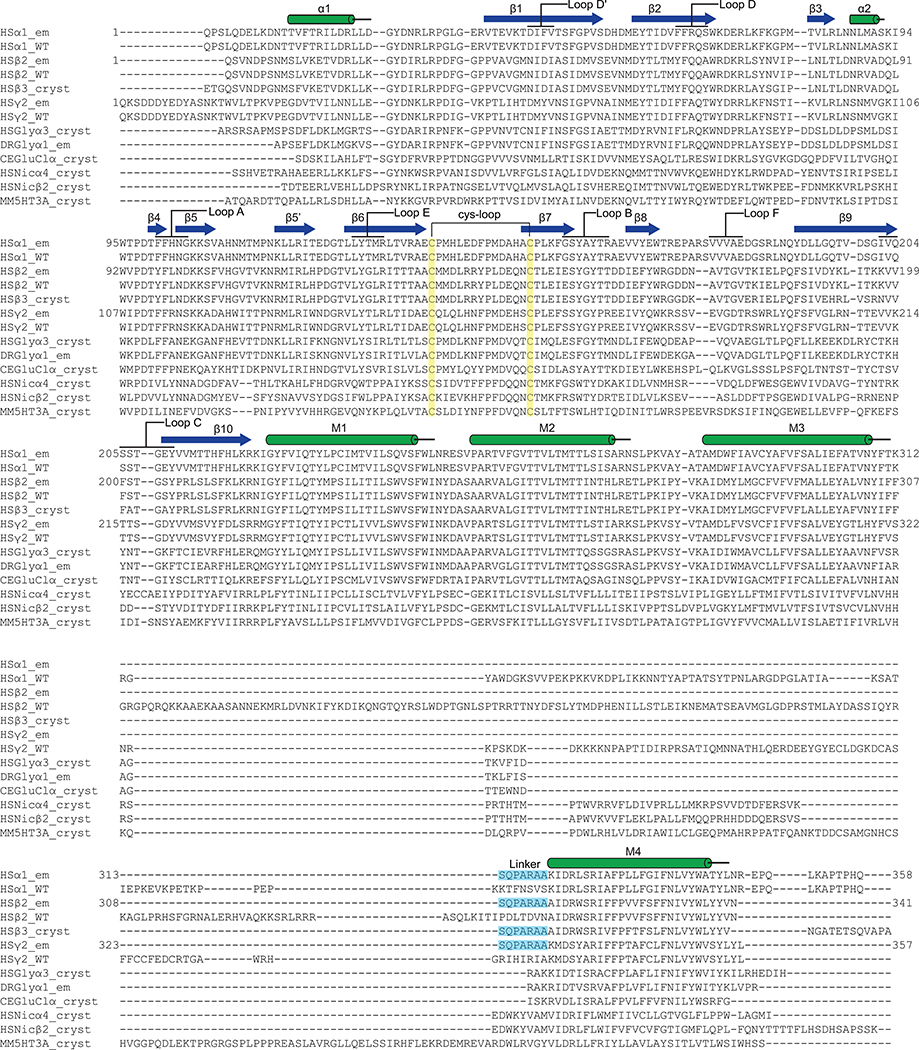
The human α1, β2 and γ2 GABA-A receptor subunit genes were codon optimized, synthesized, and cloned into the pEZT-BM expression vector51. The enhanced green fluorescent protein (GFP) was inserted into the M3-M4 loop of each subunit for small scale optimization of constructs and expression conditions. Co-transfections of HEK cells with combinations of GFP-tagged and non-tagged subunits analyzed by fluorescence-detection size-exclusion chromatography (FSEC)52 revealed that while α1 and β2 subunits assemble together robustly as heteropentamers, γ2 subunits only expressed as a part of pentamers including both α1 and β2 subunits. Earlier experiments suggested that when these three subunits are present in a pentamer, the stoichiometry of α12β22γ21 is invariable22,23. Thus, a twin strep tag was placed at the N-terminus of the γ2 subunit following the predicted signal peptide cleavage site53. Several constructs were tested via cryo-electron microscopy (cryo-EM). The best-ordered density maps resulted from production of receptors wherein a 7 amino acid linker16,79 was used in place of the intracellular loop between transmembrane helices 3 and 4 for all subunits (Extended Data Fig. 1). Residue numbering in the text and atomic models is for the mature (signal-peptide cleaved) human isoforms of all subunits.
Bacmam virus for each subunit was produced and titered as described for the α4β2 nicotinic receptor51. 4-6 L of HEK293S GnTI− cells54 (ATCC CRL-3022) in suspension were transduced with multiplicities of infection of 0.5:0.5:0.25 for the α1:β2:γ2 subunits, respectively. At the time of transduction, valproic acid (sodium salt, Sigma-Aldrich) was added to 3 mM and flumazenil (Santa Cruz Biotechnology) to 10 μM to boost expression. Protein expression was carried out at 30 °C and 8% CO2. Cells were collected after ~72 hr by centrifugation, resuspended in 20 mM Tris, pH 7.4, 150 mM NaCl (TBS buffer), 1 μM flumazenil, 2 mM γ-aminobutyric acid (GABA; Sigma-Aldrich) and 1 mM phenylmethanesulfonyl fluoride (Sigma-Aldrich), and disrupted using an Avestin Emulsiflex. Lysed cells were centrifuged for 15 minutes at 10,000 g; supernatants containing membranes were centrifuged for 2 hr at 186,000 g. Membrane pellets were mechanically homogenized and solubilized for 1 hr at 4 °C in a solution containing TBS, 40 mM n-dodecyl-β-D-maltopyranoside (DDM; Anatrace), 1 μM flumazenil, and 2 mM GABA. Solubilized membranes were centrifuged for 40 minutes at 186,000 g then passed over Strep-Tactin XT Superflow (IBA) affinity resin. The resin was washed with Size Exclusion Chromatography (SEC) buffer containing TBS, 1 mM DDM, 1 μM flumazenil, 2 mM GABA and 0.2 mM CHS (Anatrace), and eluted in the same buffer containing 50 mM biotin (Sigma-Aldrich).
Generation of monoclonal antibodies and Fab fragments
The 1F4 monoclonal antibody (mAb) against the α1β2γ2 GABA-A receptor (IgG2b, κ) was raised using standard methods (Monoclonal Core, Vaccine and Gene Therapy Institute, Oregon Health & Science University). High affinity and specificity of the antibody for properly folded pentameric GABA-A receptor was assayed by FSEC with GFP-tagged receptor (shift in elution volume) and western blot (no binding). Fab fragments were generated by papain cleavage of whole antibody at a final concentration of 1 mg/mL for 2 hours at 37 °C in 50 mM NaPO4, pH 7.0, 1 mM EDTA, 10 mM cysteine and 1:30 w:w papain. Digestion was quenched using 30 mM iodoacetamide at 25 °C for 10 min. Fab was purified by anion exchange using a HiTrap Q HP (GE Healthcare) column in 10 mM Tris, pH 8.0 and a NaCl gradient elution. Cloning and sequencing of Fab antibody regions were performed from mouse hybridoma cells.
Cryo-EM sample preparation
Purified GABA-A receptor from affinity chromatography was mixed with Fab in a 3:1 w:w ratio and injected over a Superose 6 Increase 10/300 GL column (GE Healthcare) equilibrated in SEC buffer. Peak fractions were assayed by SEC, monitoring tryptophan fluorescence. The peak fraction was concentrated ten-fold to 5-6 mg/ml. Three μL of purified GABA-A receptor + GABA + flumazenil + Fab complex was applied to glow-discharged gold R1.2/1.3 200 mesh holey carbon grids (Quantifoil) and immediately blotted for 3 s at 100% humidity/4 °C, then plunge-frozen into liquid ethane cooled by liquid nitrogen using a Vitrobot Mark IV (FEI).
Cryo-EM image collection and processing
Electron microscopy images were collected using a Titan Krios electron microscope (FEI) operated at an acceleration voltage of 300 kV. Dose-fractionated images were recorded on a K2 Summit direct electron detector (Gatan) equipped with GIF quantum energy filter (20 e−V) (Gatan) in super-resolution model (super-resolution pixel size: 0.535 Å/pixel). 5,594 images were collected over two 72-hour sessions. Each micrograph was exposed for 10 sec with a dose rate of 4.7 e−/Å2/sec (total specimen micrograph dose, 47 e−/Å2), with 40 frames per micrograph. Images were recorded using the automated-acquisition program EPU (FEI) with set defocus values ranging from −1.8 μm to −3 μm.
Dose-fractionated images (movies) were gain normalized, 2X Fourier binned (resulting in a pixel size of 1.07), aligned, dose-weighted and summed using MotionCor255. Defocus values were estimated using GCTF56. A total of 1,050,737 auto-picked particles were subjected to 2D classification to remove false positive and defective particles. The particle set then underwent 3D classification, resulting in 494,727 particles for particle polishing in Relion57. 2D classification was used after particle polishing to obtain a final set of 493,104 polished particles.
3D refinement of this polished particle set resulted in a map with clear backbone and side chain density for all of the ECD, Fab variable fragments and the TMDs of the α subunits. There was obvious structural heterogeneity or disorder in the TMDs of the β and γ subunits. We successfully resolved this heterogeneity using the output orientations from the 3D refinement of the polished particle set to perform 3D classification with local angular sampling58. This local angular sampling approach revealed improved TMD features with particles segregating into two distinct TMD conformations. 292,662 polished particles from five 3D classes were pooled for 3D refinement in Relion and yielded a reconstruction of the GABA-A receptor conformation A at 3.92 Å overall resolution (FSC=0.143). The remaining 200,442 particles from three 3D classes were combined and yielded a reconstruction of the GABA-A receptor conformation B also at 3.86 Å overall resolution. ResMap59 was used to estimate local resolution.
Model building, refinement and validation
The nominally higher-resolution conformation B model was built first, focusing initially on the well-ordered ECD. A homology model for each subunit was made using the crystal structure of the β3 homopentameric GABA-A receptor (RCSB: 4COF) via Swiss-Model60. From side chain and glycosylation features in the ECDs we were able to unambiguously assign the α1, β2 and γ2 subunits; rigid docking of the homology models into these densities supported the assignments. Chain IDs in the models are: A, β2; B, α1; C, β2; D, α1; E, γ2. Density for Fab fragments was observed extending from the ECD of α1 subunits roughly parallel to the membrane plane. Swiss-Model was used to generate a homology model of the Fab light chain using PDB entry 1UYW and of the heavy chain using PDB entry 4WEB and these chains were docked into the EM density at one Fab site using Chimera61. Manual adjustments of the receptor-Fab structure were then performed in Coot62,63. The ECD and TMD halves of each subunit and the variable half of each Fab were rigid body fitted into the density map. The variable domain of the Fab was rebuilt into unambiguous density; the density associated with the Fab constant domain was too disordered for both Fab copies to allow building of an atomic model; as this portion of the Fab was not of biological interest, the final model includes just the Fab variable domains. Once this first Fab copy was rebuilt, it was copied into the additional sites on the second α1 subunit and manually adjusted. Well-ordered N-linked glycans were built in the ECD channel vestibule and shorter N-linked chains along the outer surface of the ECD. Strong density for ligands was observed at β-α interfaces (modeled as GABA) and at the α-γ interface (flumazenil). The extended conformation of flumazenil is consistent with its crystal structure64. No unaccounted-for density was observed at the α-β or γ-β interfaces in either conformation. The ECD of conformation B was docked into the map for conformation A; we noted no meaningful conformational differences except in the loops contacting the TMD.
In conformation A, the TMD portions of the α1 subunits (chains B, D) are well ordered and there was no ambiguity regarding register. The β2 subunits are less well-ordered but we are still confident about register as the backbone adopts internally consistent conformations. In the γ subunit, which undergoes a conformational rearrangement to fill the pore with its M2 helix, the linker connecting β10 to M1 and the M2-M3 loop are disordered. Nonetheless, the 4-helix bundle from this subunit holds together in a conformation akin to the well-ordered subunits, and to that observed in the β3 homopentameric structure, and thus we are confident about the amino acid register in the γ subunit TMD in conformation A.
In conformation B, the TMD is comparatively less well-ordered than in conformation A. The α1 subunits remain, as in conformation A, well ordered, with clear side chain density. The β2 subunit at the chain A position is well-ordered, however the chain C β2 subunit, which packs opposite the pore from the γ2 subunit, is not well ordered. Nonetheless, its conformation in less sharpened maps was clear enough to dock the 4-helix bundle in a conformation similar to that observed in chain A. The γ2 subunit in conformation B is comparatively disordered and its modeling is problematic as the helix bundle is not held together in a familiar arrangement. We modeled the M1 and M2 helices with amino acids placed tentatively based on side chain density. The M3 and M4 helices were built as poly-alanine chains. Due to a lack of strong interaction of the γ2 subunit in this conformation with its ECD half, the tip of the γ2 subunit Cys-loop did not have clear density and we omitted 3 residues from this region. Otherwise, the ECD modeling is continuous from the first amino acid to the end of β10. In the TMD, we modeled many strong oblong features as CHS; these occupy distinct sites between the two receptor conformations. After manual building in Coot, global real space coordinate and B factor refinement with NCS restraints were performed in Phenix65. The refined model quality was assessed using Molprobity (Extended Data Fig. 5). The following segments of the receptor were not modeled due to weak density features in the corresponding regions: in Conformation A, β2 (chain A and C): N-7,341-C; α1 (chain B): N-9, 346-C; α1 (chain D): N-9, 348-C; γ2 (chain E): N-24, 233-236, 287-291, 356-C; in Conformation B, β2 (chain A and C): N-7, 341-C;(chain B): N-12, 346-C; α1 (chain D): N-10, 348-C; γ2 (chain E): N-24,158-160, 288-296, 319-326, 347-C.
The validation to test for overfitting of the model was performed as previously described66. Briefly, the atom positions of the final refined models were randomly displaced by a maximum of 0.5 Å using PDBSET in the CCP4 suite67. This perturbed model was then refined in Phenix in real space against the first half map of the reconstruction comprising 50% of the particles. A map vs. model FSC comparison was made for this model vs. the map used in its refinement (“work”), as well as the same model vs. the half map not used in refinement (“free”). The FSC curves of work and free half maps vs. model agree well (Extended Data Fig. 5).
Schematic interaction analysis of GABA and flumazenil was performed by Ligplot+68. Subunit interfaces were analyzed using the PDBePISA server69. Structural biology software packages were compiled by SBGrid70.
For display settings in figures, density maps for the ECD were sharpened as shown in Extended Data Fig. 5a with a B factor −186 Å2 for conformation A and −153 Å2 for conformation B. Density maps displayed for TMD were sharpened with a B factor of −100 Å2 for both conformations. In Figs. 2 and 3, density maps for GABA and flumazenil were rendered in Chimera at threshold levels of 0.018 and 0.04, respectively. In Extended Data Fig. 6, density maps were displayed at the following threshold levels: a-h, 0.024; i-k, 0.0158; l, 0.06; m and n, 0.03. In Extended Data Fig. 7, density maps were displayed at the following threshold levels: a-h, 0.024; i-k, 0.015; l, 0.05; m and n, 0.027. In Figs. 1, 5 and Extended Data Fig. 9, density maps were rendered in Chimera at a threshold level of 0.024. In Extended Data Fig. 10a-d, density maps were rendered in Chimera at a threshold level of 0.02.
Electrophysiology
Whole cell voltage-clamp recordings were made from cells transiently transfected with the constructs used in structural analysis. For the patch-clamp experiments, adherent HEK293S GnTI− cells were transiently transfected with pEZT-based plasmids 2-3 days before recording. Each 35 mm dish of cells was transfected with the DNA of α1 subunit, β2 subunit and γ2 subunit in a ratio of 1:1:4 to ensure the incorporation of γ2 subunit. At the time of transfection, cells were moved to 30 °C. On the day of recording, cells were washed with bath solution, which contains (in mM): 140 NaCl, 2.4 KCl, 4 MgCl2, 4 CaCl2, 10 HEPES pH 7.3 and 10 glucose. Borosilicate pipettes were pulled and polished to a resistance of 2-4 MΩ. The pipette solution contained (in mM): 150 CsCl, 10 NaCl, 10 EGTA, 20 HEPES pH 7.3. Cells were clamped at −75 mV. The recordings were made with an Axopatch 200B amplifier, low pass filtered at 2 kHz and digitized at 5 kHz using the Digidata 1440A and pClamp 10 software (Molecular Devices). The GABA, flumazenil, diazepam (Tocris Bioscience), and bicuculline (Sigma-Aldrich) solutions were prepared in bath solution. Stock solution of 1 M GABA was prepared in water; stock solutions of 100 mM bicuculline, 10 mM diazepam and 10 mM flumazenil were prepared in DMSO. Solution exchange was achieved using a gravity driven RSC-200 rapid solution changer (Bio-Logic).
Radioligand binding
Experiments to measure binding of [3H]-flumazenil (PerkinElmer, 84.4 Ci/mmol) to the GABA-A receptor were performed with protein purified as for cryo-EM but in the absence of flumazenil, GABA or Fab. The concentration of binding sites was kept at 1 nM after a series of preliminary experiments to test the optimal protein concentration. For the binding experiments with +Fab sample, Fab was added in excess (100 nM). In addition to the receptor, the binding assay conditions included 20 mM Tris pH 7.4, 150 mM NaCl, 1 mM DDM, and 1 mg/mL streptavidin-YiSi scintillation proximity assay beads (SPA; GE Healthcare Life Sciences). Non-specific signal was determined in the presence of 100 μM [1H]-flumazenil. All data shown are from background-subtracted measurements. For radioligand competition experiments to measure the Ki of diazepam, binding site concentration was 10 nM and the concentration of [3H]-flumazenil was also 10 nM. Each set of binding reaction experiments was performed 2-3 times, in triplicate. The data were analyzed using Prism 6 software (GraphPad).
Data availability
Atomic coordinates of the two GABA-A receptor-GABA-flumazenil-Fab complexes have been deposited in the Protein Data Bank (PDB; Conformation A, 6D6U; Conformation B, 6D6T). The cryo-EM density maps have been deposited in the Electron Microscopy Data Bank (Conformation A, EMD-7817; Conformation B, EMD-7816).
Extended Data
Extended Data Figure 1. Alignment of GABA-A and other Cys-loop receptor subunits.
EM constructs (γ2 affinity tag not shown) are numbered starting with the first residue of the mature protein. Sequences aligned (UniProt or PDB accession codes): Homo sapiens α1 GABA-A (HS, P14867), H. sapiens β2 GABA-A (P47870), H. sapiens γ2 GABA-A (P18507), H. sapiens GABA-A β3 (4COF), H. sapiens glycine α3 (5CFB), Danio rerio glycine α1 (DR, 3JAE), Caenorhabditis elegans α (CE, 3RHW), H. sapiens α4 nAChR (5KXI), H. sapiens β2 nAChR (5KXI) and Mus musculus 5-HT3 receptor (MM, 4PIR). α-helices (cylinders), β-strands (arrows), and inserted linker (cyan) are indicated.
Extended Data Figure 2. Biochemistry and binding assay.
a, FSEC of GABA-A receptor with and without Fab bound and SDS-PAGE analysis of a representative purification (from n>10 purifications). b, Saturation binding assay with [3H]-flumazenil. Single site binding fits for receptor alone and receptor plus Fab both exhibited a Hill slope of ~1 (0.97 and 0.89 respectively). Plotted results are from a representative experiment performed in triplicate. n=3 independent experiments. Data point center is the mean. Error bars are standard deviation, shown for a representative triplicate measurement. c, Competition of 10 nM [3H]-flumazenil with diazepam. Calculated Ki for diazepam assumes a Kd of [3H]-flumazenil of 7.7 nM. n=2 independent experiments in triplicate. Error bars are standard error of the mean (s.d.), shown for a representative triplicate measurement. d, Dose-response experiments in the presence or absence of Fab. HEK cells were transfected with EM constructs and patch-clamped with or without pretreatment of 1 μM Fab for one minute. Hill slopes are 1.7 and 1.4 with and without Fab, respectively. Published values for GABA EC50 range from 6.6 μM – 107 μM71–74. n=3 experiments from different cells. Data point center is the mean. Error bars are standard deviation. e, Whole cell patch clamp recording of long application of EM ligands at concentrations used in EM sample to assess conformational state at equilibrium. The two traces shown are from one continuous recording; in between the two responses, Fab was added to 1 μM for one minute to saturate all receptor sites before second application of GABA and flumazenil (including Fab). n=3 independent experiments. f-g, Docking of diazepam at the benzodiazepine binding site based on superposition of benzodiazepine rings. The phenyl ring of diazepam would orient toward the membrane, possibly forming π-π stacking interactions with Y58 on the complementary subunit. Similar to flumazenil, the halogen of diazepam could interact with H102, suggesting this contact is conserved broadly among benzodiazepines and flumazenil. This orientation is largely consistent with predictions from a modeling and docking study75 and distinct from that suggested by affinity labeling76. In this latter prediction, the diazepam phenyl group orients away from the membrane and would require local reorganization of side chains to avoid atomic clashes. h-j, Structural details of Fab-α1 interaction. Labeled residues are on α subunit. i, Top view. j, Side view.
Extended Data Figure 3. Cryo-EM image processing procedure.
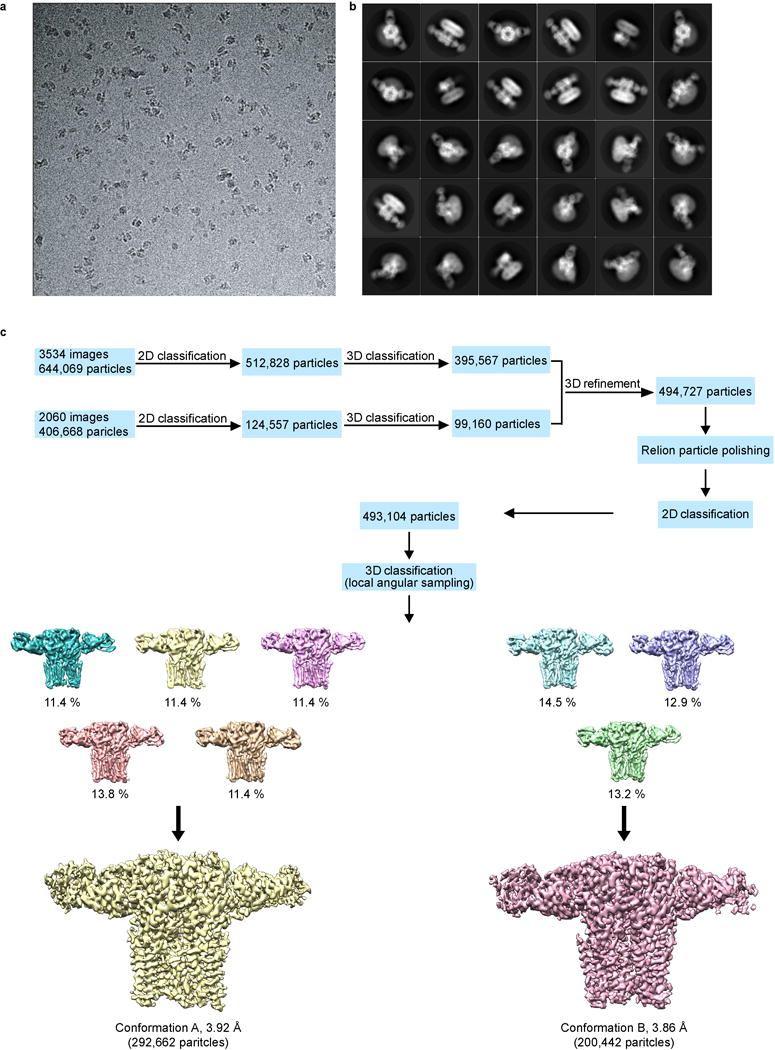
a, Representative cryo-electron micrograph of the GABA-A receptor-Fab complex. n=5,594 images. b, Images of selected two dimensional classes from reference-free two-dimensional classification by Relion. c, Overview of the image processing procedure (see Methods).
Extended Data Figure 4. Three-dimensional reconstructions of the two GABA-A receptor conformations.
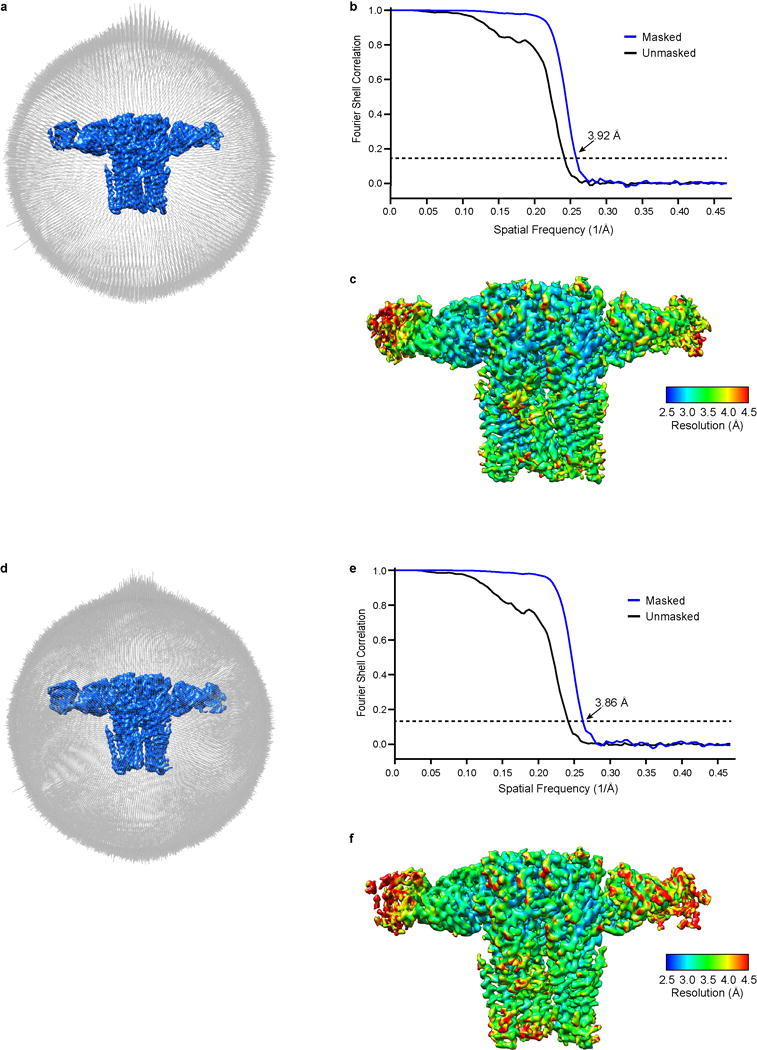
a, Angular distribution histogram of GABA-A receptor conformation A particle images. b, Fourier shell correlation (FSC) of conformation A maps before (black) and after (blue) masking. c, Local resolution of the GABA-A receptor estimated by ResMap. d-f, as in a-c but for GABA-A receptor conformation B.
Extended Data Figure 5. GABA-A receptor model-map validation.
a, Table 1, data collection and refinement statistics. b,c, FSC curves for cross-validation between the maps and models of both conformation A (b) and conformation B (c). FSC curves for final model versus summed map (whole) in black, for model versus half map in green (work), and for model versus half map not used for refinement in blue (free).
Extended Data Figure 6. Cryo-EM density of the GABA-A receptor in conformation A.
a-e, EM density map of the GABA-A receptor conformation A for a representative of each subunit. f-h, EM density segments of Loop C in α1, β2 and γ2 subunits. i-k, EM density segments of M2 helix in α1, β2 and γ2 subunits. l-n, EM density maps of ligand binding sites. l, Flumazenil; m-n, two GABA binding sites.
Extended Data Figure 7. Cryo-EM density of the GABA-A receptor in conformation B.
a-e, EM density map of the GABA-A receptor conformation B for a representative of each subunit; chain IDs are in parentheses. f-h, EM density segments of Loop C in α1, β2 and γ2 subunits. i-k, EM density segments of M2 helix in α1, β2 and γ2 subunits. l-n, EM density maps of ligand binding sites. l, Flumazenil; m-n, two GABA binding sites.
Extended Data Figure 8. Superposition of subunits.
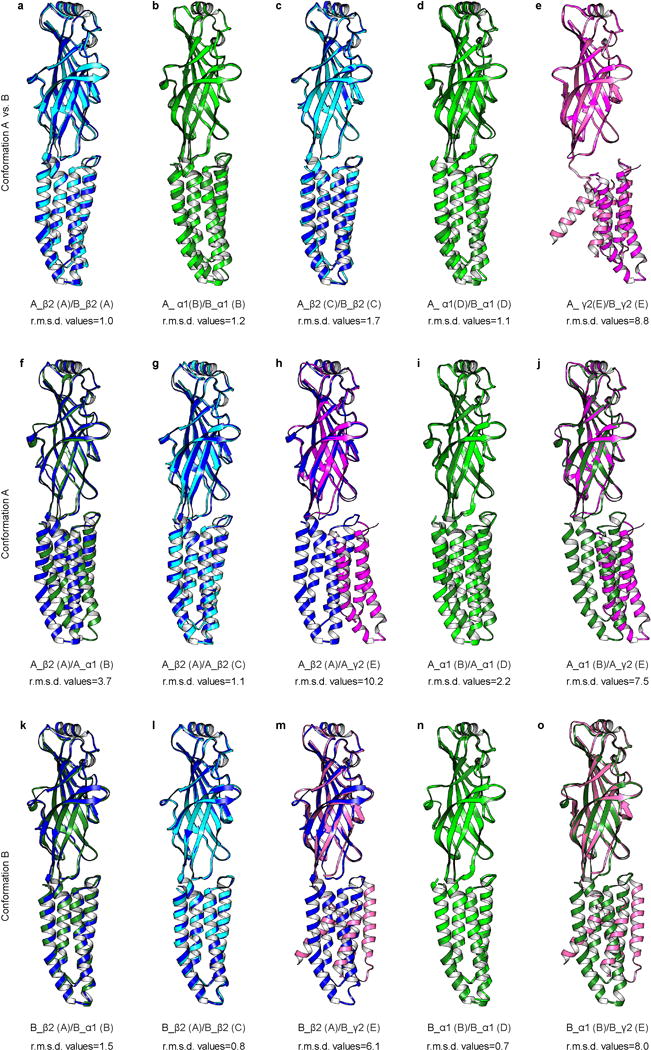
a-e, Subunits of conformation A are compared to the corresponding subunit from conformation B. f-j, Superposition of subunits within conformation A. k-o, Superposition of subunits within conformation B. Chimera MatchMaker was used to generate alignments; r.m.s.d. values in Å are for Cα atoms over entire subunit. Chain IDs are in parentheses.
Extended Data Fig. 9. Permeation pathway and subunit interfaces.
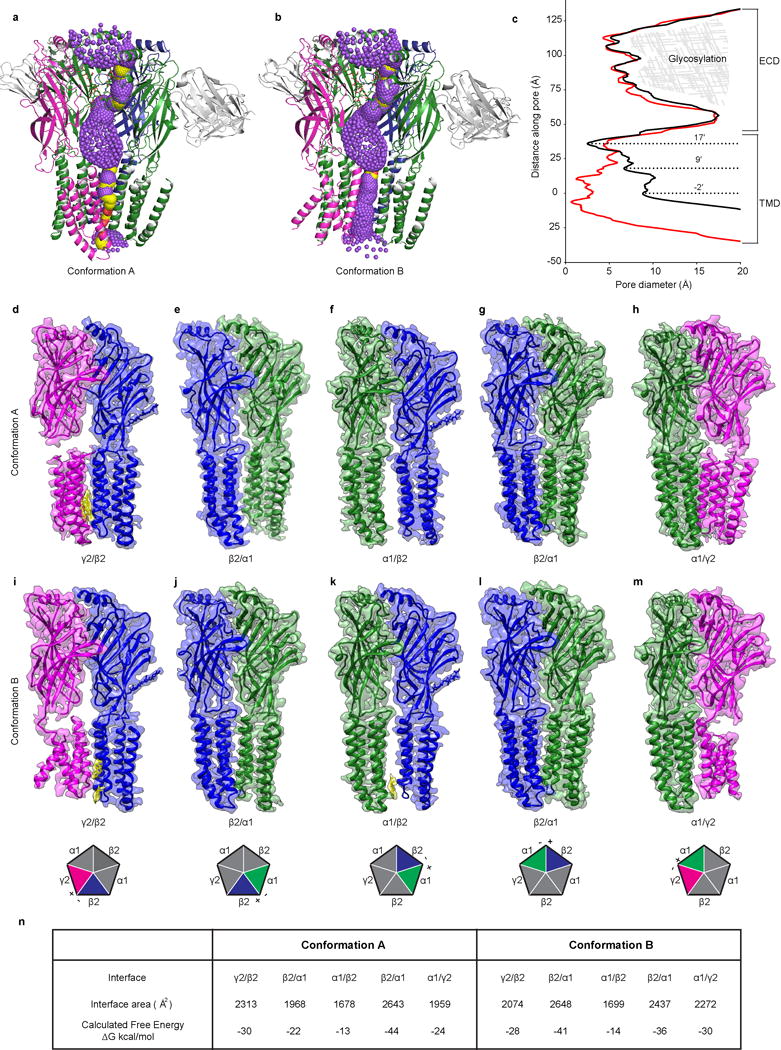
a, Cartoon of permeation pathway for conformation A. Single β2 subunit is removed for clarity. Purple spheres indicate pore diameters >5.6 Å; yellow is >2.8 Å and <5.6 Å; red is <2.8 Å. b, Same as a but for conformation B. c, Pore diameters for conformation A (red) and conformation B (black). The zero value along the y-axis of the plot is aligned with the α-carbon of the −2′ position of conformation B. d-m, Side view of two adjacent subunits in conformations A (d-h) and B (i-m). View is from the periphery of the receptor toward the pore axis. Cholesterol at the interface is also shown in yellow in d, i and k. Cartoon pentagons (bottom) are colored to illustrate all subunits composing the displayed interface; subunits not participating in the displayed interface are grey. Principal (+) and complementary (-) sides of the displayed interface are labeled on each pentagon. n, Analysis of the subunit interfaces of both conformations using PDBePISA server69.
Extended Data Figure 10. Transmembrane domain flexibility and comparison with reference structures.
a-b, Top and side view of the TMD of conformation A with density for the γ2-subunit shown. c-d, As in a, but for conformation B. e, Transmembrane domain superposition of conformation A (subunits in color) over conformation B (gray). α-helices are represented as cylinders. f-j, Superposition of single subunit TMD in conformation A (colored) with its corresponding subunit in conformation B (gray). k-r, Superpositions of the 4 non-γ subunits. Top and bottom rows contain same superpositions in different representations. Conformation B is shown in all panels with α subunits in green and β subunits in blue. Reference structures include the glycine receptor with ivermectin bound (3JAF)77, GluCl with ivermectin bound (3RHW)78 and the GABA-A β3 homopentamer (4COF)16.
Supplementary Material
Acknowledgments
We thank D. Cawley for antibody production, X. Bai for EM discussion, P. Emsley for guidance in glycosylation tools in Coot, W. Costello for initial construct screening and all members of the Hibbs Lab for discussion. Single-particle cryo-EM data were collected at the University of Texas Southwestern Medical Center Cryo-Electron Microscopy Facility, which is supported by the CPRIT Core Facility Support Award RP170644. We thank D. Nicastro and D. Stoddard for support in facility access and data acquisition. R.W. acknowledges support from the Sara and Frank McKnight Fund for Biochemical Research and the NIH (T32GM008203). R.E.H. is supported by a McKnight Scholar Award, The Welch Foundation (I-1812) and the NIH (DA037492, DA042072, and NS095899).
Footnotes
Author Contributions: S.Z. performed sample preparation, data collection, model building and writing of the manuscript. C.M.N. and R.W. collected microscopy data and edited the manuscript. J.T. performed electrophysiology experiments. J.J.K. assisted in biochemistry and edited the manuscript. R.E.H. oversaw all aspects of the project.
Author Information: The authors declare no competing financial interests. Readers are welcome to comment on the online version of the paper.
Publisher’s note: Springer Nature remains neutral with regard to jurisdictional claims in published maps and institutional affiliations.
References
- 1.Nutt DJ, Malizia AL. New insights into the role of the GABA(A)-benzodiazepine receptor in psychiatric disorder. Br J Psychiatry. 2001;179:390–396. doi: 10.1192/bjp.179.5.390. [DOI] [PubMed] [Google Scholar]
- 2.Maconochie DJ, Zempel JM, Steinbach JH. How quickly can GABAA receptors open? Neuron. 1994;12:61–71. doi: 10.1016/0896-6273(94)90152-x. [DOI] [PubMed] [Google Scholar]
- 3.Braat S, Kooy RF. The GABAA Receptor as a Therapeutic Target for Neurodevelopmental Disorders. Neuron. 2015;86:1119–1130. doi: 10.1016/j.neuron.2015.03.042. [DOI] [PubMed] [Google Scholar]
- 4.Chuang SH, Reddy DS. Genetic and Molecular Regulation of Extrasynaptic GABA-A Receptors in the Brain: Therapeutic Insights for Epilepsy. J Pharmacol Exp Ther. 2018;364:180–197. doi: 10.1124/jpet.117.244673. [DOI] [PMC free article] [PubMed] [Google Scholar]
- 5.Jacob TC, Moss SJ, Jurd R. GABA(A) receptor trafficking and its role in the dynamic modulation of neuronal inhibition. Nat Rev Neurosci. 2008;9:331–343. doi: 10.1038/nrn2370. [DOI] [PMC free article] [PubMed] [Google Scholar]
- 6.Roberts E, Frankel S. gamma-Aminobutyric acid in brain: its formation from glutamic acid. J Biol Chem. 1950;187:55–63. [PubMed] [Google Scholar]
- 7.Awapara J, Landua AJ, Fuerst R, Seale B. Free gamma-aminobutyric acid in brain. J Biol Chem. 1950;187:35–39. [PubMed] [Google Scholar]
- 8.Sternbach LH. The benzodiazepine story. J Med Chem. 1979;22:1–7. doi: 10.1021/jm00187a001. [DOI] [PubMed] [Google Scholar]
- 9.Sieghart W. Allosteric modulation of GABAA receptors via multiple drug-binding sites. Adv Pharmacol. 2015;72:53–96. doi: 10.1016/bs.apha.2014.10.002. [DOI] [PubMed] [Google Scholar]
- 10.Sigel E, Buhr A. The benzodiazepine binding site of GABAA receptors. Trends Pharmacol Sci. 1997;18:425–429. doi: 10.1016/s0165-6147(97)01118-8. [DOI] [PubMed] [Google Scholar]
- 11.Votey SR, Bosse GM, Bayer MJ, Hoffman JR. Flumazenil: a new benzodiazepine antagonist. Ann Emerg Med. 1991;20:181–188. doi: 10.1016/s0196-0644(05)81219-3. [DOI] [PubMed] [Google Scholar]
- 12.Lobo IA, Harris RA. GABA(A) receptors and alcohol. Pharmacol Biochem Behav. 2008;90:90–94. doi: 10.1016/j.pbb.2008.03.006. [DOI] [PMC free article] [PubMed] [Google Scholar]
- 13.Sieghart W. Structure and pharmacology of gamma-aminobutyric acidA receptor subtypes. Pharmacol Rev. 1995;47:181–234. [PubMed] [Google Scholar]
- 14.Sigel E, Steinmann ME. Structure, function, and modulation of GABA(A) receptors. J Biol Chem. 2012;287:40224–40231. doi: 10.1074/jbc.R112.386664. [DOI] [PMC free article] [PubMed] [Google Scholar]
- 15.Nemecz A, Prevost MS, Menny A, Corringer PJ. Emerging Molecular Mechanisms of Signal Transduction in Pentameric Ligand-Gated Ion Channels. Neuron. 2016;90:452–470. doi: 10.1016/j.neuron.2016.03.032. [DOI] [PubMed] [Google Scholar]
- 16.Miller PS, Aricescu AR. Crystal structure of a human GABAA receptor. Nature. 2014;512:270–275. doi: 10.1038/nature13293. [DOI] [PMC free article] [PubMed] [Google Scholar]
- 17.Whiting PJ, McKernan RM, Wafford KA. Structure and pharmacology of vertebrate GABAA receptor subtypes. Int Rev Neurobiol. 1995;38:95–138. doi: 10.1016/s0074-7742(08)60525-5. [DOI] [PubMed] [Google Scholar]
- 18.Olsen RW. Allosteric ligands and their binding sites define gamma-aminobutyric acid (GABA) type A receptor subtypes. Adv Pharmacol. 2015;73:167–202. doi: 10.1016/bs.apha.2014.11.005. [DOI] [PubMed] [Google Scholar]
- 19.Forman SA, Miller KW. Anesthetic sites and allosteric mechanisms of action on Cys-loop ligand-gated ion channels. Can J Anaesth. 2011;58:191–205. doi: 10.1007/s12630-010-9419-9. [DOI] [PMC free article] [PubMed] [Google Scholar]
- 20.Walsh RMJ, et al. Structural principles of distinct assemblies of the human α4β2 nicotinic receptor. Nature. 2018 doi: 10.1038/s41586-018-0081-7. Accepted Manuscript 2017-11-15574B. [DOI] [PMC free article] [PubMed] [Google Scholar]
- 21.Marangos PJ, Patel J, Boulenger JP, Clark-Rosenberg R. Characterization of peripheral-type benzodiazepine binding sites in brain using [3H]Ro 5-4864. Mol Pharmacol. 1982;22:26–32. [PubMed] [Google Scholar]
- 22.Baumann SW, Baur R, Sigel E. Forced subunit assembly in alpha1beta2gamma2 GABAA receptors. Insight into the absolute arrangement. J Biol Chem. 2002;277:46020–46025. doi: 10.1074/jbc.M207663200. [DOI] [PubMed] [Google Scholar]
- 23.Baur R, Minier F, Sigel EA. GABA(A) receptor of defined subunit composition and positioning: concatenation of five subunits. FEBS Lett. 2006;580:1616–1620. doi: 10.1016/j.febslet.2006.02.002. [DOI] [PubMed] [Google Scholar]
- 24.Tretter V, Ehya N, Fuchs K, Sieghart W. Stoichiometry and assembly of a recombinant GABAA receptor subtype. J Neurosci. 1997;17:2728–2737. doi: 10.1523/JNEUROSCI.17-08-02728.1997. [DOI] [PMC free article] [PubMed] [Google Scholar]
- 25.Curtis DR, Duggan AW, Felix D, Johnston GA. GABA, bicuculline and central inhibition. Nature. 1970;226:1222–1224. doi: 10.1038/2261222a0. [DOI] [PubMed] [Google Scholar]
- 26.Ueno S, Bracamontes J, Zorumski C, Weiss DS, Steinbach JH. Bicuculline and gabazine are allosteric inhibitors of channel opening of the GABAA receptor. J Neurosci. 1997;17:625–634. doi: 10.1523/JNEUROSCI.17-02-00625.1997. [DOI] [PMC free article] [PubMed] [Google Scholar]
- 27.Amin J, Weiss DS. GABAA receptor needs two homologous domains of the beta-subunit for activation by GABA but not by pentobarbital. Nature. 1993;366:565–569. doi: 10.1038/366565a0. [DOI] [PubMed] [Google Scholar]
- 28.Mortensen M, et al. Photo-antagonism of the GABAA receptor. Nat Commun. 2014;5:4454. doi: 10.1038/ncomms5454. [DOI] [PMC free article] [PubMed] [Google Scholar]
- 29.Sigel E, Baur R, Kellenberger S, Malherbe P. Point mutations affecting antagonist affinity and agonist dependent gating of GABAA receptor channels. EMBO J. 1992;11:2017–2023. doi: 10.1002/j.1460-2075.1992.tb05258.x. [DOI] [PMC free article] [PubMed] [Google Scholar]
- 30.Smith GB, Olsen RW. Identification of a [3H]muscimol photoaffinity substrate in the bovine gamma-aminobutyric acidA receptor alpha subunit. J Biol Chem. 1994;269:20380–20387. [PubMed] [Google Scholar]
- 31.Boileau AJ, Evers AR, Davis AF, Czajkowski C. Mapping the agonist binding site of the GABAA receptor: evidence for a beta-strand. J Neurosci. 1999;19:4847–4854. doi: 10.1523/JNEUROSCI.19-12-04847.1999. [DOI] [PMC free article] [PubMed] [Google Scholar]
- 32.Goldschen-Ohm MP, Wagner DA, Jones MV. Three arginines in the GABAA receptor binding pocket have distinct roles in the formation and stability of agonist- versus antagonist-bound complexes. Molecular pharmacology. 2011;80:647–656. doi: 10.1124/mol.111.072033. [DOI] [PMC free article] [PubMed] [Google Scholar]
- 33.Buhr A, Baur R, Sigel E. Subtle changes in residue 77 of the gamma subunit of alpha1beta2gamma2 GABAA receptors drastically alter the affinity for ligands of the benzodiazepine binding site. J Biol Chem. 1997;272:11799–11804. doi: 10.1074/jbc.272.18.11799. [DOI] [PubMed] [Google Scholar]
- 34.Wingrove PB, Thompson SA, Wafford KA, Whiting PJ. Key amino acids in the gamma subunit of the gamma-aminobutyric acidA receptor that determine ligand binding and modulation at the benzodiazepine site. Mol Pharmacol. 1997;52:874–881. doi: 10.1124/mol.52.5.874. [DOI] [PubMed] [Google Scholar]
- 35.Wieland HA, Luddens H, Seeburg PH. A single histidine in GABAA receptors is essential for benzodiazepine agonist binding. J Biol Chem. 1992;267:1426–1429. [PubMed] [Google Scholar]
- 36.Dunn SM, Davies M, Muntoni AL, Lambert JJ. Mutagenesis of the rat alpha1 subunit of the gamma-aminobutyric acid(A) receptor reveals the importance of residue 101 in determining the allosteric effects of benzodiazepine site ligands. Mol Pharmacol. 1999;56:768–774. [PubMed] [Google Scholar]
- 37.Davies M, Bateson AN, Dunn SM. Structural requirements for ligand interactions at the benzodiazepine recognition site of the GABA(A) receptor. J Neurochem. 1998;70:2188–2194. doi: 10.1046/j.1471-4159.1998.70052188.x. [DOI] [PubMed] [Google Scholar]
- 38.Baur R, Sigel E. Replacement of histidine in position 105 in the alpha(5) subunit by cysteine stimulates zolpidem sensitivity of alpha(5)beta(2)gamma(2) GABA(A) receptors. J Neurochem. 2007;103:2556–2564. doi: 10.1111/j.1471-4159.2007.04982.x. [DOI] [PubMed] [Google Scholar]
- 39.Ramerstorfer J, et al. The GABAA receptor alpha+beta- interface: a novel target for subtype selective drugs. J Neurosci. 2011;31:870–877. doi: 10.1523/JNEUROSCI.5012-10.2011. [DOI] [PMC free article] [PubMed] [Google Scholar]
- 40.Unwin N. Nicotinic acetylcholine receptor and the structural basis of neuromuscular transmission: insights from Torpedo postsynaptic membranes. Q Rev Biophys. 2013;46:283–322. doi: 10.1017/S0033583513000061. [DOI] [PMC free article] [PubMed] [Google Scholar]
- 41.Wongsamitkul N, et al. alpha subunits in GABAA receptors are dispensable for GABA and diazepam action. Sci Rep. 2017;7:15498. doi: 10.1038/s41598-017-15628-7. [DOI] [PMC free article] [PubMed] [Google Scholar]
- 42.Hansen SB, Wang HL, Taylor P, Sine SM. An ion selectivity filter in the extracellular domain of Cys-loop receptors reveals determinants for ion conductance. J Biol Chem. 2008;283:36066–36070. doi: 10.1074/jbc.C800194200. [DOI] [PMC free article] [PubMed] [Google Scholar]
- 43.Buller AL, Hastings GA, Kirkness EF, Fraser CM. Site-directed mutagenesis of N-linked glycosylation sites on the gamma-aminobutyric acid type A receptor alpha 1 subunit. Mol Pharmacol. 1994;46:858–865. [PubMed] [Google Scholar]
- 44.Dwyer TM, Adams DJ, Hille B. The permeability of the endplate channel to organic cations in frog muscle. J Gen Physiol. 1980;75:469–492. doi: 10.1085/jgp.75.5.469. [DOI] [PMC free article] [PubMed] [Google Scholar]
- 45.Jensen ML, Schousboe A, Ahring PK. Charge selectivity of the Cys-loop family of ligand-gated ion channels. Journal of neurochemistry. 2005;92:217–225. doi: 10.1111/j.1471-4159.2004.02883.x. [DOI] [PubMed] [Google Scholar]
- 46.Johnston GA. GABAA receptor pharmacology. Pharmacol Ther. 1996;69:173–198. doi: 10.1016/0163-7258(95)02043-8. [DOI] [PubMed] [Google Scholar]
- 47.Penmatsa A, Wang KH, Gouaux E. X-ray structure of dopamine transporter elucidates antidepressant mechanism. Nature. 2013;503:85–90. doi: 10.1038/nature12533. [DOI] [PMC free article] [PubMed] [Google Scholar]
- 48.Baur R, et al. Molecular analysis of the site for 2-arachidonylglycerol (2-AG) on the beta(2) subunit of GABA(A) receptors. J Neurochem. 2013;126:29–36. doi: 10.1111/jnc.12270. [DOI] [PubMed] [Google Scholar]
- 49.Miller PS, et al. Structural basis for GABAA receptor potentiation by neurosteroids. Nat Struct Mol Biol. 2017;24:986–992. doi: 10.1038/nsmb.3484. [DOI] [PMC free article] [PubMed] [Google Scholar]
- 50.Laverty D, et al. Crystal structures of a GABAA-receptor chimera reveal new endogenous neurosteroid-binding sites. Nat Struct Mol Biol. 2017;24:977–985. doi: 10.1038/nsmb.3477. [DOI] [PMC free article] [PubMed] [Google Scholar]
- 51.Morales-Perez CL, Noviello CM, Hibbs RE. Manipulation of Subunit Stoichiometry in Heteromeric Membrane Proteins. Structure. 2016;24:797–805. doi: 10.1016/j.str.2016.03.004. [DOI] [PMC free article] [PubMed] [Google Scholar]
- 52.Kawate T, Gouaux E. Fluorescence-detection size-exclusion chromatography for precrystallization screening of integral membrane proteins. Structure. 2006;14:673–681. doi: 10.1016/j.str.2006.01.013. [DOI] [PubMed] [Google Scholar]
- 53.Nielsen H. Predicting Secretory Proteins with SignalP. Methods Mol Biol. 2017;1611:59–73. doi: 10.1007/978-1-4939-7015-5_6. [DOI] [PubMed] [Google Scholar]
- 54.Reeves PJ, Callewaert N, Contreras R, Khorana HG. Structure and function in rhodopsin: high-level expression of rhodopsin with restricted and homogeneous N-glycosylation by a tetracycline-inducible N-acetylglucosaminyltransferase I-negative HEK293S stable mammalian cell line. Proc Natl Acad Sci U S A. 2002;99:13419–13424. doi: 10.1073/pnas.212519299. [DOI] [PMC free article] [PubMed] [Google Scholar]
- 55.Zheng SQ, et al. MotionCor2: anisotropic correction of beam-induced motion for improved cryo-electron microscopy. Nat Methods. 2017;14:331–332. doi: 10.1038/nmeth.4193. [DOI] [PMC free article] [PubMed] [Google Scholar]
- 56.Zhang K. Gctf: Real-time CTF determination and correction. J Struct Biol. 2016;193:1–12. doi: 10.1016/j.jsb.2015.11.003. [DOI] [PMC free article] [PubMed] [Google Scholar]
- 57.Scheres SH. RELION: implementation of a Bayesian approach to cryo-EM structure determination. J Struct Biol. 2012;180:519–530. doi: 10.1016/j.jsb.2012.09.006. [DOI] [PMC free article] [PubMed] [Google Scholar]
- 58.Scheres SH. Processing of Structurally Heterogeneous Cryo-EM Data in RELION. Methods Enzymol. 2016;579:125–157. doi: 10.1016/bs.mie.2016.04.012. [DOI] [PubMed] [Google Scholar]
- 59.Kucukelbir A, Sigworth FJ, Tagare HD. Quantifying the local resolution of cryo-EM density maps. Nat Methods. 2014;11:63–65. doi: 10.1038/nmeth.2727. [DOI] [PMC free article] [PubMed] [Google Scholar]
- 60.Schwede T, Kopp J, Guex N, Peitsch MC. SWISS-MODEL: An automated protein homology-modeling server. Nucleic Acids Res. 2003;31:3381–3385. doi: 10.1093/nar/gkg520. [DOI] [PMC free article] [PubMed] [Google Scholar]
- 61.Pettersen EF, et al. UCSF Chimera–a visualization system for exploratory research and analysis. J Comput Chem. 2004;25:1605–1612. doi: 10.1002/jcc.20084. [DOI] [PubMed] [Google Scholar]
- 62.Emsley P, Lohkamp B, Scott WG, Cowtan K. Features and development of Coot. Acta Crystallogr D Biol Crystallogr. 2010;66:486–501. doi: 10.1107/S0907444910007493. [DOI] [PMC free article] [PubMed] [Google Scholar]
- 63.Emsley P, Crispin M. Structural analysis of glycoproteins: building N-linked glycans with Coot. Acta Crystallogr D Struct Biol. 2018;74:256–263. doi: 10.1107/S2059798318005119. [DOI] [PMC free article] [PubMed] [Google Scholar]
- 64.Codding PW, Muir AK. Molecular structure of Ro15-1788 and a model for the binding of benzodiazepine receptor ligands. Structural identification of common features in antagonists. Mol Pharmacol. 1985;28:178–184. [PubMed] [Google Scholar]
- 65.Adams PD, et al. PHENIX: a comprehensive Python-based system for macromolecular structure solution. Acta Crystallogr D Biol Crystallogr. 2010;66:213–221. doi: 10.1107/S0907444909052925. [DOI] [PMC free article] [PubMed] [Google Scholar]
- 66.Amunts A, et al. Structure of the yeast mitochondrial large ribosomal subunit. Science. 2014;343:1485–1489. doi: 10.1126/science.1249410. [DOI] [PMC free article] [PubMed] [Google Scholar]
- 67.Winn MD, et al. Overview of the CCP4 suite and current developments. Acta Crystallogr D Biol Crystallogr. 2011;67:235–242. doi: 10.1107/S0907444910045749. [DOI] [PMC free article] [PubMed] [Google Scholar]
- 68.Wallace AC, Laskowski RA, Thornton JM. LIGPLOT: a program to generate schematic diagrams of protein-ligand interactions. Protein Eng. 1995;8:127–134. doi: 10.1093/protein/8.2.127. [DOI] [PubMed] [Google Scholar]
- 69.Krissinel E, Henrick K. Inference of macromolecular assemblies from crystalline state. J Mol Biol. 2007;372:774–797. doi: 10.1016/j.jmb.2007.05.022. [DOI] [PubMed] [Google Scholar]
- 70.Morin A, et al. Collaboration gets the most out of software. Elife. 2013;2:e01456. doi: 10.7554/eLife.01456. [DOI] [PMC free article] [PubMed] [Google Scholar]
- 71.Hadingham KL, et al. Role of the beta subunit in determining the pharmacology of human gamma-aminobutyric acid type A receptors. Mol Pharmacol. 1993;44:1211–1218. [PubMed] [Google Scholar]
- 72.Karim N, et al. Potency of GABA at human recombinant GABA(A) receptors expressed in Xenopus oocytes: a mini review. Amino Acids. 2013;44:1139–1149. doi: 10.1007/s00726-012-1456-y. [DOI] [PubMed] [Google Scholar]
- 73.Mortensen M, Patel B, Smart TG. GABA Potency at GABA(A) Receptors Found in Synaptic and Extrasynaptic Zones. Front Cell Neurosci. 2011;6:1. doi: 10.3389/fncel.2012.00001. [DOI] [PMC free article] [PubMed] [Google Scholar]
- 74.Baur R, Sigel E. On high- and low-affinity agonist sites in GABAA receptors. J Neurochem. 2003;87:325–332. doi: 10.1046/j.1471-4159.2003.01982.x. [DOI] [PubMed] [Google Scholar]
- 75.Richter L, et al. Diazepam-bound GABAA receptor models identify new benzodiazepine binding-site ligands. Nat Chem Biol. 2012;8:455–464. doi: 10.1038/nchembio.917. [DOI] [PMC free article] [PubMed] [Google Scholar]
- 76.Middendorp SJ, Puthenkalam R, Baur R, Ernst M, Sigel E. Accelerated discovery of novel benzodiazepine ligands by experiment-guided virtual screening. ACS Chem Biol. 2014;9:1854–1859. doi: 10.1021/cb5001873. [DOI] [PubMed] [Google Scholar]
- 77.Du J, Lu W, Wu S, Cheng Y, Gouaux E. Glycine receptor mechanism elucidated by electron cryo-microscopy. Nature. 2015;526:224–229. doi: 10.1038/nature14853. [DOI] [PMC free article] [PubMed] [Google Scholar]
- 78.Hibbs RE, Gouaux E. Principles of activation and permeation in an anion-selective Cys-loop receptor. Nature. 2011;474:54–60. doi: 10.1038/nature10139. [DOI] [PMC free article] [PubMed] [Google Scholar]
- 79.J Gen Physiol. 2008 Feb;131(2):137–46. doi: 10.1085/jgp.200709896. [DOI] [PMC free article] [PubMed] [Google Scholar]
Associated Data
This section collects any data citations, data availability statements, or supplementary materials included in this article.
Supplementary Materials
Data Availability Statement
Atomic coordinates of the two GABA-A receptor-GABA-flumazenil-Fab complexes have been deposited in the Protein Data Bank (PDB; Conformation A, 6D6U; Conformation B, 6D6T). The cryo-EM density maps have been deposited in the Electron Microscopy Data Bank (Conformation A, EMD-7817; Conformation B, EMD-7816).


