

Abstract
Purpose
The purpose of this study was to estimate the radiation dose to the lung and breast as well as the effective dose from tube current modulated (TCM) lung cancer screening (LCS) scans across a range of patient sizes.
Methods
Monte Carlo (MC) methods were used to calculate lung, breast, and effective doses from a low‐dose LCS protocol for a 64‐slice CT that used TCM. Scanning parameters were from the protocols published by AAPM's Alliance for Quality CT. To determine lung, breast, and effective doses from lung cancer screening, eight GSF/ICRP voxelized phantom models with all radiosensitive organs identified were used to estimate lung, breast, and effective doses. Additionally, to extend the limited size range provided by the GSF/ICRP phantom models, 30 voxelized patient models of thoracic anatomy were generated from LCS patient data. For these patient models, lung and breast were semi‐automatically segmented. TCM schemes for each of the GSF/ICRP phantom models were generated using a validated method wherein tissue attenuation and scanner limitations were used to determine the TCM output as a function of table position and source angle. TCM schemes for voxelized patient models were extracted from the raw projection data. The water equivalent diameter, Dw, was used as the patient size descriptor. Dw was estimated for the GSF/ICRP models. For the thoracic patient models, Dw was extracted from the DICOM header of the CT localizer radiograph. MC simulations were performed using the TCM scheme for each model. Absolute organ doses were tallied and effective doses were calculated using ICRP 103 tissue weighting factors for the GSF/ICRP models. Metrics of scanner radiation output were determined based on each model's TCM scheme, including CTDIvol, dose length product (DLP), and CTDIvol, Low Att, a previously described regional metric of scanner output covering most of the lungs and breast. All lung and breast doses values were normalized by scan‐specific CTDIvol and CTDIvol, Low Att. Effective doses were normalized by scan‐specific CTDIvol and DLP. Absolute and normalized doses were reported as a function of Dw.
Results
Lung doses normalized by CTDIvol, Low Att were modeled as an exponential relationship with respect to Dw with coefficients of determination (R 2 ) of 0.80. Breast dose normalized by CTDIvol, Low Att was modeled with an exponential relationship to Dw with an R 2 of 0.23. For all eight GSF/ICRP phantom models, the effective dose using TCM protocols was below 1.6 mSv. Effective doses showed some size dependence but when normalized by DLP demonstrated a constant behavior.
Conclusion
Lung, breast, and effective doses from LCS CT exams with TCM were estimated with respect to patient size. Normalized lung dose can be reasonably estimated with a measure of a patient size such as Dw and regional metric of CTDIvol covering the thorax such as CTDIvol, Low Att, while normalized breast dose can also be estimated with a regional metric of CTDIvol but with a larger degree of variability than observed for lung. Effective dose normalized by DLP can be estimated with a constant multiplier.
Keywords: breast dose, computed tomography, effective dose, lung cancer screening, lung dose, Monte Carlo simulations, tube current modulation
1. Introduction
Lung cancer is the leading cause of cancer‐related mortality among both men and women in the United States, and since 1985, has been the most common cancer both in terms of incidence and mortality worldwide.1 While the 5‐yr survival of lung cancer is only 15%, the prognosis for those with a diagnosis at early stages improves substantially. This motivated the National Cancer Institute to sponsor the National Lung Screening Trial (NLST) from 2002 to 2009. The NLST was a multicenter, randomized, controlled trial investigating the ability of early detection using low‐dose helical computed tomography (LDCT) to reduce lung cancer mortality compared to those undergoing screening chest radiography (CXR) in a large cohort of high‐risk participants.2 The study found a 20% reduction in lung cancer‐related mortality for those participants who underwent a LDCT exam compared to those who underwent CXR.3 It should be noted here that the original NLST protocol used a low‐dose lung cancer screening (LCS) exam that employed fixed tube current (FTC), as tube current modulation (TCM) was novel technology when the study began in 2002.4 CT dosimetry and subsequent estimates of patient dose indicated that the average volumetric CT Dose Index (CTDIvol) based on 32 cm phantom was approximately 3.0 mGy and the averaged estimated effective dose was 1.5 mSv.5
Based on the positive results of the NLST, several groups have recommended annual low‐dose CT for lung cancer screening (LDCT‐LCS) for high‐risk individuals, including the United States Preventive Services Task Force (USPSTF) in 2013 and subsequently the Centers for Medicare & Medicaid Services (CMS) in 2014.6, 7 In addition, the American College of Radiology (ACR) and the Society of Thoracic Radiology (STR) issued a joint practice parameter for the performance and reporting of LCS thoracic CT.8 Both the CMS and ACR‐STR LCS later described a low‐dose CT scan protocol as one that: (a) CTDIvol of less than 3.0 mGy for a standard‐sized patient (height, 170 cm [5 feet 7 inches]; weight, 70 kg [155 lbs]) and (b) adjusts the scanner output for patient size.6, 8 To provide technical assistance in the performing of LDCT scans for screening, the American Association of Physicists in Medicine (AAPM) published a set of “reasonable” imaging protocols for different scanners and manufacturers.9 Fujii et al. have reported on CTDIvol and DLP values from LCS based on the AAPM protocols for one scanner manufacturer (Siemens) and have shown these protocols to be compliant with the requirements established by CMS and ACR‐STR.10
While CTDIvol and DLP are useful indicators of CT scanner output, they are not measures of patient dose.11 For the NLST, estimates of both organ dose and effective dose were reported using tools that are based on Monte Carlo (MC) simulation results (CTExpo).5 However, those tools utilize a stylized, mathematical, anthropomorphic patient model of a single size (standard‐sized patient for male and for female). In addition, the estimates were based on the NLST protocol that only used FTC scans. While these approaches produced reasonable estimates of organ and effective dose for the NLST, they nevertheless have several important limitations in the current context of clinical implementation of LCS.
In current clinical practice, the vast majority of clinical exams, including LDCT‐LCS use one or more forms of automatic exposure control (AEC), such as TCM,12, 13, 14, 15 which was not available during the NLST.4 Another limitation for prior dose estimates is the use of single‐sized stylized, anthropomorphic mathematical phantoms, which do not represent the anatomic and size variations that are seen in clinical practice. TCM has been shown to have an effect on the absorbed organ dose as a function of patient size, particularly for radiosensitive organs in the chest region such as the breast and lung.16, 17, 18, 19, 20, 21, 22 Methods of estimating either organ or effective dose that account for the effects of patient size and the widespread usage of TCM are needed to provide accurate patient dose estimates.
In order to estimate patient dose from body CT exams, AAPM Reports 204 and 220 developed the size‐specific dose estimate (SSDE) to account for patient size.23, 24 However, the estimates from SSDE are based on FTC scan, whereas, as mentioned above, the vast majority of routine clinical CT procedures, including LCS, are done with some form of TCM.12, 13, 14, 15 SSDE was originally developed to estimate dose to the center of the scan volume.23 Recently, using a regional definition of CTDIvol as a normalization metric,25 Bostani et al. developed a generalizable linear model (GLM) to estimate normalized organ dose from routine body CT exams with TCM that resulted in estimates significantly closer to MC reference dose calculations than those provided by both SSDE or the MC‐based software package ImPACT, across a variety of scanner manufacturers.26 However, that model only considered routine chest and longitudinal modulation26 and may face limitations when estimating organ dose in LDCT‐LCS where low tube current values are used and machine limits (minimums) may be encountered. Additionally, previous estimates of effective dose from LCS from Larke et al. utilized k‐factors derived from FTC chest scans which may not be applicable in the current context of LCS scans performed with TCM. Therefore, the purpose of this study was to estimate lung, breast, and effective dose from TCM LCS scans across a variety of patient sizes.
2. Materials and methods
2.A. Overview
This study employed MC methods for CT radiation transport and dosimetry to determine organ doses, including lung and breast, from LCS. Effective dose can then be calculated using the determined organ doses. MC simulations of LCS CT protocols with TCM were conducted on a total of 38 voxelized models containing detailed thoracic anatomy. The scanning protocol for LCS with TCM comes from AAPM protocols.9 Thirty of the voxelized models were created from CT image data of patients who underwent LCS CT exams. The remaining eight models are from GSF/ICRP voxelized phantom models. For patient models, TCM schemes were extracted from raw projection data. For phantom models, TCM schemes were estimated using a validated method of estimating TCM from the AEC from one manufacturer.27 Extracted TCM schemes for patient models and estimated TCM functions for GSF/ICRP phantom models were both incorporated into MC simulations of LCS chest protocol from a Definition AS64 MDCT (Siemens Healthineers, Forchheim, Germany) scanner to obtain organ doses. Effective doses were computed with respect to ICRP 103 tissue weighting factor recommendations.28 While this quantity has been introduced for prospective radiation protection as a measure to limit radiation risk for the worker and the general public, it is nevertheless generally found to be a practical quantity, and hence is often used also for studies as the present one aimed toward personalized dose assessment. Effective dose has been introduced in this study from a general radiation protection perspective, not for individual dose assessment.28 The size of each patient model is described using a standard attenuation‐based metric, water equivalent diameter (Dw).24 Lung and breast doses were normalized by the scanner radiation output value, CTDIvol.23, 29 Additionally, Khatonabadi et al. showed that a regional descriptor of CTDIvol capturing the local variations of radiation incident upon the organs of interest in the chest (i.e., area of low attenuation), defined as CTDIvol, Low Att, served as a better normalization metric for predicting lung and breast dose in comparison with CTDIvol.25 For this reason, this study also employed CTDIvol, Low Att as a normalization metric for lung and breast dose. Figure 1 contains flowcharts summarizing the methods used in this investigation for generating the lung and breast dose predictive models for both the phantom and patient models. Effective doses normalized by CTDIvol and DLP were also parameterized as a function of Dw. Regression equations were calculated and their predictive capability were assessed using the coefficient of determination (R 2 ).
Figure 1.

Flowcharts depicting the methods for generating the lung and breast dose predictive models for (a) voxelized phantoms models and (b) voxelized patient models. [Color figure can be viewed at wileyonlinelibrary.com]
2.B. Patient models
2.B.1. Voxelized phantom models (whole body models)
Eight voxelized whole body phantom models (referred to in this manuscript as “phantom models”), six from the GSF family30 and the ICRP voxelized reference male and female models,31, 32 were used in this study. These phantom models have all of the radiosensitive organs identified and therefore can be used to estimate lung, breast, and effective doses. The six GSF voxel‐based models were created from CT images with up to 131 organs and anatomic structures segmented, and the two ICRP reference male and female voxelized models were each based off modifications of two corresponding male and female GSF models of similar external dimensions.31, 32 Incorporation into MC simulations necessitated that each model be represented as a three‐dimensional matrix of integer identification numbers wherein each identification number was allocated a material description based on elemental compositions of tissue substitutes and their densities as defined in ICRU Report 44.33
This study included four adult male models (Golem, Frank, ICRP Reference Male “Rex”, and Visible Human), and four adult female models (Irene, Donna, ICRP Reference Female “Regina”, and Helga). Some GSF models are not whole body models; however, all of the models included full head, thorax, and abdominal regions with all the necessary radiosensitive organs or adequate substitute organs segmented and thus are appropriate for CT exam simulation and subsequent effective dose calculations. Two of the models — Golem and Visible Human — do not have glandular breast tissue.30 Given that in the same anatomic region there is no substitute for glandular breast tissue, for these models there is no dose contribution from this organ. Detailed physical characteristics of each of these models are provided in Table 1 and image data characteristics are provided in Table 2. The table material was assumed to be pure graphite. All patients were simulated in the head‐first supine position.
Table 1.
Physical characteristics of GSF and ICRP voxelized patient models. Numbers in parentheses refer to the height and/or weight of the voxelized phantom models, while numbers not in parentheses refer to the height and/or weight of the actual individual whose images were used to create the phantom
| Names | Gender | Age | Type | Weight (kg) | Height (cm) |
|---|---|---|---|---|---|
| GSF | |||||
| Donna | Female | 40 yr | Whole body | 79 | 170 |
| Frank | Male | 48 yr | Head/torso | (65.4) | (96.5) |
| Golem | Male | 38 yr | Whole body | 68.9 | 176 |
| Helga | Female | 28 yr | Head/torso | 81 (76.8) | 170 (114) |
| Irene | Female | 32 yr | Whole body | 51 | 163 |
| Visible Human | Male | 38 yr | Head/torso | 103.2 (87.8) | 180 (125) |
| ICRP | |||||
| ICRP female (Regina) | Female | 38 | Whole body | 60 | 167 |
| ICRP male (Rex) | Male | 43 | Whole body | 73 | 176 |
Table 2.
Image characteristics of GSF and ICRP voxelized models used in this investigation
| Names | Number of images | Image resolution | Slice thickness (mm) | Voxel size (mm3) |
|---|---|---|---|---|
| Donna | 179 | 256 × 256 | 10 | 35.15 |
| Frank | 193 | 512 × 512 | 5 | 2.75 |
| Golem | 220 | 256 × 256 | 8 | 34.61 |
| Helga | 114 | 512 × 512 | 10 | 9.60 |
| Irene | 348 | 262 × 132 | 5 | 17.57 |
| Visible Human | 250 | 512 × 512 | 5 | 4.27 |
| ICRP | ||||
| ICRP female (Regina) | 222a | 299 × 137 | 4.8 | 15.24 |
| ICRP male (Rex) | 348a | 254 × 127 | 8 | 36.53 |
For Regina and Rex, actual patient anatomy is 220 and 346, respectively, with a recommend extra slice of air at the cranial and caudal ends of the phantoms.
Since, for LCS scanning, the arms are typically raised above the head and are out of the scan region, the arms for all voxelized phantoms were identified and removed below the shoulders. Raising the arms above the head does elevate the shoulders; thus, to recreate this posture, the shoulders for each phantom model were edited to resemble this posture. These modified versions of voxelized phantom models were used in all MC simulations described in this study.
2.B.2. Voxelized patient models (thorax only)
To extend the limited size range provided by the GSF/ICRP voxelized models, under IRB approval, 30 additional voxelized patient models (referred to as “patient models”) of detailed thoracic anatomy were created based on image data from 17 female (age range: 43–75 yr) and 13 male (age range: 63–81 yr) patients who underwent clinical LCS CT exams. These 30 patients were specifically selected to represent a range of sizes in terms of Dw (see Section 2.D below). All scans were acquired on a Siemens Definition AS64 and were performed in accordance with the AAPM's Alliance for Quality CT imaging protocol (see Section 2.C below)9 in the supine position. Image data were reconstructed from raw projection data at 500 mm field of view to ensure inclusion of the entire thorax. The reconstructed in‐plane image resolution was 0.98 mm2 with 3 mm image thickness. To create voxelized models of each patient's anatomy from the image data, voxels within each image series were modeled as either lung, fat, water, muscle, bone, or air and were subdivided into one of 17 density levels depending on their CT number.34 The lung and breast tissues were semi‐automatically contoured and explicitly identified in the patient models. Breast tissue was segmented only for the female patients.18 Given that these patient models did not have all the radiosensitive organs needed to calculate effective dose, their inclusion in this study served only to estimate lung and breast dose from LCS.
2.C. CT scanning protocol
The scanning parameters were taken from AAPM's Alliance for Quality CT protocol recommendations for the Siemens SOMATOM Definition AS scanner.9 The superior and inferior aspects of the scan volume were the top and bottom of the lungs, respectively, with 20 mm of over‐scanning both superiorly and inferiorly. MC simulations of chest protocols for each phantom were performed using the following scanning parameters: a tube voltage of 120 kV, a nominal collimation of 19.2 mm (32 × 0.6 mm collimation using the z flying focal spot; the measured beam FWHM is 23.8 mm), body bowtie filter, CAREDose4D AEC scheme with “Average” setting, quality reference mAs (QRM) of 25, a tube rotation time of 0.5 s, and a pitch of 1. All MCNPX simulations were also performed in accordance with this protocol.
2.D. Size metrics
For each patient model, Dw was assessed at the center (longitudinally) of the image series; estimates of Dw were obtained from the CT localizer radiograph (which Siemens refers to as the “topogram”) at that center location. The Dw for each GSF/ICRP phantom model was estimated at the center of chest region from the attenuation information following a simulated topogram as described by McMillan et al.27 Briefly, the attenuation characteristics of each phantom model were obtained using MC simulations to emulate the anterior–posterior (AP) projection geometry of the CT localizer radiograph. The resulting attenuation profiles were then used to estimate the AP dimension at each table position. Thereafter, the lateral (LAT) dimension was estimated from the AP dimension using a mathematical model that removes air and table attenuation and accounts for patient offset from isocenter. Since each dimension is in terms of water equivalent attenuation, the Dw was calculated as Eq. (1)
| (1) |
2.E. Tube current modulation schemes
For each patient model, TCM data were extracted from the raw projection data as described in Angel et al.18 In the case of the phantom models, estimates of TCM data were obtained using the method described by McMillan et al.27 This method emulates the generation of TCM data based on CAREDose4D (Siemens Healthineers, Forchheim, Germany), which uses patient size information from the CT localizer radiograph to predict the longitudinal and angular TCM functions. The longitudinal modulation was based on the maximum tube current at each table position. The tube current at each table position was then determined with respect to the protocol‐specific reference attenuation that considers the QRM specified, the gantry rotation time, the maximum patient attenuation at each table position, the protocol‐specific reference attenuation for a standard‐sized patient coded into the CAREDose4D algorithm, and the modulation strength parameter which can also be specified at the user interface. The modulation strength was set to “Average,” which is the default for all Siemens CT scanners. Angular modulation was achieved from estimating the angular attenuation through a piecewise interpolation of the AP and LAT attenuation profiles at tube angles corresponding in AP (0° and 180°) and LAT (90° and 270°) locations.
2.F. Monte Carlo simulations and dose calculations
A previously described, modified version of the radiation transport software package MCNPX (Monte Carlo N‐Particle eXtended version 2.7.a) was used for this investigation.35, 36, 37 All simulations were conducted in photon transport mode with a 1 keV low‐energy cutoff. Also, an equivalent source model of a 64 slice multidetector row CT (MDCT) scanner (Definition AS64, Siemens Healthineers, Forchheim, Germany) was utilized for all MC simulations.38 The initial position vector, energy, and trajectory vector of each simulated photon must be specified within MCNPX. The default MCNPX source code was therefore modified to randomly sample from all possible positions along a helical path of the CT x‐ray source movement for a specified nominal beam collimation, scan length, and pitch for helical scans. Additional modifications were incorporated to account for scanner‐specific fan angles and measured beam widths when sampling photon trajectories.39 It should be noted that all simulated scans used the same tube potential (120 kV) and the same bowtie filter (body). For each patient and phantom model, TCM data were incorporated into MC simulations using a method described by Angel et al.18, 39 Absolute doses for TCM simulations were computed by multiplying the dose per tube current time product by the maximum tube current value obtained from the TCM function across the entire simulated scan volume and by the tube rotation time of the scan. Red bone marrow (RBM) and bone surface were not explicitly modeled and as such, dose to RBM and to the skeletal tissue were determined indirectly. Homogenous bone (HB) voxels were used to determine dose to the bone surface.32 Dose to RBM was then approximated as the ratio of mass energy‐absorption coefficients of RBM and HB multiplied by the dose to the HB.32 Each simulation was performed with 108 photons to ensure a relative error of less than 1%.
2.G. Scanner radiation output metrics
Three radiation outputs were used as normalization metrics in this study: CTDIvol, CTDIvol, Low Att, and dose length product (DLP). For patient models, CTDIvol and DLP were taken from the patient protocol pages. CTDIvol, Low Att was calculated using a MATLAB script wherein CTDIvol values were averaged from approximately the inferior edge of the scapula to the superior boundary of the liver.25 For LCS exams, this regional descriptor of CTDIvol excludes the shoulder and any abdominal organs and includes most of the lungs and the glandular breast tissue.
To estimate the radiation output for phantom models, CTDIvol/mAs was obtained from measurements performed on a 32 cm CTDI phantom at 120 kV for the Siemens Definition AS64. The CTDIvol values for each simulated scan were then calculated through multiplying by the average tube current time product across the entire simulated scan length to produce CTDIvol. To obtain CTDIvol, Low Att for the phantom models, tube current values in the LCS region of the chest, as described above, were averaged and multiplied by the CTDIvol/mAs value described above. DLP values were obtained by multiplying scan‐specific CTDIvol values by the respective scan lengths of each phantom model.
2.H. Dose analysis
To confirm expected relationships between scanner output metrics and patient size, CTDIvol, CTDIvol, Low Att, and DLP were plotted as functions of Dw to assess the exponential relationship between these parameters. Absolute lung and breast doses were likewise plotted as functions of Dw. CTDIvol and CTDIvol, Low Att values were then used as normalization factors for lung and breast doses. Similar to the analysis performed in AAPM Report 204, an exponential relationship between lung and breast dose normalized by each CTDIvol metric and Dw was determined, as shown in Eq. (2)
| (2) |
where A and B are organ‐specific coefficients. Because organ doses and CTDIvol metrics were in units of mGy, normalized organ doses are unitless quantities.23 The coefficient of determination (R 2 ) was used to assess the predictive capability of the calculated coefficients and to quantify the proportion of variation explained by Dw. Individual absolute organ doses for all segmented radiosensitive organs from LCS chest MC simulations for ICRP female and male models Regina and Rex were also shown for the standard woman and man.
Effective doses (E) for the eight GSF/ICRP phantom models were calculated from simulated organ doses based upon ICRP 103 tissue weighting factors. As with absolute lung and breast dose, effective dose was parameterized as a function of Dw. Effective doses were then normalized both by the scanner‐reported CTDIvol and DLP and were parameterized as a function of Dw as seen in Eq. (3)
| (3) |
where A and B are regression coefficients for each normalization metric. CTDIvol‐normalized effective doses were in units of mSv • mGy−1 and effective doses normalized by DLP were in units of mSv ⦁ (mGy‐cm)−1. The resulting regression coefficients provided a means to estimate scanner‐independent lung, breast, and effective dose estimates for a given patient size. The predictive strength of each correlation was ascertained using the coefficient of determination.
3. Results
3.A. Patient and phantom characteristics
Table 3 contains the gender, scan length, and chest Dw estimates for the eight GSF/ICRP phantoms models and for all 30 patient models. For the GSF/ICRP phantom models, the scan lengths ranged from 22.0 to 31.0 cm, while Dw ranged from 19.5 to 26.1 cm. For the patient models, the scan lengths ranged from 27.3 to 36.3 cm and Dw ranged from 20.7 to 40.7 cm. The age range of the patient models was 43 to 81 yr.
Table 3.
Gender, scan length, and Dw estimates for all patient and phantom models used in this investigation listed in order of increasing size
| Patient ID | Gender (M/F) | Scan length (cm) | Dw (cm) |
|---|---|---|---|
| LCS1 | M | 36.0 | 20.0 |
| LCS2 | M | 36.0 | 20.3 |
| LCS3 | F | 33.8 | 21.2 |
| LCS4 | M | 32.5 | 21.7 |
| LCS5 | F | 34.6 | 22.2 |
| LCS6 | M | 35.1 | 22.7 |
| LCS7 | M | 36.3 | 22.8 |
| LCS8 | M | 28.6 | 23.1 |
| LCS9 | F | 32.4 | 23.3 |
| LCS10 | F | 33.7 | 23.4 |
| LCS11 | M | 33.7 | 24.1 |
| LCS12 | M | 32.8 | 24.4 |
| LCS13 | F | 32.3 | 24.5 |
| LCS14 | M | 33.9 | 24.6 |
| LCS15 | F | 27.3 | 24.7 |
| LCS16 | M | 31.4 | 26.8 |
| LCS17 | F | 34.1 | 27.2 |
| LCS18 | M | 33.7 | 28.2 |
| LCS19 | M | 32.0 | 28.9 |
| LCS20 | F | 31.8 | 29.1 |
| LCS21 | M | 32.2 | 29.2 |
| LCS22 | M | 33.7 | 30.8 |
| LCS23 | M | 34.8 | 31.7 |
| LCS24 | F | 30.9 | 32.7 |
| LCS25 | M | 36.3 | 32.8 |
| LCS26 | M | 35.2 | 33.4 |
| LCS27 | F | 28.9 | 33.5 |
| LCS28 | F | 31.7 | 34.0 |
| LCS29 | M | 35.0 | 36.1 |
| LCS30 | F | 30.8 | 40.7 |
| Irene | F | 27.0 | 19.5 |
| Frank | M | 28.0 | 21.3 |
| Visible human | M | 30.0 | 22.7 |
| Golem | M | 31.0 | 22.8 |
| Regina | F | 27.1 | 23.4 |
| Donna | F | 25.0 | 24.1 |
| Rex | M | 28.0 | 24.4 |
| Helga | F | 22.0 | 26.1 |
3.B. TCM schemes, CTDIvol, CTDIvol, Low Att, and DLP measurements
Figures 2 and 3 show examples of the TCM schemes for two patient models (one female and one male), and two GSF phantom models “Frank” and “Donna” overlaid atop patient anatomy, respectively. Predicted TCM schemes for the remaining GSF and ICRP phantom models are shown in Appendix A. Table 4 contains the CTDIvol, CTDIvol, Low Att, and DLP for the simulated chest scan of each patient and phantom model.
Figure 2.

Extracted TCM schemes for (a) female (LCS13) and (b) male (LCS14) overlaid on patient anatomy. The solid blue line represents the tube current profile extracted from the raw projection data. The tube current is elevated in the shoulder regions and subsequently decreases as the x‐ray source traverses over the low attenuating region of the lungs. The solid red line represents the average tube current across the entire scan. The dashed cyan lines represent the extent of the low attenuation region over which CTDIvol, Low Att is calculated. The dashed yellow line represents the lower machine limit of 20 mA. [Color figure can be viewed at wileyonlinelibrary.com]
Figure 3.

Predicted TCM scheme for GSF (a) Donna and (b) Frank overlaid with a representation of phantom anatomy. As in Fig. 1, the solid blue line represents the estimated tube current modulation data. Likewise, the solid red line is the average tube current throughout the entire scan length and was used to calculate CTDIvol for each phantom model. DLP values for phantom models were derived by multiplying CTDIvol with the scan lengths listed in Table 3. The dashed cyan lines represent the extent of the low attenuation region over which CTDIvol, Low Att is calculated. The dashed yellow line represents the lower machine limit of 20 mA of the system. [Color figure can be viewed at wileyonlinelibrary.com]
Table 4.
CTDIvol, CTDIvol, Low Att, and DLP for LCS‐simulated chest scans for Siemens Definition AS64 for patient and phantom models
| Patient | CTDIvol (mGy) | CTDIvol, Low Att (mGy) | DLP (mGy‐cm) |
|---|---|---|---|
| LCS1 | 1.25 | 0.65 | 45.0 |
| LCS2 | 1.25 | 0.71 | 45.0 |
| LCS3 | 1.33 | 0.68 | 45.0 |
| LCS4 | 1.60 | 0.98 | 52.0 |
| LCS5 | 1.56 | 0.79 | 54.0 |
| LCS6 | 1.71 | 0.84 | 60.0 |
| LCS7 | 1.71 | 0.85 | 62.0 |
| LCS8 | 1.75 | 1.14 | 50.0 |
| LCS9 | 1.48 | 0.94 | 48.0 |
| LCS10 | 1.75 | 1.05 | 59.0 |
| LCS11 | 1.75 | 0.96 | 59.0 |
| LCS12 | 1.86 | 1.00 | 61.0 |
| LCS13 | 2.17 | 1.12 | 70.0 |
| LCS14 | 2.24 | 1.29 | 76.0 |
| LCS15 | 2.05 | 1.50 | 56.0 |
| LCS16 | 2.36 | 1.51 | 74.0 |
| LCS17 | 2.55 | 1.52 | 87.0 |
| LCS18 | 2.85 | 1.49 | 96.0 |
| LCS19 | 2.66 | 2.05 | 85.0 |
| LCS20 | 2.55 | 2.19 | 81.0 |
| LCS21 | 2.70 | 1.67 | 87.0 |
| LCS22 | 4.18 | 2.04 | 141.0 |
| LCS23 | 3.42 | 2.71 | 119.0 |
| LCS24 | 3.46 | 2.30 | 107.0 |
| LCS25 | 4.22 | 2.38 | 153.0 |
| LCS26 | 4.03 | 2.69 | 142.0 |
| LCS27 | 3.53 | 3.22 | 102.0 |
| LCS28 | 3.50 | 3.18 | 111.0 |
| LCS29 | 5.28 | 3.85 | 185.0 |
| LCS30 | 6.00 | 6.35 | 185.0 |
| Irene | 1.20 | 0.81 | 32.0 |
| Frank | 2.60 | 1.62 | 73.0 |
| Visible human | 1.95 | 0.89 | 59.0 |
| Golem | 1.81 | 1.01 | 56.0 |
| Regina | 1.33 | 0.85 | 36.0 |
| Donna | 2.13 | 0.83 | 53.0 |
| Rex | 1.61 | 1.04 | 45.0 |
| Helga | 2.86 | 1.27 | 63.0 |
Figure 4 shows plots of CTDIvol, CTDIvol, Low Att, and DLP as functions of Dw for all 38 voxelized models used in this study. CTDIvol, CTDIvol, Low Att, and DLP had coefficients of determination of 0.87, 0.91, and 0.84, respectively. Results of the regression analysis for radiation metrics are summarized in Table 5.
Figure 4.

(a) CTDIvol, (b) CTDIvol, Low Att, and (c) DLP scanner radiation metrics as functions of Dw for all thirty‐eight models used in this study. [Color figure can be viewed at wileyonlinelibrary.com]
Table 5.
Regression analysis results for all radiation output metrics
| CTDIvol (mGy) | CTDIvol, Low Att (mGy) | DLP (mGy‐cm) | ||||||
|---|---|---|---|---|---|---|---|---|
| A | B | R 2 | A | B | R 2 | A | B | R 2 |
| 0.30 | 0.077 | 0.87 | 0.095 | 0.11 | 0.91 | 8.79 | 0.080 | 0.84 |
3.C. Absolute and size‐specific, scanner‐independent lung and breast doses estimates
3.C.1. Absolute organ doses for “standard female and male”
For standard female and male models Regina and Rex, all 27 radiosensitive organs, including lung and breast, identified in ICRP 103 had absolute individual organ doses below 4.0 mGy. Figure 5 displays the estimated organ doses from simulations for Regina and Rex. For both Regina and Rex, thyroid, thymus, and extrathoracic region doses for LCS with TCM were elevated due to the increased tube current because of the high attenuation from the shoulders. Thyroid doses for Regina were 3.03 and 3.14 mGy for Rex. Breast dose for Regina was 1.25 mGy. Lung doses were slightly higher for Rex at 1.89 mGy compared with Regina at 1.85 mGy.
Figure 5.

Bar graph showing estimated organ doses to voxelized models representing the standard female and male Regina and Rex.
3.C.2. Absolute and normalized lung and breast dose estimates as functions of Dw for all models
Figure 6 contains absolute and normalized lung and breast doses. Absolute lung and breast dose had coefficients of determination of 0.76 and 0.85, respectively. When normalized by CTDIvol, R 2 values for normalized lung and breast dose as functions of Dw were 0.42 and 0.14, respectively. When normalized by CTDIvol, Low Att, R 2 values for normalized lung and breast dose as functions of Dw were 0.80 and 0.23, respectively. Regression analysis results are summarized in Table 6.
Figure 6.
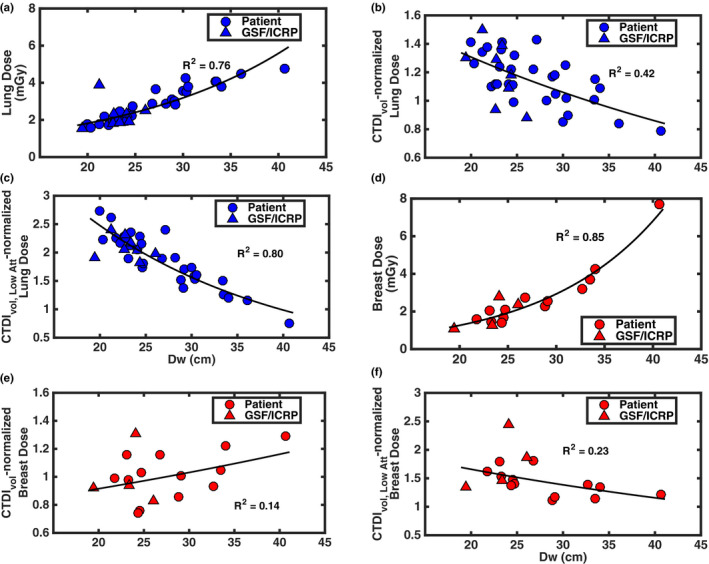
Absolute and normalized lung and breast doses for LCS with TCM as a function of Dw. (a–c) Absolute, CTDIvol‐normalized, and CTDIvol, Low Att‐normalized lung doses, respectively. (d–f) Absolute, CTDIvol‐normalized, and CTDIvol, Low Att‐normalized breast doses, respectively. [Color figure can be viewed at wileyonlinelibrary.com]
Table 6.
Exponential regression coefficients and R 2 values for absolute and normalized lung and breast dose
| Organ | Absolute Dose (mGy) | CTDIvol normalized | CTDIvol, Low Att normalized | ||||||
|---|---|---|---|---|---|---|---|---|---|
| A | B | R 2 | A | B | R 2 | A | B | R 2 | |
| Lung | 0.59 | 0.056 | 0.76 | 1.99 | −0.021 | 0.42 | 6.21 | −0.046 | 0.80 |
| Breast | 0.23 | 0.084 | 0.85 | 0.72 | 0.012 | 0.14 | 2.38 | −0.018 | 0.23 |
3.D. Absolute effective dose and size‐specific, scanner‐independent effective dose estimates from phantom models
Figure 7 shows absolute, CTDIvol‐normalized, and DLP‐normalized effective doses as functions of Dw for the eight GSF/ICRP phantom models. Table 7 contains the effective doses for all eight phantom models. All effective doses for LCS chest CT simulations using TCM were below 1.6 mSv. The models representing the standard female and male had effective doses of 0.87 and 0.99 mSv, respectively. The average DLP‐normalized effective dose across all phantom models was 0.023. Frank had a lower normalized DLP‐normalized effective dose due to Frank having a high CTDIvol and a long scan volume, meaning a high DLP. A moderate exponential relationship was observed between absolute effective dose and Dw with an R 2 of 0.36. Exponential relationships were not observed with CTDIvol‐normalized and DLP‐normalized effective doses with respect to Dw, with R 2 values of 0.02 and 0.04, respectively. These exponential relationships are described in a similar manner as with lung and breast doses in Section 3.C. Again, this lack of an exponential relationship is due in part to the fact that the normalizing quantity (e.g., CTDIvol, DLP) is not a constant when TCM is used and in fact has its own exponential relationship with Dw, as demonstrated in Figs. 4(a) and 4(c).
Figure 7.

Absolute and normalized effective doses for LCS with TCM as a function of Dw. (a) Absolute effective doses, (b) CTDIvol‐normalized effective doses and (c) DLP‐normalized effective dose as a function of Dw. All effective dose estimates for LCS, which were based on ICRP 103 tissue weighting recommendations, were below 1.6 mSv. [Color figure can be viewed at wileyonlinelibrary.com]
Table 7.
Effective dose estimates for LCS with TCM
| Phantom | E (mSv) | CTDIvol‐norm E (mSv mGy‐1) | DLP‐norm E (mSv⦁[mGy‐cm]‐1) |
|---|---|---|---|
| Irene | 0.84 | 0.71 | 0.026 |
| Frank | 1.12 | 0.43 | 0.015 |
| Visible human | 1.37 | 0.70 | 0.023 |
| Golem | 1.16 | 0.64 | 0.021 |
| Regina | 0.87 | 0.65 | 0.024 |
| Donna | 1.34 | 0.63 | 0.025 |
| Rex | 0.99 | 0.62 | 0.022 |
| Helga | 1.53 | 0.53 | 0.024 |
4. Discussion and conclusions
A combination of fully segmented voxelized phantom models and thoracic patient models created from LCS scans were employed in this study to estimate lung, breast, and effective doses in LDCT‐LCS using previously validated MC simulation techniques. In the case of patient models, TCM for LCS schemes were extracted directly from raw projection data. In the case of phantom models, TCM schemes were estimated using a recently validated prediction method. TCM schemes were incorporated in MC simulations. Lung and breast doses were normalized by two different metrics of CTDIvol, and effective doses were normalized by two global metrics of radiation output available on current clinical scanners (CTDIvol and DLP). Lastly, all dose estimates in this study were reported with respect to the current methods outlined both in AAPM Reports 204 and 220.23, 24
This study revealed that, for estimating lung dose, using CTDIvol, Low Att as a normalization metric yielded the best results with a coefficient of determination of 0.80 for an exponential model with respect to patient size. This correlation suggests that a reasonable estimate for lung dose from LCS with TCM can be achieved with some knowledge of patient size and with a regional descriptor CTDIvol such as CTDIvol, Low Att. For estimating breast dose, the best result used CTDIvol, Low Att as a normalization metric and yielded an exponential model with a coefficient of determination of 0.23. The strength of the correlation for normalized lung dose most likely is related to the fact the lung is large, centrally located organ with the chest. Given that the approach employed in AAPM report 204 was used to estimate dose to the center of scan volume for the large, centrally organs within abdomen, it stands to reason the approach should produce good results for an organ like the lung within the chest. The glandular breast tissue, on the other hand, is a peripheral organ dispersed within local adipose, so the approach employed in AAPM report 204 may not yield the strong predictive correlations, as this study has shown. Currently, scanners only report the global metrics of CTDIvol and DLP. This study indicates that reporting a regional metric such as CTDIvol, Low Att may be valuable addition to the radiation metrics reported by most scanners.
Effective doses were estimated to be below 1.6 mSv, even for the largest phantom model (Helga). Absolute effective doses showed size some size dependence as seen in Fig. 7(a). However, as shown in the results of Table 7 and illustrated in Fig. 7(c), normalizing the effective dose by DLP resulted in a nearly constant multiplier of 0.023 on average for the adult GSF/ICRP models, with Frank being the notable exception. What these results suggest is that for adult patients undergoing LDCT‐LCS within the size range provided by the GSF/ICRP models, effective dose can be estimated by multiplying a scan‐specific DLP by a constant multiple, similar to the existing DLP × k‐factor approach to estimating effective dose for a standard‐sized patient.40 Thus, while the raw effective dose values demonstrated some size dependence, when effective dose is normalized by DLP [which itself has an exponential relationship with patient size in when TCM is being used as shown in Fig. 4(c)], this removes the size dependence relationship but preserves the ability to estimate effective dose from LDCT‐LCS using a constant multiple of DLP.
The current k‐factor for adult chest scans is 0.014, which is 39% different from what was found in this study.40 It should be noted that the current set of k‐factors were devised with FTC.40 As such, these results might encourage the formulation of a new set of k‐factors based both on the ICRP 103 tissue recommendations and specific implementations of TCM. Previous effective dose estimates for LCS from Larke et al. under the FTC imaging constraints of the NLST found the effective dose of 2.4 mSv for “standard” females and under 1.6 mSv for standard males based on ICRP 103 and a mean effective dose of 1.4 mSv (±0.5 mSv SD) from k‐factor calculations.5 Effective doses for the standard female and male were calculated to be 0.87 and 0.99 mSv in this study. This reduction of effective dose is likely due to the reduction of incident radiation on the radiosensitive organs in the chest region, namely the lungs and breast, from the modeled CAREDose4D tube current modulation scheme.28 This reduction may be different for different implementations of AEC from different manufacturers (or even different settings used for CAREDose4D). TCM has been shown to reduce dose to the breast by as much as 64% for smaller patients and to the lung by as much as 56% for smaller patients with an average reduction for both organs being 16%.16, 18 However, individual organs in the proximity of higher attenuating anatomic regions such as the shoulders, including the thyroid for example, may experience higher doses when compared to FTC due simply to the increase photon fluence necessary to maintain sufficient image quality in those regions. Thyroid doses increased for standard females and males from approximately 1.0 mGy with FTC simulations to 3.0 mGy for females and 3.1 mGy for males with TCM simulations.5 In some cases, though, the thyroid dose can decrease depending on its position in the body. Frank's thyroid, for example, is only partially irradiated due it being positioned higher in the throat. Though the thyroid has a lower tissue weighting factor per ICRP 103 (w T = 0.04),28 elevated thyroid doses could occur as a consequence of TCM utilization in LCS.
The models developed in this work yield lung and breast dose estimates that are different from previously developed methods such as the previously described SSDE method23 (which is technically not a method for estimating organ dose but rather is intended for estimating dose to the center of the scan volume) and GLM method.26 To illustrate these differences, Fig. 8 was created to show absolute (not normalized) lung and breast dose estimates from LCS using the MC simulation of this study and to compare them to the results of absolute lung and breast dose obtained using the SSDE and GLM methods for each patient model. SSDE and GLM lung and breast dose estimates here are based on the LCS protocol imaging parameters, i.e., 120 kV and 25 QRM. Figure 8(a) demonstrates the estimated lung dose for each method where mean differences of 27% between SSDE and MC results and −24% between GLM and MC results, respectively, were observed. Similarly, Fig. 8(b) shows the estimated breast dose where mean differences of 43% were between SSDE and MC results and −23% between GLM and MC results, respectively, were observed. Thus, results from this study suggest that using the SSDE model could lead to over estimating lung and breast dose from LCS with TCM and that using the GLM model could under estimate lung and breast dose. The differences between the current results and SSDE can be attributed to the fact that SSDE was originally devised for FTC scans of a homogenous region like the abdomen23, 24 and moreover requires the normalization by CTDIvol which represents an average across the entirety of the scan volume.25, 26 For smaller to average‐sized patients, the fluence that the lung and breast experience due to FTC would be higher than in a TCM scenario, where tube current adapts to the lower attenuating region of the lungs. Larger patients, on the other hand, in a TCM scenario, would likely experience the same fluence as a FTC as the tube current adapts toward its allowed maximum. This phenomenon can be seen in Fig. 8(a), whereby the lung dose estimates for all three methods for the largest patient in this study, LCS30 (Dw = 40.7), effectively converge. The GLM model was developed from routine clinical protocols (e.g. routine chest) that used TCM.26 However, as can be seen in Fig. 3 (and further discussed below and in the Appendix A), LCS exams are performed with low mAs values that may result in the mA values reaching the scanner minimum, for which the GLM method neither encountered nor considered.
Figure 8.

Absolute (a) lung and (b) breast dose estimates from LCS MCNPX simulations, GLM model, and SSDE model. [Color figure can be viewed at wileyonlinelibrary.com]
To further illustrate this point, the TCM functions estimated using the approach described by McMillan et al. using CAREDose4D for all of the GSF models are included in Appendix A.27 For illustrative purposes only, the TCM functions for the GSF models Baby and Child are included there. Even though there is no expectation of performing LCS on pediatric‐sized patients, these TCM functions were predicted and shown to demonstrate that very small patients being scanned with LCS protocols may experience virtually no modulation of the tube current. This is due to both the low QRM setting, as well as the attenuation characteristics of Baby and Child relative to the protocol‐specific reference attenuation within the CAREDose4D AEC algorithm.27 It should be noted that, given that the scope of this study was lung, breast, and effective doses for LCS using TCM, the aforementioned dose estimates for these two pediatric patients were not included because the tube current profiles effectively resemble a FTC scenario. In the case of very small patients whose attenuation characteristics are well below those of the reference‐protocol, the low QRM used in LCS may bring the tube current values down to the machine minimum throughout a substantial portion of the scan volume, which would more closely resemble a FTC scenario. Similarly, very large patients whose attenuation characteristics are well above those of the reference‐protocol could potentially see tube current values peak for the duration of the scan. In clinical practice, the issue of the tube current essentially being a constant value — at the minimum tube current — for smaller patients can be mitigated with a few options. One is to reduce the tube voltage and increase the tube current in such a way as to keep the desired scanner output (CTDIvol) at acceptable levels for a LCS scan. This will also raise the tube current values above scanner minimums and allow modulation. Another option is that in some scanners (e.g., SOMATOM Force, Siemens Healthineers, Forchheim Germany), additional filtration (in this case, Sn)9 can be used. In this scenario, the tube current can again be raised above the scanner minimum and, because of the additional filtration, the scanner output (CTDIvol) can reach acceptably low levels for an LCS scan. The behavior of AEC at either extreme size region should be noted and will be the subject of further investigation.
The advantages of this study include correlations of estimating lung, breast, and effective dose from LD‐LCS with TCM. These advantages notwithstanding, there are nevertheless a few important limitations to bear in mind. The first limitation is that the TCM prediction scheme of only one manufacturer is modeled and thus the results presented here reflect only that CT system. While all manufacturers’ approaches generate variable tube current as a function of patient attenuation characteristics, the specific implementation details vary widely across manufacturers in terms of how the tube current is varied, how tube current limits are incorporated, and many other aspects. In previous work,29 a measure of scanner output that was more specific to an anatomic region or organ was used as the normalization value (CTDIvol, Low Att) with the aim of mitigating differences in implementation of TCM across scanners and focusing on the regional output of the scanner. In addition, the TCM prediction method used in this study approximates the approach used by the manufacturer. Thus, for example, while the prediction method does take into consideration sudden changes in attenuation,27 differences can nevertheless be observed in the extracted TCM vs the predicted for the GSF/ICRP phantoms, particularly at the interfaces of tissue boundaries as the boundary of the lungs and the diaphragm, such as can be seen in Figs. 2 and 3. As a result, the estimate of organ dose could be affected. For example, in Fig. 3, the impact of this approximation relative to an extracted TCM profile could be an increased lung dose estimate, as well potentially an increased breast dose estimate depending on their position.
A second limitation is that, while the use of voxelized phantom models circumvented the shortcoming of using the idealized, mathematical patient models employed by Larke et al., the limited number of available phantom models with segmented organs presents a challenge when trying to develop robust correlations. Additionally, the size distribution represented in the adult GSF/ICRP models may not be reflective of the LDCT‐LCS population as the size range which they provide is quite narrow, hence some of the regression models may have limited applicability. The addition of patient thoracic models from image data does mitigate some of these shortcomings, but these models did not have all the radiosensitive organs segmented and therefore were limited in their ability to contribute to all aspects of this work. Moreover, since these thoracic models were based on image data, the effects of back scatter from tissues outside the scan range are ignored and could therefore lead to an underestimation of lung and breast dose. However, the contribution from back scatter from outside the field of view is expected to be small. To test this, an LCS MCNPX simulation was performed on the GSF model “Helga” wherein the whole body model was truncated to resemble a thoracic model from a chest scan. Lung and breast dose estimates resulting from truncated model were compared to the lung and breast dose of the whole body model. Helga was chosen because she is the largest of the GSF models and hence has more scattering material. The simulation was carried out in the same manner as described in Section 2.F. The simulations yielded lung and breast dose estimates that were different by −3% and −%1, respectively, from estimates using the whole body phantom. This simulation did show that not considering backscatter from outside the field of view can lead to an underestimation of the dose, albeit a small one. Nevertheless, to address these limitations in the future, a larger range of validated, whole body phantom models of different sizes with all radiosensitive organs segmented would be needed. Additionally, investigating and quantifying the effects of backscatter will be the subject of future investigations.
Acknowledgments
This work was supported in part by a grant from the NIBIB (R01‐EB017095) and by a grant from the NIH (T32‐EB002101). C.H.M. receives research support from Siemens Healthcare. M.M.G's department has a master research agreement with Siemens Healthcare.
Appendix A.
TCM functions for GSF/ICRP phantom models
Below are the LCS TCM curves incorporated in the MC simulation for the remaining GSF and ICRP phantom models used in this study. The tube current profiles were predicted from the attenuation characteristics of each phantom from a simulated CT localizer radiograph according the algorithm used by Siemens as described in Sections 2.D and 2.F.27 As with Figure 3, the solid blue line represents the estimated tube current modulation data, the solid red line represents the average tube current across the scan length, the dash cyan lines represent the extent of the low attenuation region, and the dashed yellow line represents the lower machine limit. Baby and Child phantoms were simulated but were not included in this study because they experience no modulation and their tube current profiles are fixed at the machine lower limit of 20 mA. For these two phantoms, the blue line representing the tube current is overlaid over the scanner tube current minimum. For this reason, their organ and effective dose estimates were not included in the study. They are included in this appendix to illustrate that very small patients scanned with TCM may result in scans that effectively revert to a fixed mA protocol.
Figure A1.

Predicted TCM scheme for GSF model Baby. [Color figure can be viewed at wileyonlinelibrary.com]
Figure A2.

Predicted TCM scheme for GSF model Child. [Color figure can be viewed at wileyonlinelibrary.com]
Figure A3.
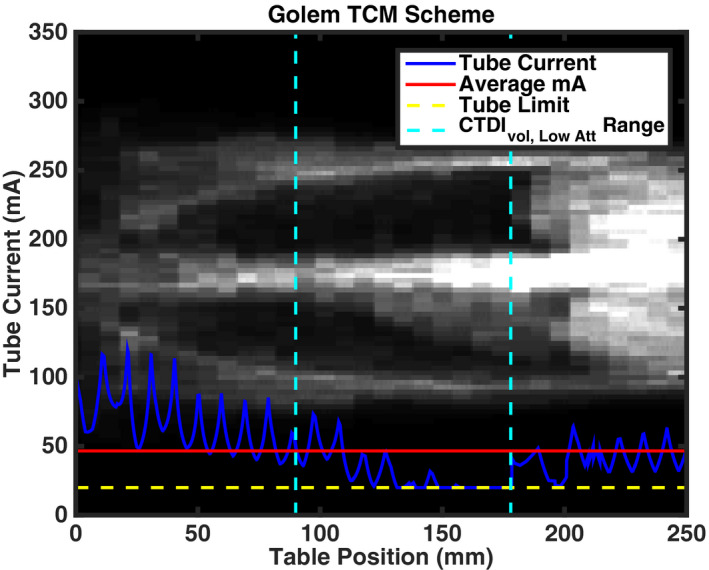
Predicted TCM scheme for GSF model Golem. [Color figure can be viewed at wileyonlinelibrary.com]
Figure A4.

Predicted TCM scheme for GSF model Helga. [Color figure can be viewed at wileyonlinelibrary.com]
Figure A5.

Predicted TCM scheme for GSF model Visible Human. [Color figure can be viewed at wileyonlinelibrary.com]
Figure A6.

Predicted TCM scheme for GSF model Irene. [Color figure can be viewed at wileyonlinelibrary.com]
Figure A7.

Predicted TCM scheme for ICRP model Regina. [Color figure can be viewed at wileyonlinelibrary.com]
Figure A8.

Predicted TCM scheme for ICRP model Rex. [Color figure can be viewed at wileyonlinelibrary.com]
References
- 1. Mountain CF. Revisions in the international for staging lung cancer*. Chest. 1997;111:1710–1717. [DOI] [PubMed] [Google Scholar]
- 2. Aberle DR, Berg CD, Black WC, et al. The national lung screening trial: overview and study design. Radiology. 2011;258:243–253. [DOI] [PMC free article] [PubMed] [Google Scholar]
- 3. Aberle DR, Adams AM, Berg CD, et al. Reduced lung‐cancer mortality with low‐dose computed tomographic screening. N Engl J Med. 2011;365:395–409. [DOI] [PMC free article] [PubMed] [Google Scholar]
- 4. Cagnon CH, Cody DD, McNitt‐Gray MF, Seibert JA, Judy PF, Aberle DR. Description and implementation of a quality control program in an imaging‐based clinical trial. Acad Radiol. 2006;13:1431–1441. [DOI] [PubMed] [Google Scholar]
- 5. Larke FJ, Kruger RL, Cagnon CH, et al. Estimated radiation dose associated with low‐dose chest CT of average‐size participants in the national lung screening trial. Am J Roentgenol. 2011;197:1165–1169. [DOI] [PubMed] [Google Scholar]
- 6. Centers for Medicare & Medicaid Services . Decision Memo for Screening for Lung Cancer with Low Dose Computed Tomography (LDCT) (CAG‐00439N). 2015 [cited 2017 Sep 10];1–97. Available from: https://www.cms.gov/medicare-coverage-database/details/nca-decision-memo.aspx?NCAId=274
- 7. US Preventive Services . Final Recommendation Statement, Lung Cancer: Screening. Available from: http://www.uspreventiveservicestaskforce.org/Page/Document/RecommendationStatementFinal/lung-cancer-screening
- 8. Kazerooni EA, Armstrong MR, Amorosa JK, et al. ACR CT accreditation program and the lung cancer screening program designation. J Am Coll Radiol. 2016;13:R30–R34. [DOI] [PubMed] [Google Scholar]
- 9. American Association of Physicists in Medicine . Lung Cancer Screening CT Protocols. Available from: https://www.aapm.org/pubs/CTProtocols/documents/LungCancerScreeningCT.pdf
- 10. Fujii K, McMillan K, Bostani M, Cagnon C, McNitt‐Gray M. Patient size–specific analysis of dose indexes from CT lung cancer screening. Am J Roentgenol. 2016;208:144–149. [DOI] [PMC free article] [PubMed] [Google Scholar]
- 11. McCollough CH, Leng S, Yu L, Cody DD, Boone JM, McNitt‐Gray MF. CT dose index and patient dose: they are not the same thing. Radiology. 2011;259:311–316. [DOI] [PMC free article] [PubMed] [Google Scholar]
- 12. Kalra MK, Maher MM, Toth TL, et al. Techniques and applications of automatic tube current modulation for CT. Radiology. 2004;233:649–657. [DOI] [PubMed] [Google Scholar]
- 13. Kalender WA, Wolf H, Suess C. Dose reduction in CT by anatomically adapted tube current modulation. II. Phantom measurements. Med Phys. 1999;26:2248–2253. [DOI] [PubMed] [Google Scholar]
- 14. McCollough CH. CT dose: how to measure, how to reduce. Health Phys. 2008;95:508–517. [DOI] [PubMed] [Google Scholar]
- 15. Gies M, Kalender WA, Wolf H, Suess C, Madsen MT. Dose reduction in CT by anatomically adapted tube current modulation. I. Simulation studies. Med Phys. 1999;26:2248–2253. [DOI] [PubMed] [Google Scholar]
- 16. Angel E, Yaghmai N, Jude CM, et al. Dose to radiosensitive organs during routine chest CT: effects of tube current modulation. Am J Roentgenol. 2009;193:1340–1355. [DOI] [PMC free article] [PubMed] [Google Scholar]
- 17. Khatonabadi M, Zhang D, Mathieu K, et al. A comparison of methods to estimate organ doses in CT when utilizing approximations to the tube current modulation function. Med Phys. 2012;39:5212–5228. [DOI] [PMC free article] [PubMed] [Google Scholar]
- 18. Angel E, Yaghmai N, Jude CM, et al. Monte Carlo simulations to assess the effects of tube current modulation on breast dose for multidetector CT. Phys Med Biol. 2010;54:497–512. [DOI] [PMC free article] [PubMed] [Google Scholar]
- 19. Schlattl H, Zankl M, Becker J, Hoeschen C. Dose conversion coefficients for CT examinations of adults with automatic tube current modulation. Phys Med Biol. 2010;55:6243–6261. [DOI] [PubMed] [Google Scholar]
- 20. Matsubara K, Takata T, Koshida K, et al. Chest CT performed with 3D and z‐axis automatic tube current modulation technique. Breast and effective doses. Acad Radiol [Internet]. 2009;16:450–455. [DOI] [PubMed] [Google Scholar]
- 21. He W, Huda W, Magill D, Tavrides E, Yao H. X‐ray tube current modulation and patient doses in chest CT. Radiat Prot Dosimetry [Internet]. 2011;143:81–87. [DOI] [PubMed] [Google Scholar]
- 22. Tian X, Segars WP, Dixon RL, Samei E. Convolution‐based estimation of organ dose in tube current modulated CT. Phys Med Biol. 2016;61:3935–3954. [DOI] [PMC free article] [PubMed] [Google Scholar]
- 23. AAPM Task Group 204 . Size‐Specific Dose Estimates (SSDE) in Pediatric and Adult Body CT Examinations. College Park, MD; 2011.
- 24. AAPM Task Group 220 . Use of Water Equivalent Diameter for Calculating Patient Size and Size‐Specific Dose Estimates (SSDE) in CT. College Park, MD; 2014. [PMC free article] [PubMed]
- 25. Khatonabadi M, Kim HJ, Lu P, et al. The feasibility of a regional CTDIvol to estimate organ dose from tube current modulated CT exams. Med Phys. 2013;40:051903. [DOI] [PMC free article] [PubMed] [Google Scholar]
- 26. Bostani M, McMillan K, Lu P, et al. Estimating organ doses from tube current modulated CT examinations using a generalized linear model. Med Phys. 2017;44:1500–1513. [DOI] [PMC free article] [PubMed] [Google Scholar]
- 27. McMillan K, Bostani M, Cagnon CH, et al. Estimating patient dose from ct exams that use automatic exposure control: development and validation of methods to accurately estimate tube current values. Med Phys. 2017;44:4262–4275. [DOI] [PMC free article] [PubMed] [Google Scholar]
- 28. ICRP . The 2007 Recommendations of the International Commission on Radiological Protection. ICRP Publ 103 Ann ICRP 37; 2007. [DOI] [PubMed]
- 29. Turner AC, Zankl M, DeMarco JJ, et al. The feasibility of a scanner‐independent technique to estimate organ dose from MDCT scans: using CTDIvol to account for differences between scanners. Med Phys. 2010;37:1816–1825. [DOI] [PMC free article] [PubMed] [Google Scholar]
- 30. Petoussi‐Henss N, Zankl M, Fill U, Regulla D, Zanki M. The GSF family of voxel phantoms. Phys Med Biol. 2002;47:89–106. [DOI] [PubMed] [Google Scholar]
- 31. International Commission on Radiological Protection . Adult reference computational phantoms. ICRP Publ 110 Ann ICRP 39; 2009:(2).
- 32. Zankl M, Eckerman KF, Bolch WE. Voxel‐based models representing the male and female ICRP reference adult–the skeleton. Radiat Prot Dosimetry. 2007;127:174–186. [DOI] [PubMed] [Google Scholar]
- 33. ICRU . Tissue Substitutes in Radiation Dosimetry and Measurement. ICRU Rep No 44; 1989. Bethesda, MD: ICRU.
- 34. Demarco JJ, Solberg TD, Smathers JB. A CT‐based Monte Carlo simulation tool for dosimetry planning and analysis. Med Phys. 1998;25:1–11. [DOI] [PubMed] [Google Scholar]
- 35. Pelowitz DB. MCNPX User's Manual. In: MCNPX User's Manual. Los Alamos, NM; 2011.
- 36. AAPM Task Group 195 . Monte Carlo Reference Data Sets for Imaging Research. College Park, MD; 2015. [DOI] [PubMed]
- 37. Bostani M, Mueller JW, McMillan K, et al. Accuracy of Monte Carlo simulations compared to in‐vivo MDCT dosimetry. Med Phys. 2015;42:1080. [DOI] [PMC free article] [PubMed] [Google Scholar]
- 38. Turner AC, Zhang D, Kim HJ, et al. A method to generate equivalent energy spectra and filtration models based on measurement for multidetector CT Monte Carlo dosimetry simulations. Med Phys. 2009;36:2154–2164. [DOI] [PMC free article] [PubMed] [Google Scholar]
- 39. Bostani M, McMillan K, DeMarco JJ, Cagnon CH, McNitt‐Gray MF. Validation of a Monte Carlo model used for simulating tube current modulation in computed tomography over a wide range of phantom conditions/challenges. Med Phys. 2014;41:112101. [DOI] [PMC free article] [PubMed] [Google Scholar]
- 40. AAPM Task Group 96 . The Measurement, Reporting, and Management of Radiation Dose in CT. College Park, MD; 2008.