

 The HK-2 cell model based on clusterin, osteopontin, CysC and KIM-1 would allow the prediction of nephrotoxicity at early stages.
Abstract
The kidney is one of the major target organs for drug-induced toxicity. During drug development, the traditional markers of nephrotoxicity indicate only severe and late damage, which leads to high costs. The new biomarkers are needed for a more sensitive and reliable evaluation of nephrotoxicity, especially for the regulatory accepted and validated in vitro model. We developed an in vitro model based on the HK-2 cell using the biomarkers of nephrotoxicity as endpoints for the evaluation of nephrotoxicity. The predictive performance of the biomarkers including LDH, GGT, KIM-1, clusterin, CysC, NGAL, TIMP-1, GSTπ and osteopontin was evaluated with 22 well characterized compounds. The area under the curve (AUC) values of KIM-1, clusterin, CysC and osteopontin ranged between 0.79 and 0.84. The combination of clusterin, KIM-1 and/or osteopontin improved the AUC value (ranging between 0.88 and 0.95) compared to one biomarker. Taken together, these results suggest that the model based on the HK-2 cell using clusterin, osteopontin, CysC and KIM-1 as endpoints would allow the prediction of nephrotoxicity at early preclinical stages.
Introduction
The kidney is an important excretion organ, maintaining homeostasis and regulating the extracellular environment. The kidney receives about 20–25% of the cardiac output and is one of the major target organs for drug-induced toxicity.1 Drug-induced kidney injury is associated with increased morbidity and mortality of patients. Acute kidney injury (AKI) refers to the sharp decline in kidney function, including but not limited to acute kidney failure.2,3 It is reported that the drug-induced kidney injury contributes to approximately 20% of patients with hospital-acquired AKI.4 Furthermore, during drug development, 82% of preclinical projects failed because of safety problems, in which nephrotoxicity accounts for 8% according to the analysis of AstraZeneca's drug pipeline from 2005 to 2010.5 Therefore, it is necessary to accurately predict and evaluate the nephrotoxicity to promote the drug development and avoid post-marketing withdrawal.
Altogether, the problems outlined above are the lack of pre-clinical models and biomarkers with high sensitivity and specificity. Despite their wide use, traditional markers, such as serum creatinine (SCr) and urea nitrogen (BUN), are known to have low sensitivity for the detection of early kidney injury because of the compensatory function of kidney.6,7 In 2008 and 2010, the Food and Drug Administration (FDA) and the European Medicines Agency (EMA) endorsed the use of several biomarkers including urinary total protein, kidney injury molecule-1 (KIM-1), clusterin, β2-microglobulin (β2-MG), cystatin C (CysC), trefoil factor-3 (TFF-3), renal papillary antigen-1 (RPA-1) and albumin for the prediction of AKI in rats.8–10 Although the predictive performance of these novel biomarkers has been evaluated in different animal models, which is compromised by interspecies variability, high costs and low throughput, the biomarkers are rarely used in the in vitro high-throughput screening in early drug development. An accurate in vitro model can provide important information on the structure activity relationship and toxicity mechanism, which are useful for structure optimization and improving efficiency.5 However, the regulatory accepted and validated in vitro model for the prediction of nephrotoxicity is not available.
It is generally accepted that the appropriate cell types and endpoints are crucial for developing the in vitro models for predicting nephrotoxicity. The renal proximal tubule cells (PTCs) express different kinds of drug transporters and metabolic enzymes, which can influence the effect of drugs. For a remarkable species difference, animal derived cells are more suitable for mechanistic research, but not for the prediction of nephrotoxicity.11–13 The HK-2 cells are derived from human renal PTCs and have been used for the research of nephrotoxicity.14 Although there are a large number of studies on in vitro models, they are mainly based on cell growth parameters, such as metabolism, cell death and apoptosis with low specificity.12,15–17,18 Furthermore, most of the previous studies have been performed with a very limited number of compounds, which cannot determine the sensitivity and specificity of the models.19–21 Therefore, to further understand the potential use of these novel biomarkers of nephrotoxicity in the in vitro model for the early prediction of nephrotoxicity, we investigated the predictive performance of these novel biomarkers of nephrotoxicity as endpoints using the HK-2 cells in the present study.
Materials and methods
Cell culture
HK-2 cells (ATCC, CRL-2190; Manassas, VA, USA) were cultured in DMEM/F12 (Life Technologies; Carlsbad, CA, USA) supplemented with 10 μg mL–1 insulin, 5.5 μg mL–1 transferrin, 6.7 ng mL–1 sodium selenite (ITS-G, 100×; Life Technologies; Carlsbad, CA, USA), 100 U mL–1 penicillin (Life Technologies; Sydney, NSW, Australia), 100 μg mL–1 streptomycin (Life Technologies; Sydney, NSW, Australia) and 10% fetal bovine serum (FBS; Life Technologies; Sydney, NSW, Australia). The cells were plated in 96 well plates with a density of 5 × 10³ cells per well, or 12 well plates with a density of 5 × 10⁴ cells per well and maintained under an atmosphere with 95% air and 5% CO2 at 37 °C.
Compounds
According to the available literature and database, twenty two selected compounds were used in the study, which included 12 nephrotoxins (cisplatin, cyclosporine, aristolochic acid I, triptolide, rifampicin, 5-fluorouracil, gentamicin, tetracycline, ifosfamide, potassium dichromate, tobramycin and cadmium(ii) chloride) that injured the kidney tubule cells and 10 non-nephrotoxic compounds (ibuprofen, furosemide, cyclophosphamide, azathioprine, acetaminophen, vancomycin, ciprofloxacin, doxorubicin, levodopa and acarbose) as shown in Table 1. Gentamicin was obtained from Sigma-Aldrich (St Louis, MO, USA). Potassium dichromate and cadmium(ii) chloride were purchased from Aladdin (Shanghai, China). Other compounds were purchased from the National Institutes for Food and Drug Control (Beijing, China). The stock solutions of the test compounds 1–6, 13–17 and 21 were dissolved in dimethyl sulfoxide (DMSO; Sigma-Aldrich; St Louis, MO, USA). The stock solutions of other test compounds were prepared with water. Vehicle controls were performed with 0.5% DMSO alone. All stock solutions can be stored for up to 3 months in the dark at 4 °C.
Table 1. The test compounds were used in the study. Compounds 1–12 were classified as positive that are known to directly damage the PTC while compounds 13–22 non-PTC-damaging and vehicle control were classified as negative.
| No | Compound | Concentration | Classification |
| 1 | Cisplatin | 1, 10 and 100 μM | Positive |
| 2 | Cyclosporin | 1, 10 and 100 μM | Positive |
| 3 | Aristolochic acid I | 1, 10 and 100 μM | Positive |
| 4 | Triptolide | 0.01, 0.1 and 1 μM | Positive |
| 5 | Rifampicin | 0.01, 0.1 and 1 μM | Positive |
| 6 | 5-Fluorouracil | 0.01, 0.1 and 1 μM | Positive |
| 7 | Gentamicin | 1000, 10 000 and 20 000 μM | Positive |
| 8 | Tetracycline | 0.01, 0.1 and 1 μM | Positive |
| 9 | Ifosfamide | 1, 10 and 100 μM | Positive |
| 10 | Potassium dichromate | 0.01, 0.1 and 1 μM | Positive |
| 11 | Tobramycin | 1, 10 and 100 μM | Positive |
| 12 | Cadmium(ii) chloride | 0.01, 0.1 and 1 μM | Positive |
| 13 | Ibuprofen | 1, 10 and 100 μM | Negative |
| 14 | Furosemide | 1, 10 and 100 μM | Negative |
| 15 | Cyclophosphamide | 10, 100 and 1000 μM | Negative |
| 16 | Azathioprine | 1, 10 and 100 μM | Negative |
| 17 | Acetaminophen | 1000, 10 000 and 20 000 μM | Negative |
| 18 | Vancomycin | 10, 100 and 1000 μM | Negative |
| 19 | Ciprofloxacin | 10, 100 and 1000 μM | Negative |
| 20 | Doxorubicin | 0.01, 0.1 and 1 μM | Negative |
| 21 | Levodopa | 10, 100 and 1000 μM | Negative |
| 22 | Acarbose | 10, 100 and 1000 μM | Negative |
Cell count kit-8 (CCK-8) assay
The CCK-8 (Dojindo; Kumamoto, Japan) assay was used to assess cytotoxicity according to the manufacturer's instructions. In brief, the cells were treated with selected compounds in different concentrations for 24 h in 96 well plates. And then 100 μL 10% CCK-8 dissolved in cultured medium was added to each well and incubated for 2 h at 37 °C, 5% CO2. The absorbance was determined at 450 nm using a Victor X5 Multilabel Reader (PerkinElmer, Waltham, MA, USA). The different concentrations of cisplatin (1, 2, 4, 8, 16, 20, 40, 80, 160, 200 μM), cyclosporin (1, 2, 4, 8, 16, 20, 40, 80, 160, 200 μM), aristolochic acid I (1, 2, 4, 8, 16, 20, 40, 80, 160, 200 μM), gentamicin (0.1,0.2, 0.4, 1, 2, 4, 10, 20, 40, 100 mM) were used and the 50% inhibitive concentration (IC50) was determined using GraphPad Prism 6 software Inc. (La Jolla, CA, USA). The different concentrations of 22 compounds in predictive performance analysis are shown in Table 1. All assays were performed with at least three replicates.
Apoptosis assay
The cells were seeded into 12 well plates (Corning Incorporated, USA) with a density of 5 × 10⁴ cells per well. The cells were cultured for 48 h and then treated for 6, 24 and 48 h with the test compounds (cisplatin: 2, 4 μM; cyclosporin: 4, 8 μM; aristolochic acid I: 8, 16 μM; gentamicin: 4, 8 mM). All assays were performed with three replicates.
Apoptosis assay was performed using an FITC annexin V apoptosis detection kit (BD Biosciences, San Diego, CA, USA) according to the manufacturer's instructions. Briefly, harvested cells were washed twice in cold stain buffer, pelleted by centrifugation and resuspended with binding buffer to a final concentration of 1 × 10⁶ cells per mL. Then 5 μL FITC annexin V and 5 μL propidium iodide were added to 100 μL single cell suspension and incubated for 15 min at room temperature in the dark. After the binding buffer was added, the cells were analysed by flow cytometry (Beckman Coulter, UK) and the analysis was performed using FlowJo Version 7.6.1.
Marker analysis
The cells were seeded into 12 well plates (Corning Incorporated, USA) with a density of 5 × 10⁴ cells per well. The cells were cultured for 48 h and then treated for 6, 24 and 48 h with the test compounds (cisplatin: 2, 4 μM; cyclosporin: 4, 8 μM; aristolochic acid I: 8, 16 μM; gentamicin: 4, 8 mM). All assays were performed with three replicates. The culture medium was collected for the determination of biomarkers and the cells were collected for RNA isolation.
The kits for lactate dehydrogenase (LDH), alkaline phosphatase (ALP), gamma-glutamyl transpeptidase (GGT) and N-acetyl-β-d-glucosaminidase (NAG) were purchased from Wako (Japan) and were conducted successively using a 7180 automatic biochemistry analyzer (Hitachi, Japan). Collagen IV, calbindin, Fatty Acid Binding Protein 1 (FABP-1), glutathione-S-transferase α (GSTα), GSTπ, interferon-induced protein-10 (IP-10), KIM-1, osteoactivin, renin, TFF-3, TIMP-1, α1-microglobulin (α1-MG), albumin, clusterin, CysC, epidermal growth factor (EGF), neutrophil gelatinase associated lipocalin (NGAL) and osteopontin were determined using MILLIPLEX® MAP Human Kidney Injury Magnetic Bead Panels 1 and 2 (Billerica, MA, USA), respectively, following the manufacturer's instructions. The assays are performed on a Luminex® 200 (Austin, TX, USA) which combines a sandwich ELISA immobilized on microparticle beads and flow cytometry. The data were analysed on MILLIPLEX Analyst 5.1 Software (Billerica, MA, USA).
Quantitative real-time PCR
The total RNA in the cells was isolated using an RNAprep Pure Cell/Bacteria Kit (Tiangen Biotech; Beijing, China) after the culture medium was collected in marker analysis. The cDNA synthesis was performed using a FastQuant RT Kit (with gDNase) and SuperReal PreMix Plus (SYBR Green) (Tiangen Biotech; Beijing, China). The qPCR (up to 40 cycles) was then performed with an Applied Biosystems 7500 Fast Real Time PCR System (Carlsbad, CA, USA). The procedures were carried out according to the manufacturers’ instructions with the software included in the device. The data analysis was performed on 7500 Software version 2.0.6. The mRNA levels were determined by the 2–ΔΔCT method and expressed as mean ± SD (n = 3). The primers were purchased from Sangon Biotech (Shang, China). The primer sets of the target markers are shown in Table 2 and GAPDH was the internal control.
Table 2. The primer sequences used for real-time PCR in the study.
| Primers | |
| GAPDH | Forward: 5′-GGCATCCACTGTGGTCATGAG-3′ |
| Reverse: 5′-TGCACCACCAACTGCTTAGC-3′ | |
| KIM-1 | Forward: 5′-CGTCCACCGCAAATGCTT-3′ |
| Reverse: 5′-TCTGCGCAAGTTAGGTTTTGTC- | |
| CysC | Forward: 5′-GCCTGTGCCTATCACCTCTTAT-3 |
| Reverse: 5′-CCTTCTCTGTCTGTCTCCTGGT-3 | |
| TIMP-1 | Forward: 5′-GGGGCTTCACCAAGACCTAC-3′ |
| Reverse: 5′-GGAAGCCCTTTTCAGAGCCT-3′ | |
| Clusterin | Forward: 5′-CCAGGACAGGTTCTTCACCC-3′ |
| Reverse: 5′-CGTACGGAGAGAAGGGCATC-3′ | |
| GSTπ | Forward: 5′-TATTTCCCAGTTCGAGGCCG-3′ |
| Reverse: 5′-TACAGGGTGAGGTCTCCGTC-3′ | |
| Osteopontin | Forward: 5′-TCACTGATTTTCCCACGGACC-3 |
| Reverse: 5′-CAGGGTACTGGATGTCAGGTCT- |
Predictive performance analysis
HK-2 cells were seeded into 96 well plates (Corning Incorporated, USA) with a density of 5 × 10³ cells per well. The cells were cultured for 48 h at about 70% confluent density and then were induced after exposure to the compounds for 24 h. All assays were performed with three replicates per compound per concentration. The concentrations of 22 compounds were determined by CCK-8 assay as shown in Table 1 to induce cell injury. The culture media were collected for the determination of target marker levels including KIM-1, clusterin, CysC, NGAL, GSTπ, TIMP-1, osteopontin, LDH and GGT. The cells were stained with Hoechst 33342 (1 : 4000, 2.5 μg mL–1) purchased from Molecular Probes (Life Technologies; Carlsbad, CA, USA), and then imaged and analysed using an In Cell Analyzer 2000 workstation (GE Healthcare Bio-Sciences Corp., USA). From each well, 9 images were acquired, and cell nuclei were counted in each individual image. Then the average cell numbers per well were derived from these data and the cell viabilities were determined.
Statistical analysis
The apoptosis analysis was performed using FlowJo Version 7.6.1 (Ashland, OA, USA). The difference between treated versus control groups was assessed by one-way analysis of variance (ANOVA) using GraphPad Prism 6 (GraphPad Software, San Diego, CA, USA). Analysis of the receiver operating characteristic curve (ROC), and calculation of the area under the curve (AUC) and the maximum Youden's index (YI) were conducted to evaluate different markers with sensitivity and specificity as previously described with slight modifications using IBM SPSS Statistical 19.0 (SPSS Inc. Chicago, IL, USA).21 The combined diagnostic value of clusterin, osteopontin and KIM-1 was determined by binary logistic analysis. p < 0.05 values were considered as statistically significant.
Results
Drugs inhibited the growth of HK-2 cells
To investigate the cytotoxic effects of compounds in vitro, CCK-8 assay was conducted in HK-2 cells treated with the four compounds (cisplatin, cyclosporin, aristolochic acid I and gentamicin). HK-2 cells were treated with these compounds for 24 h in different concentrations and IC50 values were 10.1 μM, 16.9 μM, 37.4 μM and 22.3 mM, respectively, for cisplatin, cyclosporin, aristolochic acid I and gentamicin implying that the four compounds inhibited the growth of HK-2 cells in a dose-dependent manner (Fig. 1). The concentrations of about 1/5 and 2/5 IC50 for the four compounds were used for apoptosis analysis, marker analysis and PCR analysis.
Fig. 1. The cytotoxic effects of four compounds (cisplatin, cyclosporin, aristolochic acid I and gentamicin) administered to HK-2 cells, respectively.

Drug induced apoptosis of HK-2 cells
To examine whether the four compounds could induce growth inhibition involving apoptosis, the FACS analysis was conducted. As shown in Fig. 2 (Q1: PI positive dead cells; Q2: annexin V/PI positive apoptotic cells; Q3: annexin V positive early apoptotic cells; Q4: viable cells), compared to the vehicle control group with 0.65%, 1.09% and 4.03%, respectively, treatment with different concentrations of the four compounds (cisplatin: 2, 4 μM; cyclosporin: 4, 8 μM; aristolochic acid I: 8, 16 μM; gentamicin: 4, 8 mM) for 24 h resulted in an obvious increase of early apoptotic cells. With the increase of concentration, the early apoptotic cells increased significantly demonstrating the apoptosis in a dose-dependent manner in HK-2 cells.
Fig. 2. Cisplatin, cyclosporin, aristolochic acid I and gentamicin induced the increase in early apoptosis cells in HK-2 cells compared to vehicle control at 24 h. With the increase of compound concentration, the early apoptosis cell increased significantly (Q1: PI positive dead cells; Q2: annexin/PI positive apoptotic cells; Q3: annexin positive early apoptotic cells; Q4: viable cells).

The protein levels of markers in vitro
To determine the suitable endpoints, we evaluated the levels of eighteen biomarkers of nephrotoxicity in culture medium which have been recently identified in vivo. The HK-2 cells were treated with different concentrations of the four compounds (cisplatin: 2, 4 μM; cyclosporin: 4, 8 μM; aristolochic acid I: 8, 16 μM; gentamicin: 4, 8 mM) for 6, 24 and 48 h. There was an obvious increase of KIM-1, TIMP-1, NGAL, clusterin, CysC, GSTπ and osteopontin in HK-2 cells in treatment groups compared to the vehicle control group, as shown in Fig. 3 and 4. The protein levels of the above biomarkers in the treatment groups of four compounds more than doubled compared to the vehicle control group at 24 and 48 h. The levels of KIM-1, TIMP-1, osteopontin and GSTπ at 6 h more than doubled. The increase of protein levels for the above biomarkers in the treatment groups of four compounds was dose-independent once cell damage was caused. And there was no significant difference in protein levels for most biomarkers at 24 h or 48 h.
Fig. 3. The protein levels of clusterin, CysC, GSTπ and KIM-1 in HK-2 cells treated with cisplatin, cyclosporin, aristolochic acid I and gentamicin for 6, 24 and 48 h (mean ± SD, n = 3). *Significantly different from the vehicle control value (p < 0.05).

Fig. 4. The protein levels of NGAL, osteopontin and TIMP-1 in HK-2 cells treated with cisplatin, cyclosporin, aristolochic acid I and gentamicin for 6, 24 and 48 h (mean ± SD, n = 3). *Significantly different from the vehicle control value (p < 0.05).

However, no significant increase of calbindin, albumin, osteoactivin, renin, collagen IV and α1-MG was found in treatment groups in comparison with the vehicle control group (ESI, Fig. S1 and S2†) while the levels of GSTα, IP-10, FABP-1, TFF-3 and EGF were below the detection limit.
Furthermore, the levels of ALP, NAG, LDH and GGT were also investigated. As shown in Fig. 5, the obvious increase of LDH was observed in treatment groups at 48 h, but not at 6 and 24 h. There was an obvious increase of GGT in treatment groups in comparison with the vehicle control group. However, the level of NAG increased only in several treatment groups at 6, 24 and 48 h and the level of ALP did not change significantly in treatment groups compared to the vehicle control group.
Fig. 5. The protein levels of ALP, NAG, GGT and LDH in HK-2 cells treated with cisplatin, cyclosporin, aristolochic acid I and gentamicin for 6, 24 and 48 h (mean ± SD, n = 3). *Significantly different from the vehicle control value (p < 0.05).

Changes in mRNA levels of seven biomarkers
To further determine the levels of biomarkers, we evaluated the mRNA level of the seven above-mentioned biomarkers including KIM-1, clusterin, CysC, NGAL, TIMP-1, GSTπ and osteopontin. As shown in Fig. 6 and 7, the mRNA level of these biomarkers more than doubled compared to the vehicle control group, especially increasing at least three times for CysC at 24 and 48 h, and GSTπ at 48 h. Therefore, both protein and mRNA levels of the seven biomarkers increased significantly in treatment groups at 24 h compared to the vehicle control group.
Fig. 6. The mRNA levels of clusterin, CysC, GSTπ and KIM-1 in HK-2 cells treated with cisplatin, cyclosporin, aristolochic acid I and gentamicin for 6, 24 and 48 h (mean ± SD, n = 3). *Significantly different from the vehicle control value (p < 0.05).

Fig. 7. The mRNA levels of NGAL, osteopontin and TIMP-1 in HK-2 cells treated with cisplatin, cyclosporin, aristolochic acid I and gentamicin for 6, 24 and 48 h (mean ± SD, n = 3). *Significantly different from the vehicle control value (p < 0.05).

Predictive performance analysed with 22 compounds
Then the HK-2 cells were treated with 22 compounds to determine the predictive performance of endpoints. Compounds 1–12 were classified as positive that are known to directly damage the PTC while compounds 13–22 non-PTC-damaging and vehicle control were classified as negative. Since the increase of protein levels was dose-independent once cell damage was caused and there was no significant difference in protein levels for most biomarkers at 24 h or 48 h, the growth inhibition of HK-2 cells induced by 22 compounds at 24 h was determined by CCK-8 assay as shown in Table S1† to confirm the suitable concentration.
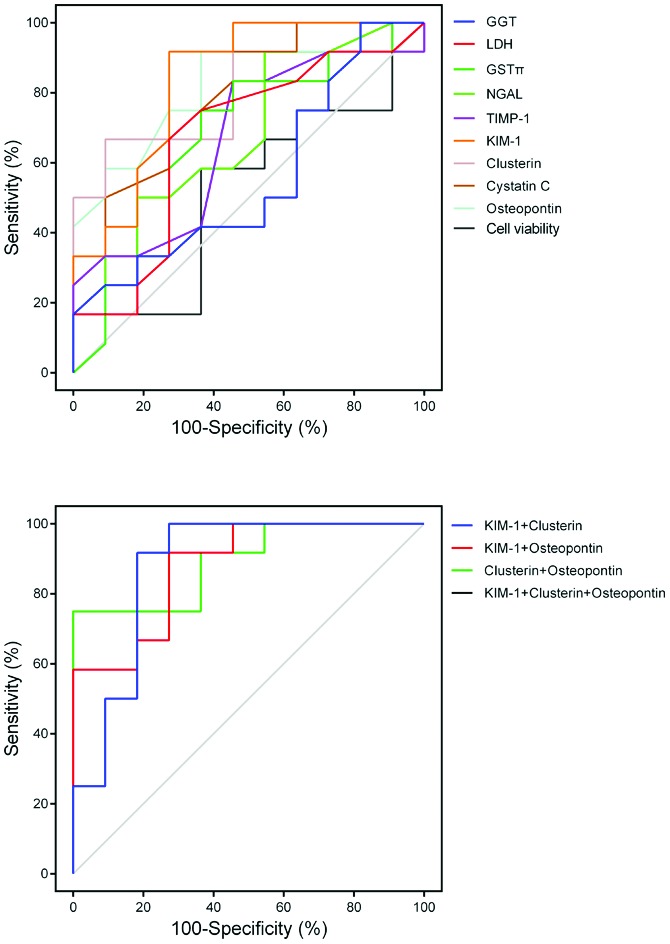
The highest protein level for KIM-1, clusterin, CysC, NGAL, GSTπ, TIMP-1, osteopontin, LDH and GGT, and the lowest level for cell viability were determined (ESI, Fig. S3–S5†) at 24 h. As described by a previous report, the analysis of the ROC curve was performed as shown in Fig. 8.21 The AUC values, sensitivity, specificity and Youden's index (YI) are shown in Table 3. YI (sensitivity + specificity–1) is a single statistic suggested by W. J. Youden, which could accurately evaluate the predictive performance of a diagnostic test more than sensitivity or specificity.22 The predictive performance was high for KIM-1, clusterin, osteopontin and CysC with AUC values of 0.84, 0.83, 0.81 and 0.79, respectively. The combination of clusterin, KIM-1 and or osteopontin improved the diagnostic value compared to one biomarker (AUC values ranging between 0.88 and 0.95). However, the predictive performance was very low for NGAL, GSTπ, TIMP-1, LDH, GGT and cell viability with the AUC values of 0.69, 0.67, 0.67, 0.67, 0.56 and 0.56, respectively.
Fig. 8. The ROC curve for KIM-1, clusterin, osteopontin, CysC, NGAL, GSTπ, TIMP-1, LDH, GGT and cell viability alone, and combination of KIM-1 + clusterin, KIM-1 + osteopontin, clusterin + osteopontin and KIM-1 + clusterin + osteopontin. The combination of clusterin, KIM-1 and or osteopontin improved the diagnostic value compared to the biomarker individually.

Table 3. Performance metrics of markers alone and combination including AUC, sensitivity, specificity and Youden's index (YI).
| Markers | AUC | Sensitivity | Specificity | YI |
| GGT | 0.56 | 0.17 | 1.00 | 0.17 |
| LDH | 0.67 | 0.67 | 0.73 | 0.39 |
| GSTπ | 0.67 | 0.75 | 0.64 | 0.39 |
| TIMP-1 | 0.67 | 0.83 | 0.55 | 0.38 |
| KIM-1 | 0.84 | 0.92 | 0.73 | 0.64 |
| Clusterin | 0.83 | 0.67 | 0.91 | 0.58 |
| CysC | 0.79 | 0.92 | 0.55 | 0.46 |
| Osteopontin | 0.81 | 0.92 | 0.64 | 0.55 |
| Cell count | 0.52 | 0.58 | 0.64 | 0.22 |
| KIM-1 + clusterin | 0.88 | 1.00 | 0.73 | 0.73 |
| KIM-1 + osteopontin | 0.88 | 0.92 | 0.73 | 0.64 |
| Clusterin + osteopontin | 0.89 | 0.92 | 1.00 | 0.75 |
| KIM-1 + clusterin + osteopontin | 0.95 | 0.75 | 1.00 | 0.75 |
Discussion
Nephrotoxicity is also a significant adverse effect of many marketed drugs. Although in vivo tests have been used in the evaluation of multiple toxic compounds, in vitro tests are more cost effective, practical and expedient, which support the early toxicity prediction of large numbers of compounds prior to in vivo tests.19 Although many biomarkers of nephrotoxicity have been evaluated and applied in preclinical and clinical studies, they are rarely examined in vitro at an early screening stage. In the study, we investigated the potential of biomarkers of nephrotoxicity in HK-2 cells as an in vitro screening model and compared the predictive performance of biomarkers of nephrotoxicity and cytotoxic endpoints.
The difficulties in developing in vitro models for the evaluation of nephrotoxicity may be due to the cell types. In comparison with the isolated perfused kidney, kidney slices and primary renal cells, immortalized cell lines can be easily obtained and properties can be kept stable for a long time.11,12,23,24 With functional, morphological and biochemical characteristics of human PTC, HK-2 cells have been used in a variety of in vitro research studies of nephrotoxicity.20,21,25,26 Herein, the four compounds (cisplatin, cyclosporin, aristolochic acid I and gentamicin), representing a variety of nephrotoxicants, were chosen to verify the cytotoxicity and the levels of biomarkers of nephrotoxicity. With a very low level of megalin, the gentamicin uptake was altered in HK-2 cells.27 We found that HK-2 cells were less sensitive to gentamicin (IC50 value of 22.3 mM) compared to other three compounds with low IC50 (μM). It has been found that cisplatin could induce the apoptosis of HK-2 cells.20 In the study, we found a similar effect of the four compounds on HK-2 cells. These results imply that the observed inhibitory effect of four compounds on the growth of HK-2 cells may be due to the induction of apoptotic cells.
In addition, it is difficult to understand the functional state of cells and identify appropriate endpoints in vitro. In the study, the apoptosis analysis of the four compounds further confirmed that the concentration could injure the HK-2 cells to some extent. As the same with recently reported biomarkers for nephrotoxicity evaluation in vivo, we also found that the protein and mRNA levels of KIM-1, clusterin, CysC, NGAL, TIMP-1, GSTπ and osteopontin in HK-2 cells significantly increased.10 And also the levels of LDH and GGT under the same conditions increased to some extent. However, these endpoints increased in a dose-independent manner once cell damage was caused and there was no significant difference in protein levels for most biomarkers at 24 h or 48 h, which may be explained by the fact that the expression depends on the functional state of cells, not the injury degree. Therefore, the concentrations of compounds and the treatment time were determined in the predictive performance analysis. It has been investigated that KIM-1, calbindin and TIMP-1 can be effectively used as biomarkers for cisplatin induced nephrotoxicity, while β2-MG, CysC, NGAL and clusterin are not affected by cisplatin treatment in the HK-2 cells using western blot and reverse transcription PCR analysis.20 It is also reported that the cytotoxicity of HK-2 cells correlates with the levels of biomarkers (particularly KIM-1, GSTα) in rat urine, as well as the histopathological changes in kidneys.28 A significant and consistent up-regulation of NGAL, KIM-1 in HK-2 cells, LLC-PK1 cells and human primary renal PTCs in vitro treated with gentamicin and CdCl2 was observed.21 The changes in mRNA levels of KIM-1, NGAL and M-CSF were identified, but not protein levels of the three biomarkers in HK-2 cells treated with cisplatin.18 Intriguingly, in the current reports, the findings of biomarkers are not the same. These results might be explained by the fact that the levels of biomarkers can be affected by many factors including the cell type, injury mechanism and cellular response. Furthermore, the absolute levels of biomarkers in vitro are much lower than in vivo because of the inherent limitations of the in vitro model. All these findings may explain why the regulatory accepted and validated in vitro model for the prediction of nephrotoxicity is still not available. Meanwhile, only one endpoint may not be sufficient for predictive models in early preclinical screening.
In our study, considering the functional state of cells and protein levels of these biomarkers with the treatment time, we compared the predictive performance of different endpoints as shown in Table 3 when the HK-2 cells were treated with 22 compounds for 24 h. The protein levels of biomarkers in culture medium were used as endpoints with high throughput, but not the mRNA levels. These compounds used here were drugs that are widely applied in clinical practice or chemicals that are well characterized, for which the data in vivo and in vitro are well available. The cell viability, GGT and LDH were used as the endpoints with the AUC values of 0.56, 0.56 and 0.67, respectively, suggesting that the accuracy would not be better than chance. This is illustrated by a recent study on organ specific toxicity, where HepG2, H9c2 and NRK-52E cells were treated with 621 compounds (273 hepatotoxicants, 191 cardiotoxicants, 85 nephrotoxicants and 72 nontoxic compounds). In the study, low sensitivity and specificity were observed when the endpoint was ATP.24 In other studies, the predictive performance was low when cell viability, LDH, GSH and ATP were used as the endpoints in human primary renal proximal tubule cells (HPTC) or human embryonic stem cell (hESC) derived HPTC like cells treated with 41 compounds.21,26 These results illustrate that general cytotoxic endpoints might not be useful for organ specific assays.
In the studies aiming at the development of in vitro models, a comprehensive comparison of different PTC cell types was made with 41 well characterized compounds using the mRNA levels of IL6/IL-8 as endpoints. The best in terms of predicting nephrotoxicity was HPTC (AUC value of 0.85), followed by hESC derived cells (AUC value of 0.80). And the AUC values for HK-2 and LLC-PK1 cells were 0.71 and 0.73, respectively. Though HPTC expresses a broad variety of drug transporters and metabolizing enzymes, there are some obvious disadvantages including inter-donor variability, functional change, cell source limitation and the limited proliferative capacity, implying that the model is not suitable for high throughput screening taking into account the labor-intensive and time-consuming PCR method.21,26
Here, we developed an in vitro model for the prediction of nephrotoxicity using the HK-2 cells based on novel biomarkers of nephrotoxicity as endpoints, which distinguishes our model from other models. In comparison with the cytotoxic endpoints, the predictive performance of these biomarkers significantly improved. The AUC values of clusterin, osteopontin, CysC and KIM-1 ranged between 0.79 and 0.84 except for GSTπ and TIMP-1. These results show that the predictive performance of the model based on the four biomarkers is high and it would be expected in 79%–84% of the cases where compounds are correctly predicted as positive or negative. It has been reported that the combination of biomarkers maximizes the advantages of single biomarkers and the accuracy of prediction of nephrotoxicity is higher than the single biomarker.21,29 We also found that the combination of clusterin, KIM-1 and/or osteopontin improved the diagnostic value compared to one biomarker (AUC values ranging between 0.88 and 0.95).
Conclusions
Together, we have developed an in vitro model based on the HK-2 cells using clusterin, osteopontin, CysC and KIM-1 as endpoints for the evaluation of nephrotoxicity at an early screening stage with high predictive performance. The AUC values range between 0.79 and 0.95 when the four biomarkers are used individually or in combination. This would provide additionally valuable information for hit-to-lead discovery and lead optimization at the early stage. Furthermore, the predictive performance of the model also needs further validation with more compounds in prospective studies.
Conflicts of interest
There are no conflicts of interest to declare.
Supplementary Material
Acknowledgments
This work was supported by the grants from Ministry of Science and Technology of the People's Republic of China (No. 2015ZX09501004-002 and No. 2018ZX09201017-001), the National Natural Science Foundation of China (No. 81603210).
Footnotes
†Electronic supplementary information (ESI) available. See DOI: 10.1039/c8tx00095f
References
- Choudhury D., Ahmed Z. Nat. Clin. Pract. Nephrol. 2006;2:80–91. doi: 10.1038/ncpneph0076. [DOI] [PubMed] [Google Scholar]
- Rewa O., Bagshaw S. M. Nat. Rev. Nephrol. 2014;10:193–207. doi: 10.1038/nrneph.2013.282. [DOI] [PubMed] [Google Scholar]
- Kellum J. A., Lameire N. Crit. Care. 2013;17:204. doi: 10.1186/cc11454. [DOI] [PMC free article] [PubMed] [Google Scholar]
- Luyckx V. A., Naicker S. Nat. Clin. Pract. Nephrol. 2008;4:664–671. doi: 10.1038/ncpneph0970. [DOI] [PubMed] [Google Scholar]
- Cook D., Brown D., Alexander R., March R., Morgan P., Satterthwaite G., Pangalos M. N. Nat. Rev. Drug Discovery. 2014;13:419–431. doi: 10.1038/nrd4309. [DOI] [PubMed] [Google Scholar]
- Marrer E., Dieterle F. Toxicol. Appl. Pharmacol. 2010;243:167–179. doi: 10.1016/j.taap.2009.12.015. [DOI] [PubMed] [Google Scholar]
- Bonventre J. V., Vaidya V. S., Schmouder R., Feig P., Dieterle F. Nat. Biotechnol. 2010;28:436–440. doi: 10.1038/nbt0510-436. [DOI] [PMC free article] [PubMed] [Google Scholar]
- Sistare F. D., Dieterle F., Troth S., Holder D. J., Gerhold D., Andrews-Cleavenger D., Baer W., Betton G., Bounous D., Carl K., Collins N., Goering P., Goodsaid F., Gu Y. Z., Guilpin V., Harpur E., Hassan A., Jacobson-Kram D., Kasper P., Laurie D., Lima B. S., Maciulaitis R., Mattes W., Maurer G., Obert L. A., Ozer J., Papaluca-Amati M., Phillips J. A., Pinches M., Schipper M. J., Thompson K. L., Vamvakas S., Vidal J. M., Vonderscher J., Walker E., Webb C., Yu Y. Nat. Biotechnol. 2010;28:446–454. doi: 10.1038/nbt.1634. [DOI] [PubMed] [Google Scholar]
- Dieterle F., Sistare F., Goodsaid F., Papaluca M., Ozer J. S., Webb C. P., Baer W., Senagore A., Schipper M. J., Vonderscher J., Sultana S., Gerhold D. L., Phillips J. A., Maurer G., Carl K., Laurie D., Harpur E., Sonee M., Ennulat D., Holder D., Andrews-Cleavenger D., Gu Y. Z., Thompson K. L., Goering P. L., Vidal J. M., Abadie E., Maciulaitis R., Jacobson-Kram D., Defelice A. F., Hausner E. A., Blank M., Thompson A., Harlow P., Throckmorton D., Xiao S., Xu N., Taylor W., Vamvakas S., Flamion B., Lima B. S., Kasper P., Pasanen M., Prasad K., Troth S., Bounous D., Robinson-Gravatt D., Betton G., Davis M. A., Akunda J., McDuffie J. E., Suter L., Obert L., Guffroy M., Pinches M., Jayadev S., Blomme E. A., Beushausen S. A., Barlow V. G., Collins N., Waring J., Honor D., Snook S., Lee J., Rossi P., Walker E., Mattes W. Nat. Biotechnol. 2010;28:455–462. doi: 10.1038/nbt.1625. [DOI] [PubMed] [Google Scholar]
- Hoffmann D., Fuchs T. C., Henzler T., Matheis K. A., Herget T., Dekant W., Hewitt P., Mally A. Toxicology. 2010;277:49–58. doi: 10.1016/j.tox.2010.08.013. [DOI] [PubMed] [Google Scholar]
- Aleksa K., Halachmi N., Ito S., Koren G. Can. J. Physiol. Pharmacol. 2005;83:499–508. doi: 10.1139/y05-036. [DOI] [PubMed] [Google Scholar]
- Gunness P., Aleksa K., Kosuge K., Ito S., Koren G. Can. J. Physiol. Pharmacol. 2010;88:448–455. doi: 10.1139/y10-023. [DOI] [PubMed] [Google Scholar]
- Schinkel A. H., Mayer U., Wagenaar E., Mol C. A., van Deemter L., Smit J. J., van der Valk M. A., Voordouw A. C., Spits H., van Tellingen O., Zijlmans J. M., Fibbe W. E., Borst P. Proc. Natl. Acad. Sci. U. S. A. 1997;94:4028–4033. doi: 10.1073/pnas.94.8.4028. [DOI] [PMC free article] [PubMed] [Google Scholar]
- Ryan M. J., Johnson G., Kirk J., Fuerstenberg S. M., Zager R. A., Torok-Storb B. Kidney Int. 1994;45:48–57. doi: 10.1038/ki.1994.6. [DOI] [PubMed] [Google Scholar]
- Astashkina A. I., Mann B. K., Prestwich G. D., Grainger D. W. Biomaterials. 2012;33:4700–4711. doi: 10.1016/j.biomaterials.2012.02.063. [DOI] [PubMed] [Google Scholar]
- Astashkina A. I., Mann B. K., Prestwich G. D., Grainger D. W. Biomaterials. 2012;33:4712–4721. doi: 10.1016/j.biomaterials.2012.03.001. [DOI] [PubMed] [Google Scholar]
- Astashkina A. I., Grainger D. W. Adv. Drug Delivery Rev. 2014;69–70:1–18. doi: 10.1016/j.addr.2014.02.008. [DOI] [PubMed] [Google Scholar]
- Huang J. X., Kaeslin G., Ranall M. V., Blaskovich M. A., Becker B., Butler M. S., Little M. H., Lash L. H., Cooper M. A. Pharmacol. Res. Perspect. 2015;3:e00148. doi: 10.1002/prp2.148. [DOI] [PMC free article] [PubMed] [Google Scholar]
- Huang J. X., Blaskovich M. A., Cooper M. A. Expert Opin. Drug Metab. Toxicol. 2014;10:1621–1635. doi: 10.1517/17425255.2014.967681. [DOI] [PubMed] [Google Scholar]
- Sohn S. J., Kim S. Y., Kim H. S., Chun Y. J., Han S. Y., Kim S. H., Moon A. Toxicol. Lett. 2013;217:235–242. doi: 10.1016/j.toxlet.2012.12.015. [DOI] [PubMed] [Google Scholar]
- Li Y., Oo Z. Y., Chang S. Y., Huang P., Eng K. G., Zeng J. L., Kaestli A. J., Gopalan B., Kandasamy K., Tasnim F., Zink D. Toxicol. Res. 2013;2:352–365. [Google Scholar]
- Youden W. J. Cancer. 1950;3:32–35. doi: 10.1002/1097-0142(1950)3:1<32::aid-cncr2820030106>3.0.co;2-3. [DOI] [PubMed] [Google Scholar]
- Williams P. D. and Rush G. F., An evaluation of in vitro models for assessing nephrotoxicity, in In Vitro Toxicity Testing: Applications to Safety Evaluation, ed. J. M. Frazier, Marcel Dekker Inc., New York, 1992, pp. 85–110. [Google Scholar]
- Lin Z., Will Y. Toxicol. Sci. 2012;126:114–127. doi: 10.1093/toxsci/kfr339. [DOI] [PubMed] [Google Scholar]
- Jenkinson S. E., Chung G. W., van Loon E., Bakar N. S., Dalzell A. M., Brown C. D. Pfluegers Arch. 2012;464:601–611. doi: 10.1007/s00424-012-1163-2. [DOI] [PubMed] [Google Scholar]
- Li Y., Kandasamy K., Chuah J. K., Lam Y. N., Toh W. S., Oo Z. Y., Zink D. Mol. Pharm. 2014;11:1982–1990. doi: 10.1021/mp400637s. [DOI] [PubMed] [Google Scholar]
- Sawada T., Nagai J., Okada Y., Yumoto R., Takano M. Eur. J. Pharmacol. 2012;684:146–153. doi: 10.1016/j.ejphar.2012.03.030. [DOI] [PubMed] [Google Scholar]
- Keirstead N. D., Wagoner M. P., Bentley P., Blais M., Brown C., Cheatham L., Ciaccio P., Dragan Y., Ferguson D., Fikes J., Galvin M., Gupta A., Hale M., Johnson N., Luo W., McGrath F., Pietras M., Price S., Sathe A. G., Sasaki J. C., Snow D., Walsky R. L., Kern G. Toxicol. Sci. 2014;137:278–291. doi: 10.1093/toxsci/kft247. [DOI] [PubMed] [Google Scholar]
- Takaya Y., Yoshihara F., Yokoyama H., Kawano Y. Circ. J. 2015;79:1520–1525. doi: 10.1253/circj.CJ-14-1360. [DOI] [PubMed] [Google Scholar]
Associated Data
This section collects any data citations, data availability statements, or supplementary materials included in this article.