

Abstract
Chronic hepatitis C virus (HCV) infection can result in steatosis, a condition displaying aberrant accumulation of neutral lipid vesicles, the component of lipid droplets (LDs), which are essential for HCV assembly. However, the interplay between HCV infection and steatosis remains unclear. Here, we show that HCV‐infected cells have higher levels of CD2‐associated protein (CD2AP), which plays two distinct, yet tightly linked, roles in HCV pathogenesis: Elevated CD2AP binds to nonstructural protein 5A (NS5A) and participates in the transport of NS5A to LDs to facilitate viral assembly; Up‐regulated CD2AP also interacts with casitas B‐lineage lymphoma (b) (Cbl/Cbl‐b) E3 ligases to degrade insulin receptor substrate 1 (IRS1), which, in turn, disrupts insulin signaling and increases LD accumulation through the IRS1/protein kinase B (Akt)/adenosine monophosphate‐activated protein kinase (AMPK)/hormone‐sensitive lipase (HSL) signaling axis to accommodate viral assembly. In the HCV‐infected mouse model, CD2AP expression is up‐regulated during the chronic infection stage and this up‐regulation correlates well with liver steatosis. Importantly, CD2AP up‐regulation was also detected in HCV‐infected human liver biopsies showing steatosis compared to non‐HCV‐infected controls. Conclusion: CD2AP is indicated as a protein up‐regulated by HCV infection, which, in turn, stimulates HCV propagation and steatosis by disrupting insulin signaling; targeting CD2AP may offer an opportunity for alleviating HCV infection and its associated liver pathology. (Hepatology 2018;XX:XXX‐XXX.)
Abbreviations
- ACC1/2
acetyl‐CoA carboxylases 1 and 2
- Akt
protein kinase B
- AMPK
adenosine monophosphate kinase
- BioID
proximity‐dependent biotinylation method
- BirA*
BirA (R118G)‐HA
- Cbl/Cbl‐b
casitas B‐lineage lymphoma (b)
- CD2AP
CD2‐associated protein
- Erk
extracellular signal‐regulated kinase
- HA
hemagglutinin
- HCC
hepatocellular carcinoma
- HCV
hepatitis C virus
- HSL
hormone‐sensitive lipase
- Ig
immunoglobulin
- IHC
immunohistochemistry
- IRS1
insulin receptor substrate 1
- JFH1
Japanese fulminant hepatitis type 1
- LDs
lipid droplets
- LS
liver steatosis
- NS5A
nonstructural protein 5A
- OA
oleic acid
- p
phosphorylated
- SH3
Src homology 3
Hepatitis C virus (HCV) infects approximately 180 million people worldwide, causing serious chronic liver diseases such as steatosis, liver cirrhosis, and, eventually, hepatocellular carcinoma (HCC).1 Although a myriad of host factors have been reported to regulate viral propagation from entry to release of infectious particles,2, 3, 4 it is not fully understood how chronic HCV infection causes steatosis.
Lipid droplets (LDs), an organelle composed of a single phosphor‐lipid layer,5 participate in many biological processes, such as energy storage and lipid metabolism.6 HCV uses LDs as hubs for assembly.7, 8 HCV proteins, especially nonstructural protein 5A (NS5A) and HCV core protein, are in close proximity to LDs in HCV‐infected cells.9, 10 Transport of core and NS5A proteins to LDs depends on interactions between viral proteins, such as NS5A, and cytoskeletal filaments, such as actin and microtubules.11, 12
The goal of our studies was to better understand how HCV controls LD accumulation and contributes to liver pathology. We applied the proximity‐dependent biotinylation (BioID) method to find NS5A interacting proteins in situ.13 One of the identified proteins was CD2‐associated protein (CD2AP), an adaptor protein that is known to bind capping protein and regulate actin polymerization.14 We further show that CD2AP facilitates HCV propagation by two mechanistically linked pathways: participating in transporting NS5A to LDs and disrupting insulin signaling to boost more hubs for HCV assembly. In transgenic ICR mice infected with HCV, CD2AP up‐regulation is detected in hepatocytes during the chronic stage of infection, concurrent with the appearance of steatosis. Importantly, levels of CD2AP are also up‐regulated in liver biopsies from HCV‐infected patients showing steatosis. Thus, our study indicates a link between CD2AP, HCV infection, and steatosis.
Materials and Methods
Materials
Cell cultures, viruses, plasmids, and reagents are described in the Supporting Information.
Animal Model
Eight‐ to 12‐week‐old age‐ and sex‐matched littermates of human CD81 and occludin transgenic ICR mice were used for in vivo study and infected with HCV as described.15 Mice were tail‐vein injected with HCV J399EM (tissue culture infective dose, 50 = 1 × 10⁸/mL; 1 mL in 1‐2 minutes to avoid liver injury). Mouse blood (0.1 mL) and liver tissues (0.1 g) were collected to quantify HCV genomic RNA at the indicated time. Five mice at each time point were infected with HCV. Two to three HCV infection‐confirmed mice were used for further analysis. One of the noninfected mice at each time point was used as negative control. Data collection and data analysis were performed by different persons in a blinded manner. Use of animals was approved by the Institutional Review Board of Wuhan Institute of Virology, Chinese Academy of Sciences (Wuhan, China).15
Human Subjects
Seventy‐two serologically confirmed HCV‐infected human liver biopsies were obtained from resected liver tissues containing HCC, hemangioma, or cholangiocarcinoma from patients at the Tongji Hospital (Wuhan, China) and Eastern Hepatobiliary Surgery Hospital (Shanghai, China; patients’ information in Supporting Table S1). No biopsies were obtained from executed prisoners or other institutionalized persons. Liver samples from HCV/HBV (hepatitis B virus) coinfection were excluded. Twelve non‐HCV‐ and non‐HBV‐infected control specimens were obtained from normal regions of liver adjacent to resected hemangioma (patients’ information in Supporting Table S1). Biopsies were scored for steatosis, cirrhosis, and HCC by two pathologists, Changshu Ke (M.D., Ph.D.) and Yu Hu (M.D., Ph.D.; Department of Pathology, Tongji Hospital). Among the 72 biopsies, 53 also had HCC, 7 cases did not show steatosis and cirrhosis, 17 cases showed only steatosis, 20 cases showed steatosis and cirrhosis, and 4 cases showed only cirrhosis. Some cases could not be determined and thus were excluded. Informed consent was obtained from all subjects. Use of liver sections was approved by the Institutional Review Board of Wuhan Institute of Virology, Chinese Academy of Sciences (Approval Number: WIVH28201601).
Methods of IN VITRO Assays, Statistical Analysis
In vitro assays and statistical analysis are described in the Supporting Information.
Results
HCV NS5A BINDS CD2AP
HCV NS5A plays an important role in HCV propagation. To identify proteins participating in HCV propagation, Huh7 cells with the NS5A‐BirA*‐HA construct (Fig. 1A) were cultured with or without biotin; more biotin‐labeled proteins were detected in cells cultured with biotin (Fig. 1A). Several bands presented only in samples with biotin were sequenced and identified (Supporting Table S2). Among those proteins, CD2AP is an adaptor protein with three Src homology 3 (SH3) domains. Conversely, NS5A has several proline‐rich motifs that are reported to bind the SH3 domain.16 Structural information thus suggests that CD2AP might interact with NS5A. Furthermore, the association of HCV replication complexes with actin has been shown depending on NS3 and NS5A interaction,17 and CD2AP can regulate actin organization.18 We thus focused on studying interactions between CD2AP and NS5A.
Figure 1.

HCV NS5A binds host protein CD2AP. (A) A diagram of the HCV NS5A‐ BirA* construct. Huh7 cells expressing NS5A BirA*‐HA were incubated for 24 hours in complete media supplemented with or without 50 µM of biotin. Lysates were purified by streptavidin‐agarose beads and analyzed by mass spectrometry. CD2AP band was labeled with the asterisk. (B) Analysis of interactions between CD2AP and NS5A in Huh7.5.1 cells under HCV infection. Huh7.5.1 cells were infected with HCV JFH1 or left uninfected for 72 hours. Cell lysates were co‐immunoprecipitated with anti‐CD2AP antibody or anti‐NS5A antibody. The immunoprecipitation complex was analyzed by immunoblotting with anti‐NS5A antibody and anti‐CD2AP antibody. (C) HCV‐infected cell lysates were co‐immunoprecipitated with anti‐NS5A antibody or control mouse IgG2a. (D) Colocation of CD2AP and NS5A in HCV J399EM–infected Huh7.5.1 cells. (E) A schematic diagram of full‐length and truncated CD2AP. Analysis of the interactions between CD2AP truncates with NS5A in 293T cells. FLAG‐tagged CD2AP truncates are labeled with the asterisk. Nonspecific bands with molecular weight between 20 and 35 kDa are not shown. (F) A schematic representation of full‐length and truncated NS5A. Analysis of the interactions between NS5A truncates with CD2AP in 293T cells. FLAG‐tagged NS5A truncates are denoted with the asterisk. Abbreviations: IP, immunoprecipitation.
We found that CD2AP indeed interacted with NS5A (Supporting Fig. S1A), but not core protein (Supporting Fig. S1B) in vitro. In HCV Japanese fulminant hepatitis type 1 (JFH1)‐infected cells, anti‐CD2AP antibody pulled down NS5A and CD2AP (Fig. 1B). Conversely, anti‐NS5A antibody also pulled down CD2AP and NS5A (Fig. 1B). Copurification was not observed with an isotype control mouse immunoglobulin (Ig)G2a (Fig. 1C). In addition, we observed colocalization of CD2AP and NS5A in cells infected with HCV‐J399EM (Fig. 1D), the HCV 2a strain in which NS5A is enhanced green fluorescent protein tagged. Thus, in HCV‐infected cells, CD2AP interacts with NS5A. More important, levels of CD2AP were consistently up‐regulated in infected cells compared to mock‐infected cells (Fig. 1B).
Domain III of NS5A Interacts with SH3 Domain of CD2AP
To investigate which domain bound NS5A, a panel of FLAG‐tagged CD2AP mutants was generated (Fig. 1E) and coexpressed with hemagglutinin (HA)‐tagged NS5A in 293T cells. By co‐immunoprecipitation (Co‐IP), CD2AP containing at least one SH3 domain was able to bind NS5A, but CD2AP mutant lacking all three SH3 domains did not (Fig. 1E). NS5A contains an N‐terminal amphipathic helix, three domains (I, II, and III), separated by two low‐complexity sequences.19 We generated a series of NS5A mutants and found that when domain III of NS5A was deleted, it failed to bind CD2AP (Fig. 1F). Therefore, domain III of NS5A can bind the SH3 domains of CD2AP.
CD2AP Participates in the Transport of NS5A to LD
To investigate the function of the binding between CD2AP and NS5A, we expressed an mCherry‐tagged full‐length CD2AP or CD2AP lacking all SH3 domains in Huh7.5.1 cells. After infecting these cells with HCV‐J399EM, we observed that full‐length CD2AP, but not truncated CD2AP, colocalized with NS5A (Fig. 2A). We then performed live cell tracking of the colocalized NS5A/CD2AP complex. The trajectory and velocity of the complex supported that CD2AP and NS5A indeed comigrated (Fig. 2B; Supporting Movie S1).
Figure 2.

CD2AP participates in the transport of NS5A to LD. (A) Huh7.5.1 cells expressing mCherry‐tagged full‐length CD2AP or SH3 domains deleted CD2AP (CD2AP:331‐639) were infected with HCV‐J399EM. At 48 hours, live cell tracking of CD2AP (red) and NS5A (green) were performed using confocal microscopy. (B) Velocity analysis of the colocalized NS5A/CD2AP complex shown in (A) (square 1). (C) Huh7.5.1 cells expressing mCherry‐tagged CD2AP were infected with HCV‐J399EM for 48 hours and then treated with 1 μg/mL of cytochalacin B or 10 μM of colchicine for 1 hours; or after 1 hour of drug treatment, culture media were replaced with fresh media without drugs for an additional 4 hours and cells were subjected to confocal observation. (D) Velocity analysis of the colocalized NS5A/CD2AP dot shown in (C) (square 3) after colchicine treatment. (E) Effect of CD2AP silencing on the association of NS5A with LDs in Con1 cells. Subgenomic replicon Con1 cells were transiently transduced with CD2AP sh‐RNA (c4#, c6#) or control sh‐RNA (NC). LD fractions were isolated as described in the Materials and Methods. Quantification of NS5A level was analyzed by Image J software (NIH, Bethesda, MD). ADRP and calnexin served as markers for LD and ER, respectively. Abbreviations: ADRP, adipose differentiation‐related protein; shRNA, short hairpin RNA.
HCV particles travel along actin filaments.20 Motility of CD2AP in podocytes depends on actin polymerization.21 Others have reported that transport of the HCV NS5A to LDs depend on microtubules.12, 17, 22 To address whether cotransport of NS5A and CD2AP was actin or microtubule dependent, we cultured HCV‐infected cells with either cytochalacin B (an actin polymerization inhibitor) or colchicine (a microtubulin polymerization inhibitor). Live cell tracking of NS5A and CD2AP showed that cytochalacin B reduced the colocalization of NS5A and CD2AP (Fig. 2C). However, colchicine did not reduce the colocalization, but blocked their co‐movement (Fig. 2D; Supporting Movie S2). Four hours after removing cytochalacin B, colocalization of CD2AP and NS5A was restored (Fig. 2C). However, removal of colchicine did not restore NS5A/CD2AP comigration (movie not shown). These results suggest that NS5A and CD2AP colocalization is actin dependent and cytochalacin B treatment is reversible. Co‐movement of the NS5A/CD2AP complex is microtubule dependent and colchicine treatment is irreversible.
Next, we investigated whether CD2AP participated in transport of NS5A to LD. We established two CD2AP‐silenced Con1 cell lines (Supporting Fig. S2, c4# and c6#). Con1 cells support the subgenomic replication of HCV RNA, but do not support HCV assembly and production of virus particles.23 Silencing CD2AP did not affect the total level of NS5A, but reduced the association of NS5A with fractionated LDs (Fig. 2E). Purity of LDs was confirmed by the absence of calnexin, a marker for endoplasmic reticulum (ER), and the presence of adipose differentiation‐related protein, a marker for LDs (Fig. 2E). Thus, these results suggest that binding between NS5A and CD2AP is actin polymerization dependent and NS5A/CD2AP complex may be transported to LDs in a microtubule‐dependent manner.
Silencing CD2AP Reduces the Level of LDs
Because down‐regulation of CD2AP diminished NS5A association with LDs in Con1 cells, we next investigated whether the phenomenon could be observed in Huh7.5.1 cells infected with HCV by generating two stably CD2AP‐silenced cell lines (Supporting Fig. S3A, 4# and 6#). Immunofluorescent staining showed that less NS5A was found on LDs in CD2AP‐silenced cells after infection with HCV (Fig. 3A). Surprisingly, levels of LDs were also reduced after CD2AP silencing (Fig. 3A). To investigate whether LD levels are enhanced by CD2AP expression or simply attributed to HCV infection, we stained LDs in those cells without HCV infection. We found that the level of LDs was reduced in CD2AP‐silenced cells treated with or without oleic acid (OA), which can stimulate LD formation by activating the long‐chain fatty acid receptor, free fatty acid receptor 4 (Fig. 3B).24 To prove there is a functional interplay between CD2AP and LD accumulation, we reintroduced HA‐tagged CD2AP back into CD2AP‐silenced cells (Supporting Fig. S3B). CD2AP‐rescued cells (6#‐res) had more LDs than control (6#‐NC; Fig. 3C). Therefore, in addition to targeting HCV components to LDs, CD2AP also plays a role in boosting LD level.
Figure 3.
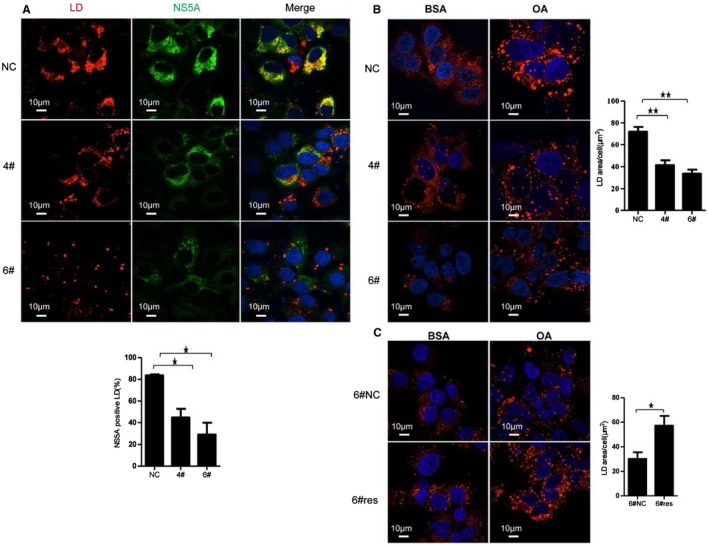
CD2AP down‐regulation affects LD accumulation. (A) Effects of CD2AP silencing on the association of NS5A with LDs under HCV JFH‐1 infection. CD2AP down‐regulated (4#, 6#) and control (NC) Huh7.5.1 cells were infected with JFH‐1 for 72 hours and stained for LDs using HCS LipidTOX Deep Red neutral lipid stains. Nuclei were counterstained with DAPI. Quantification of NS5A‐positive LDs is shown in diagram. (B,C) Effect of CD2AP silencing (B) and CD2AP rescuing (C) on LD accumulation. CD2AP silenced‐cells (6#) were rescued with HA‐tagged CD2AP (6#res) or empty vector (6#NC). Silenced (6#) and rescued (6#res) cells were treated with BSA alone or with 0.5 mM of OA‐BSA complexes for 16 hours and then stained for LD. Quantification of LDs area in single cell after OA stimulation was analyzed by Volocity software and is shown in diagram. Experiments were repeated three times. A two‐tailed Student t test was used for statistical analysis. * P < 0.05; ** P < 0.01. Abbreviations: BSA, bovine serum albumin; DAPI, 4’,6‐diamidino‐2‐phenylindole.
CD2AP Increases Insulin Receptor Substrate 1 Ubiquitination by Engaging Casitas B‐Lineage Lymphoma (b) E3 Ubiquitin Ligases
We then investigated the mechanism of CD2AP regulating LD accumulation. Level of LDs is modulated by insulin signaling.25, 26 To study whether CD2AP boosted LD level through insulin signaling, we detected the expression of insulin receptor and insulin receptor substrate 1 (IRS1) in CD2AP‐silenced cells. We found that levels of total IRS1, but not total insulin receptor, were obviously up‐regulated (Fig. 4A). However, there was no difference for IRS1 mRNA levels between control and CD2AP‐silenced cells (Supporting Fig. S4A). Hence, expression of IRS1 is likely regulated at the protein level. We found that after 2 hours of treatment with proteasome degradation inhibitor MG132, but not other inhibitors, such as NH4Cl/3‐methyladenine/chloroquine, level of IRS1 was increased (Supporting Fig. S4B). These results suggest that IRS1 stability may be regulated by protein ubiquitination. Furthermore, MG132 treatment increased much more IRS1 in wild‐type cells than in CD2AP‐scilenced cells (Fig. 4B). These results implicate that CD2AP down‐regulation may diminish IRS1 ubiquitination. To prove this hypothesis, we purified a similar amount of IRS1 from CD2AP‐silenced and control cells, and found that CD2AP down‐regulated cells indeed showed less ubiquitination (Fig. 4C). Thus, CD2AP affects IRS1 level by modulating its ubiquitination. However, we could not exclude the possibility that some IRS1 might be degraded in a ubiquitin‐independent manner.
Figure 4.
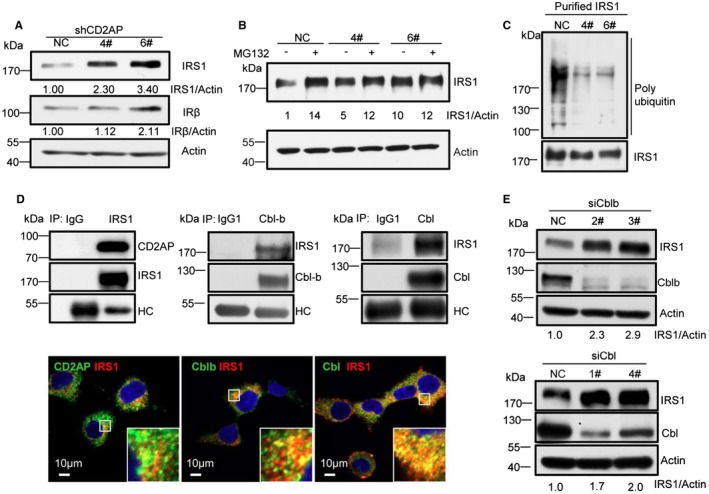
CD2AP increases IRS ubiquitination by engaging Cbl/Cbl‐b E3 ubiquitin ligases. (A) Effects of CD2AP silencing on IRS1 after HCV JFH‐1 infection for 72 hours. (B) Effect of MG132 treatment (10 μM, 2 hours) on IRS1 in CD2AP‐silenced cells. (C) Effect of CD2AP silencing on ubiquitination of IRS1. Cell lysates were purified with anti‐IRS1 antibody. Purified IRS1 was adjusted to the similar amount and then immunoblotted with antibodies against polyubiquitin or IRS1. (D) Co‐IP and colocalization of IRS1 with CD2AP, Cbl‐b, or Cbl. Huh7.5.1 cell lysates were purified with anti‐IRS1, anti‐Cbl‐b, or anti‐Cbl antibodies. The immunoprecipitation complex was immunoblotted with specific antibodies. Heavy chain (HC) served as the loading control. (E) Effects of Cbl‐b or Cbl silencing on IRS1 expression. Huh7.5.1 cells were transfected with 30 nM of siRNA specific to Cbl‐b or Cbl or control siRNA for 48 hours. Quantification was analyzed by ImageJ software (NIH, Bethesda, MD). Abbreviation: siRNA, small interfering RNA.
We then investigated how CD2AP regulated IRS1 ubiquitination. In Huh7.5.1 cells, IRS1 copurified and colocalized with CD2AP (Fig. 4D). Because IRS1 is a client of several E3 ubiquitin ligases27, 28 and CD2AP is known to interact with Cbl family E3 ligases,29, 30 we then investigated whether IRS1 interacted with casitas B‐lineage lymphoma (b) (Cbl/Cbl‐b) E3 ligases. We found that Cbl/Cbl‐b copurified and colocalized with IRS1 (Fig. 4D). To address whether Cbl/Cbl‐b ubiquitinated IRS1, we silenced Cbl/Cbl‐b in Huh7.5.1 cells. Accordingly, levels of IRS1 were up‐regulated (Fig. 4E). Thus, CD2AP promotes IRS1 ubiquitination and degradation by engaging Cbl/Cbl‐b E3 ligases.
CD2AP Disrupts IRS1 Signaling to Boost LD Level
Because CD2AP promotes IRS1 degradation, we then investigated whether CD2AP influenced LD formation by the IRS1 signaling pathway, which affects lipid metabolism through the IRS1/phosphatidylinositol 3‐kinase (PI3K)/protein kinase B (Akt) axis.31, 32 In CD2AP‐silenced cells, the level of phosphorylated (p)‐Akt (S473), but not p‐Erk (extracellular signal‐regulated kinase) was increased (Fig. 5A). Akt is a negative regulator of adenosine monophosphate kinase (AMPK).33 Then, we blotted for AMPK and found that level of p‐AMPK (T172) was reduced in CD2AP‐silenced cells (Fig. 5A). Activation of AMPK regulates many enzymes in lipid metabolism, such as acetyl‐CoA carboxylases 1 and 2 (ACC1/2), adipose triglyceride lipase (ATGL), sterol regulatory element‐binding protein 1 (SREBP‐1), and hormone‐sensitive lipase (HSL).34, 35 Binding of HSL to p‐perilipin A on the surface of LD causes hydrolysis of LDs.36 AMPK phosphorylates S554, inactivating the lipase activity of HSL.37 We found that levels of p‐HSL (S554), a marker of HSL inactivation, were reduced in CD2AP‐silenced cells (Fig. 5A). Furthermore, silencing CD2AP did not affect other proteins involved in lipid metabolism, such as p‐ACC1/2, ACC1/2, SREBP1, and ATGL (Supporting Fig. S5). To confirm that HSL (S554) is phosphorylated by AMPK, we treated cells with dorsomorphin, an AMPK inhibitor. Dorsomorphin reduced levels of p‐AMPK (T172) and p‐HSL (S554; Fig. 5B). To further prove that CD2AP disrupts IRS1 signaling by the PI3K‐Akt pathway, we reintroduced CD2AP into CD2AP‐silenced cells; the level of p‐Akt (S473) was reduced (Fig. 5C, compare lane 3 to lane 4). Considering that CD2AP functionally rescued p‐Akt (Fig. 5C) and LD levels (Fig. 3C) when reintroduced into CD2AP‐silenced cells, these results provided strong evidences that enhanced CD2AP affects lipid metabolism by the IRS1‐Akt‐AMPK‐HSL axis, causing inactivation of HSL to increase LD accumulation.
Figure 5.

CD2AP regulates LD accumulation by the IRS1‐Akt‐AMPK‐HSL axis. (A) Effects of CD2AP silencing on Akt‐AMPK‐HSL axis. (B) Effect of dorsomorphin (an inhibitor for AMPK) treatment on p‐AMPK (T172) and p‐HSL (S554) levels. CD2AP down‐regulated (4# & 6#) and control (NC) cells were cultured in complete medium for 48 hours and then treated with DMSO or dorsomorphin (5μM) for 4 hours. (C) Effect of CD2AP rescuing on p‐Akt expression in CD2AP‐rescuing cells. Abbreviation: DMSO, dimethyl sulfoxide.
CD2AP Silencing Inhibits HCV Propagation Independent of Virus Entry, Subgenomic Replication, and Internal Ribosomal Entry Site‐Dependent Translation
Because silencing CD2AP affects LD accumulation and NS5A transport to LDs, we posited that CD2AP down‐regulation should affect HCV propagation. First, we infected CD2AP‐silenced Huh7.5.1 cells with HCV‐JFH1 and found that CD2AP down‐regulation did not affect cell viability (Supporting Fig. S6A), but reduced intracellular total HCV‐RNA level, protein level, and supernatant RNA copy numbers (Fig. 6A), and the reduction seems to be correlated with level of CD2AP reduction. In addition, silencing CD2AP also decreased the JFH1‐Luc‐5AGFP reporter virus activity (Fig. 6B) and CD2AP‐rescued cells (6#‐res) could recover HCV‐RNA and protein level (Fig. 6C). Thus, CD2AP indeed regulates HCV propagation.
Figure 6.

Silencing CD2AP inhibits HCV propagation. (A) Effects of CD2AP silencing on intracellular HCV‐RNA level, NS5A and core protein level, and supernatant HCV‐RNA copy number. CD2AP down‐regulated (4#, 6#) and control (NC) Huh 7.5.1 cells were infected with HCV JFH1 for 72 hours. Total intracellular HCV RNAs were extracted and subjected for quantitative PCR. Total cell lysates were immunoblotted for CD2AP, HCV NS5A, and core. Supernatant HCV RNA was extracted as described in the Materials and Methods and detected by quantitative PCR. (B) Effect of CD2AP down‐regulation on HCV reporter virus JFH1‐Luc‐5AGFP. CD2AP down‐regulated (4#, 6#) and control (NC) cells were infected with a reporter virus JFH1‐Luc‐5AGFP with a Renila luciferase gene. Luciferase activities were measured 72 hours postinfection. (C) Effect of CD2AP rescuing on intracellular HCV RNA and protein level. CD2AP‐rescued cells (6#res) and control cells (6#NC) were infected with HCV JFH1. Intracellular HCV RNA levels were detected by quantitative PCR, and cell lysates were immunoblotted with CD2AP, core, and NS5A antibodies 72 hours postinfection. (D) Effect of CD2AP silencing on intracellular and supernatant HCV titers. CD2AP down‐regulated (4#, 6#) and control (NC) cells were infected with J399EM (MOI=1) for 72 hours. Cell pellet and culture supernatant were quantified for intracellular and extracellular virus titers as described in the Materials and Methods. (E) CD2AP down‐regulated (4#, 6#) and control (NC) Huh 7.5.1 cells were infected with HCV J399EM for indicated time points (6, 12, 18, and 24 hours). Total intracellular HCV RNAs were quantified. Normalized intracellular HCV‐RNA level in control cells at 6 hours postinfection was defined as 1. Experiments were repeated three times. A two‐tailed Student t test was used for statistical analysis. Data were mean ± SEM. * P < 0.05; ** P < 0.01. Abbreviations: MOI, multiplicity of infection; h, hours.
We then tried to identify the step(s) affecting HCV replication after CD2AP silencing. We found that silencing CD2AP did not affect HCV entry (by pseudovirus assay; Supporting Fig. S6B), subgenomic replication in Con1 cells, which do not support HCV assembly (Supporting Fig. S6C and Fig. 2E), and HCV internal ribosomal entry site‐dependent translation (Supporting Fig. S6D). However, intracellular and supernatant HCV titers (Fig. 6D) were reduced in CD2AP‐silenced cells infected with JFH1. This suggested that CD2AP silencing impaired production of infectious virions in steps other than virus entry, subgenomic replication, and RNA translation. We further performed one single‐cycle assay to determine which step of HCV infection was affected by CD2AP silencing. We found that HCV could complete one single cycle between 12 and 18 hours postinfection (Supporting Fig. S7A) and CD2AP silencing significantly reduced intracellular HCV RNA 18 hours, but not 12 hours, postinfection (Fig. 6E). However, we did not detect NS5A protein expression until 24 hours postinfection (Supporting Fig. S7B), probably attributed to low sensitivity of immunoblotting. These results, together with the observation that less LD accumulation and less NS5A was found on LDs after CD2AP silencing (Fig. 3), supported that HCV assembly might be impaired in CD2AP‐silenced cells. However, it is also possible that steps other than HCV assembly are also impacted by CD2AP down‐regulation. Thus, HCV infection increased CD2AP expression to enhance HCV propagation.
CD2AP Up‐Regulation Correlates with Steatosis in an Animal Model and in Human Biopsies
HCV is known to cause steatosis, and CD2AP is up‐regulated in HCV‐infected cells and enhanced CD2AP could stimulate LD accumulation, a requirement for steatosis. We then investigated whether steatosis and CD2AP up‐regulation could be observed in a human CD81 and occludin transgenic ICR mouse model.15 Based on liver and blood HCV‐RNA copy number, the first week after HCV infection represented the acute infection stage (Fig. 7A). At this time, there was little CD2AP staining in the liver (Fig. 7B). In contrast, CD2AP expression became highly noticeable from the first to fourth month during the chronic infection stage, when lipids began to accumulate and steatosis was evident (Fig. 7B, arrows indicate steatosis). Thus, up‐regulation of CD2AP correlates with manifestation of steatosis.
Figure 7.

CD2AP up‐regulation correlates with steatosis in an animal model and in human biopsies. Human CD81 and occludin transgenic ICR mice were infected with HCV J399EM. HCV‐RNA copy number in liver and serum (A) and IHC staining of CD2AP in liver sections (B) were determined at the indicated time points postinfection. Steatosis is shown by Oil Red O staining (arrows indicate steatosis at 1, 2, and 4 months postinfection). Scale bar, 50 μm. (C) Representative IHC staining of CD2AP in human liver biopsies without HCV infection (HCV–) or with HCV infection (HCV+; arrows indicate steatosis). (D) CD2AP expression in peritumor of human liver biopsies without HCV infection (n = 12 cases), or with HCV infection (n = 66 cases); or with HCV infection showing steatosis (n = 17 cases), or CD2AP expression in tumor of HCV‐positive human liver biopsies (n = 53 cases). Quantification was analyzed by Pannoramic viewer software and is shown in scatter plot. A two‐tailed Student t test was used for statistical analysis. Data are mean ± SEM. * P < 0.05; ** P < 0.01; *** P < 0.001. Abbreviations: d, day; w, week; m, month.
Finally, we stained 72 liver biopsies from HCV‐infected patients and 12 liver biopsies from non‐HCV‐infected controls for CD2AP. We found CD2AP immunohistochemistry (IHC) staining was faint or undetectable in most of the non‐HCV‐infected controls, whereas most of the 72 HCV‐infected biopsies showed positive CD2AP staining (Fig. 7C,D). Most important, HCV‐infected biopsies showing only steatosis or HCC also showed stronger CD2AP staining than non‐HCV‐infected hepatocytes (Fig. 7D). Thus, HCV infection activated CD2AP expression in the mouse model and human subjects, and the up‐regulation correlates well with liver steatosis (LS).
Discussion
Liver pathologies, such as steatosis, are affected by many factors.38, 39, 40 Here, we provide insights into the propagation of HCV and steatosis caused by chronic HCV infection. We identify a host protein, CD2AP, as being stimulated by HCV infection and pivotal in HCV propagation and lipid metabolism. CD2AP participates in cytoskeleton reorganization and trafficking of cellular organelles and vesicles.18, 21 In HCV‐infected cells, the SH3 domain of CD2AP binds domain III of NS5A (Fig. 1). Binding of CD2AP to NS5A delivers NS5A toward LDs for HCV assembly. We posit that during HCV assembly, trafficking of the CD2AP/NS5A complex to LDs is a two‐step process. First, CD2AP meets NS5A in an actin‐filament–dependent manner. Subsequently, NS5A is transported to LDs through the microtubule (Fig. 2). At this time, the molecular mechanism mediating these two steps is unknown. Given that CD2AP can bind small G‐coupled proteins that are important in vesicle formation and migration,41 it is likely that additional host proteins, such as motor proteins and small GTPases, are involved in the transport process.
Unexpectedly, CD2AP also regulates the levels of LDs. In HCV‐infected cells, CD2AP modulates the activity of IRS1 by securing Cbl/Cbl‐b E3 ligases, enhancing IRS1 ubiquitination, and augmenting IRS1 degradation by the proteasome (Fig. 4), which then regulates the Akt‐AMPK‐HSL signaling axis. Accordingly, levels of LDs, IRS1, and p‐Akt are correlated with CD2AP (Figs. 3, 4, 5, 6).
When CD2AP is silenced, production of infectious HCV particles is also decreased (Fig. 6D). We postulate that reduction of infectious HCV particles is attributed to diminished transport of NS5A to LDs and reduced levels of LDs for virus assembly (Figs. 2 and 3). This hypothesis is supported by the observation that when CD2AP was rescued, production of HCV was also restored (Fig. 6C).
In an HCV infection transgenic ICR mouse model, levels of HCV RNA were detected in liver and serum of infected mice 2 days postinfection (Fig. 7A). However, hepatocyte CD2AP staining in these mice did not appear until much later, at around 1 month postinfection, a time when steatosis began to appear (Fig. 7B). Thus, CD2AP up‐regulation may contribute to steatosis. In cells, up‐regulation of CD2AP occurs within days, but in infected animals, this up‐regulation can only be observed at the chronic stage of infection. The reason for this difference is not known. One possibility is that in the cell model, the hepatoma cells already express high levels of CD2AP, whereas the normal hepatocyte has no detectable CD2AP. Titers of the HCV used for in vitro infection and in vivo infection may also contribute to the difference. Furthermore, immunoblotting is more sensitive than IHC staining; a slight increase in CD2AP level may escape detection by immunostaining.
In human liver biopsies, only 2 of the 12 noninfected control tissues showed discernable CD2AP expression (Fig. 7D), whereas most of the HCV‐infected peritumor biopsies showed positive CD2AP staining. The reason why some of the biopsies from HCV‐infected individuals are CD2AP negative is not clear at this time. These patients may express CD2AP that is beyond the detection limit of IHC, or they are at an earlier stage of infection. Most important, CD2AP expression is also significantly higher in liver biopsies with steatosis than in HCV‐negative liver biopsies, further proving that CD2AP may contribute to steatosis (Fig. 7D).
In summary, we propose a model in which CD2AP regulates HCV propagation and steatosis (Fig. 8). HCV infection up‐regulates CD2AP to facilitate HCV propagation by distinct methods: On one hand, CD2AP binds NS5A by actin to form a complex that is then transported to LDs in a microtubule‐dependent manner. On the other hand, CD2AP recruits Cbl/Cbl‐b E3 ligases to promote the ubiquitination and degradation of IRS1, which causes a decrease in p‐Akt, a negative regulator of AMPK. When p‐Akt is reduced, the level of p‐AMPK is increased. An increase in p‐AMPK promotes phosphorylation and inactivation of HSL. Inactivation of HSL reduces LD hydrolysis, boosting LD levels, providing more hubs for HCV assembly. At present, we cannot exclude other possible ways in which CD2AP might affect HCV propagation. In the HCV‐infected mouse model and human subjects, CD2AP expression is up‐regulated, and this up‐regulation correlates well with LS. Thus, HCV infection‐induced CD2AP expression results in a vicious cycle for HCV infection. However, how the vicious cycle is blocked by host responses remains to be investigated. Finally, the interplays between HCV infection, steatosis, and CD2AP expression are complicated. Elucidating these interplays will require studying a much larger cohort of patients as well as an additional animal model.
Figure 8.

Proposed model for CD2AP regulating HCV propagation and steatosis. HCV infection up‐regulates CD2AP level, which binds NS5A in an actin‐dependent manner and then NS5A is transported to LDs by the microtubule. Moreover, CD2AP recruits Cbl/Cbl‐b E3 ligases to promotes ubiquitination and degradation of IRS‐1 to damp insulin signaling and thus preventing LDs hydrolysis to accommodate viral propagation. In the HCV‐infected mouse model and human subjects, CD2AP up‐regulation correlates well with LS.
Although our study has added details into the biology of the HCV life cycle and liver pathology, many important questions remain to be explored. For example, how is CD2AP up‐regulated by HCV infection? Does the detection of CD2AP have any prognostic values in HCV‐infected patients? Furthermore, systematic studies of other already identified proteins will impart additional details to our understanding of HCV biology. Likewise, using a different HCV‐encoded protein as the “bait” in the BioID approach, we may identify additional host proteins that are important in the HCV life cycle. Finally, a myriad of studies suggested that lowering of IRS1 level contributed to insulin resistance in type II diabetes.42 Our finding that CD2AP regulates IRS‐1 turnover may provide a potential therapeutic target to treat type 2 diabetes, in addition to curtailing HCV‐associated pathology.
Supported by the “Personalized Medicines—Molecular Signature‐based Drug Discovery and Development”, Strategic Priority Research Program of the Chinese Academy of Sciences (XDA12010309), by National Key R&D Program of China (2018YFA0507201), by the National Basic Research Priorities Program of China (No. 2013CB911102), and by the National Natural Science Foundation of China (31670170).
Potential conflict of interest
Nothing to report.
Supporting information
Acknowledgments
We thank Professors Xulin Chen and Rongge Yang (Chinese Academy of Sciences) for JFH1‐Luc‐5AGFP virus stocks and pNL4.3.lucRE, pcDNA3.1‐E1E2 plasmids; Professor Cunyi Zheng (Wuhan University) for HCV NS5A plasmid; and Professor Charles M. Rice (Rockefeller University, Sacramento, CA) for NS5A (9E10) antibody. We also thank The Core Facility and Technical Support, Wuhan Institute of Virology for technique support (Dr. Ding Gao for Confocal; Ms. Juan Min for flow cytometry).
References
Author names in bold designate shared co‐first authorship.
- 1. Webster DP, Klenerman P, Dusheiko GM. Hepatitis C. Lancet 2015;385:1124‐1135. [DOI] [PMC free article] [PubMed] [Google Scholar]
- 2. Arora P, Basu A, Schmidt ML, Clark GJ, Donninger H, Nichols DB, et al. Nonstructural protein 5B promotes degradation of the NORE1A tumor suppressor to facilitate hepatitis C virus replication. Hepatology 2017;65:1462‐1477. [DOI] [PMC free article] [PubMed] [Google Scholar]
- 3. Wilkins C, Woodward J, Lau DT, Barnes A, Joyce M, McFarlane N, et al. IFITM1 is a tight junction protein that inhibits hepatitis C virus entry. Hepatology 2013;57:461‐469. [DOI] [PMC free article] [PubMed] [Google Scholar]
- 4. Stone AE, Giugliano S, Schnell G, Cheng L, Leahy KF, Golden‐Mason L, et al. Hepatitis C virus pathogen associated molecular pattern (PAMP) triggers production of lambda‐interferons by human plasmacytoid dendritic cells. PLoS Pathog 2013;9:e1003316. [DOI] [PMC free article] [PubMed] [Google Scholar]
- 5. Welte MA. Expanding roles for lipid droplets. Curr Biol 2015;25:R470‐R481. [DOI] [PMC free article] [PubMed] [Google Scholar]
- 6. Walther TC, Farese RV Jr. Lipid droplets and cellular lipid metabolism. Annu Rev Biochem 2012;81:687‐714. [DOI] [PMC free article] [PubMed] [Google Scholar]
- 7. Romero‐Brey I, Merz A, Chiramel A, Lee JY, Chlanda P, Haselman U, et al. Three‐dimensional architecture and biogenesis of membrane structures associated with hepatitis C virus replication. PLoS Pathog 2012;8:e1003056. [DOI] [PMC free article] [PubMed] [Google Scholar]
- 8. Ferraris P, Beaumont E, Uzbekov R, Brand D, Gaillard J, Blanchard E, Roingeard P. Sequential biogenesis of host cell membrane rearrangements induced by hepatitis C virus infection. Cell Mol Life Sci 2013;70:1297‐1306. [DOI] [PMC free article] [PubMed] [Google Scholar]
- 9. Li Q, Pene V, Krishnamurthy S, Cha H, Liang TJ. Hepatitis C virus infection activates an innate pathway involving IKK‐alpha in lipogenesis and viral assembly. Nat Med 2013;19:722‐729. [DOI] [PMC free article] [PubMed] [Google Scholar]
- 10. Miyanari Y, Atsuzawa K, Usuda N, Watashi K, Hishiki T, Zayas M, et al. The lipid droplet is an important organelle for hepatitis C virus production. Nat Cell Biol 2007;9:1089‐1097. [DOI] [PubMed] [Google Scholar]
- 11. Shi ST, Polyak SJ, Tu H, Taylor DR, Gretch DR, Lai MM. Hepatitis C virus NS5A colocalizes with the core protein on lipid droplets and interacts with apolipoproteins. Virology 2002;292:198‐210. [DOI] [PubMed] [Google Scholar]
- 12. Eyre NS, Fiches GN, Aloia AL, Helbig KJ, McCartney EM, McErlean CS, et al. Dynamic imaging of the hepatitis C virus NS5A protein during a productive infection. J Virol 2014;88:3636‐3652. [DOI] [PMC free article] [PubMed] [Google Scholar]
- 13. Roux KJ, Kim DI, Raida M, Burke B. A promiscuous biotin ligase fusion protein identifies proximal and interacting proteins in mammalian cells. J Cell Biol 2012;196:801‐810. [DOI] [PMC free article] [PubMed] [Google Scholar]
- 14. Edwards M, Zwolak A, Schafer DA, Sept D, Dominguez R, Cooper JA. Capping protein regulators fine‐tune actin assembly dynamics. Nat Rev Mol Cell Biol 2014;15:677‐689. [DOI] [PMC free article] [PubMed] [Google Scholar]
- 15. Chen J, Zhao Y, Zhang C, Chen H, Feng J, Chi X, et al. Persistent hepatitis C virus infections and hepatopathological manifestations in immune‐competent humanized mice. Cell Res 2014;24:1050‐1066. [DOI] [PMC free article] [PubMed] [Google Scholar]
- 16. Tan SL, Nakao H, He Y, Vijaysri S, Neddermann P, Jacobs BL, et al. NS5A, a nonstructural protein of hepatitis C virus, binds growth factor receptor‐bound protein 2 adaptor protein in a Src homology 3 domain/ligand‐dependent manner and perturbs mitogenic signaling. Proc Natl Acad Sci U S A 1999;96:5533‐5538. [DOI] [PMC free article] [PubMed] [Google Scholar]
- 17. Lai CK, Jeng KS, Machida K, Lai MM. Association of hepatitis C virus replication complexes with microtubules and actin filaments is dependent on the interaction of NS3 and NS5A. J Virol 2008;82:8838‐8848. [DOI] [PMC free article] [PubMed] [Google Scholar]
- 18. Tang VW, Brieher WM. FSGS3/CD2AP is a barbed‐end capping protein that stabilizes actin and strengthens adherens junctions. J Cell Biol 2013;203:815‐833. [DOI] [PMC free article] [PubMed] [Google Scholar]
- 19. Tellinghuisen TL, Marcotrigiano J, Gorbalenya AE, Rice CM. The NS5A protein of hepatitis C virus is a zinc metalloprotein. J Biol Chem 2004;279:48576‐48587. [DOI] [PubMed] [Google Scholar]
- 20. Coller KE, Berger KL, Heaton NS, Cooper JD, Yoon R, Randall G. RNA interference and single particle tracking analysis of hepatitis C virus endocytosis. PLoS Pathog 2009;5:e1000702. [DOI] [PMC free article] [PubMed] [Google Scholar]
- 21. Welsch T, Endlich N, Gökce G, Doroshenko E, Simpson JC, Kriz W, et al. Association of CD2AP with dynamic actin on vesicles in podocytes. Am J Physiol Renal Physiol 2005;289:F1134‐F1143. [DOI] [PubMed] [Google Scholar]
- 22. Lai CK, Saxena V, Tseng CH, Jeng KS, Kohara M, Lai MM. Nonstructural protein 5A is incorporated into hepatitis C virus low‐density particle through interaction with core protein and microtubules during intracellular transport. PLoS One 2014;9:e99022. [DOI] [PMC free article] [PubMed] [Google Scholar]
- 23. Blight KJ, McKeating JA, Rice CM. Highly permissive cell lines for subgenomic and genomic hepatitis C virus RNA replication. J Virol 2002;76:13001‐13014. [DOI] [PMC free article] [PubMed] [Google Scholar]
- 24. Rohwedder A, Zhang Q, Rudge SA, Wakelam MJ. Lipid droplet formation in response to oleic acid in Huh‐7 cells is mediated by the fatty acid receptor FFAR4. J Cell Sci 2014;127:3104‐3115. [DOI] [PubMed] [Google Scholar]
- 25. Mashek DG, Khan SA, Sathyanarayan A, Ploeger JM, Franklin MP. Hepatic lipid droplet biology: Getting to the root of fatty liver. Hepatology 2015;62:964‐967. [DOI] [PMC free article] [PubMed] [Google Scholar]
- 26. Bernaert D, Wanson JC, Drochmans P, Popowski A. Effect of insulin on ultrastructure and glycogenesis in primary cultures of adult rat hepatocytes. J Cell Biol 1977;74:878‐900. [DOI] [PMC free article] [PubMed] [Google Scholar]
- 27. Xu X, Keshwani M, Meyer K, Sarikas A, Taylor S, Pan ZQ. Identification of the degradation determinants of insulin receptor substrate 1 for signaling cullin‐RING E3 ubiquitin ligase 7‐mediated ubiquitination. J Biol Chem 2012;287:40758‐40766. [DOI] [PMC free article] [PubMed] [Google Scholar]
- 28. Kawaguchi T, Yoshida T, Harada M, Hisamoto T, Nagao Y, Ide T, et al. Hepatitis C virus down‐regulates insulin receptor substrates 1 and 2 through up‐regulation of suppressor of cytokine signaling 3. Am J Pathol 2004;165:1499‐1508. [DOI] [PMC free article] [PubMed] [Google Scholar]
- 29. Kirsch KH, Georgescu MM, Shishido T, Langdon WY, Birge RB, Hanafusa H. The adapter type protein CMS/CD2AP binds to the proto‐oncogenic protein c‐Cbl through a tyrosine phosphorylation‐regulated Src homology 3 domain interaction. J Biol Chem 2001;276:4957‐4963. [DOI] [PubMed] [Google Scholar]
- 30. Ceregido MA, Garcia‐Pino A, Ortega‐Roldan JL, Casares S, Lopez Mayorga O, Bravo J, et al. Multimeric and differential binding of CIN85/CD2AP with two atypical proline‐rich sequences from CD2 and Cbl‐b*. FEBS J 2013;280:3399‐3415. [DOI] [PubMed] [Google Scholar]
- 31. Saltiel AR, Kahn CR. Insulin signalling and the regulation of glucose and lipid metabolism. Nature 2001;414:799‐806. [DOI] [PubMed] [Google Scholar]
- 32. Boucher J, Kleinridders A, Kahn CR. Insulin receptor signaling in normal and insulin‐resistant states. Cold Spring Harb Perspect Biol 2014;6 pii: a009191. 10.1101/cshperspect.a009191. [DOI] [PMC free article] [PubMed] [Google Scholar]
- 33. Hahn‐Windgassen A, Nogueira V, Chen CC, Skeen JE, Sonenberg N, Hay N. Akt activates the mammalian target of rapamycin by regulating cellular ATP level and AMPK activity. J Biol Chem 2005;280:32081‐32089. [DOI] [PubMed] [Google Scholar]
- 34. Mihaylova MM, Shaw RJ. The AMPK signalling pathway coordinates cell growth, autophagy and metabolism. Nat Cell Biol 2011;13:1016‐1023. [DOI] [PMC free article] [PubMed] [Google Scholar]
- 35. Steinberg GR, Kemp BE. AMPK in health and disease. Physiol Rev 2009;89:1025‐1078. [DOI] [PubMed] [Google Scholar]
- 36. Sztalryd C, Xu G, Dorward H, Tansey JT, Contreras JA, Kimmel AR, Londos C. Perilipin A is essential for the translocation of hormone‐sensitive lipase during lipolytic activation. J Cell Biol 2003;161:1093‐1103. [DOI] [PMC free article] [PubMed] [Google Scholar]
- 37. Daval M, Diot‐Dupuy F, Bazin R, Hainault I, Viollet B, Vaulont S, et al. Anti‐lipolytic action of AMP‐activated protein kinase in rodent adipocytes. J Biol Chem 2005;280:25250‐25257. [DOI] [PubMed] [Google Scholar]
- 38. Wang XA, Zhang R, She ZG, Zhang XF, Jiang DS, Wang T, et al. Interferon regulatory factor 3 constrains IKKbeta/NF‐kappaB signaling to alleviate hepatic steatosis and insulin resistance. Hepatology 2014;59:870‐885. [DOI] [PubMed] [Google Scholar]
- 39. Gonzalez‐Reimers E, Quintero‐Platt G, Rodriguez‐Gaspar M, Aleman‐Valls R, Perez‐Hernandez O, Santolaria‐Fernandez F. Liver steatosis in hepatitis C patients. World J Hepatol 2015;7:1337‐1346. [DOI] [PMC free article] [PubMed] [Google Scholar]
- 40. Noureddin M, Wright EC, Alter HJ, Clark S, Thomas E, Chen R, et al. Association of IL28B genotype with fibrosis progression and clinical outcomes in patients with chronic hepatitis C: a longitudinal analysis. Hepatology 2013;58:1548‐1557. [DOI] [PMC free article] [PubMed] [Google Scholar]
- 41. Cormont M, Meton I, Mari M, Monzo P, Keslair F, Gaskin C, et al. CD2AP/CMS regulates endosome morphology and traffic to the degradative pathway through its interaction with Rab4 and c‐Cbl. Traffic 2003;4:97‐112. [DOI] [PubMed] [Google Scholar]
- 42. Anai M, Funaki M, Ogihara T, Terasaki J, Inukai K, Katagiri H, et al. Altered expression levels and impaired steps in the pathway to phosphatidylinositol 3‐kinase activation via insulin receptor substrates 1 and 2 in Zucker fatty rats. Diabetes 1998;47:13‐23. [DOI] [PubMed] [Google Scholar]
Associated Data
This section collects any data citations, data availability statements, or supplementary materials included in this article.
Supplementary Materials