

Abstract
PTEN is a tumor suppressor gene inactivated in over 30% of human cancers. It encodes a lipid phosphatase that serves as a gatekeeper of the phosphoinositide 3‐kinase signaling pathway. Germline mutation frequently occurs in this gene in patients diagnosed with PTEN Hamartoma Tumor Syndrome (PHTS). PHTS individuals are characterized by macrocephaly, benign growth of multiple tissues and increased tumor risk. In addition, autistic phenotypes are found in 10–20% of individuals carrying the germline PTEN mutation with macrocephaly. In this report, 13 suspected PHTS patients were screened for mutation in the PTEN gene. A missense variant (c. 302T > C) substituting the isoleucine at codon 101 to a threonine, a single nucleotide insertion (c. 327‐328insC) causing a frame shift mutation and termination at codon 109, and a nonsense variant (c. 1003C > T) truncated the protein at codon 335 were identified. The I101T mutation significantly reduced PTEN protein expression levels by 2.5‐ to 4.0‐fold. Mechanistically, I101T reduced the protein half‐life of PTEN possibly due to enhanced polyubiquitination at Lysine 13. However, the I101T mutant retained almost 30% of the lipid phosphatase activity of the wild‐type protein. Finally, the I101T mutant has reduced phosphorylation at a PTEN auto‐dephosphorylation site at Threonine 366 and a lowered ratio of nuclear to cytosolic protein level. These partial losses of multiple PTEN biochemical functions may contribute to the tissue overgrowth and autistic features of this PHTS patient. Autism Res 2018, 11: 1098–1109. © 2018 The Authors Autism Research published by International Society for Autism Research and Wiley Periodicals, Inc.
Lay Summary
The genetics of autism spectrum disorders is highly complex with individual risk influenced by both genetic and environmental factors. Mutation in the human PTEN gene confers a high risk of developing autistic behavior. This report revealed that PTEN mutations occurred in 23% of a selected group of Hong Kong patients harboring autistic features with gross overgrowth symptoms. Detailed characterization of a PTEN mutation revealed reduced protein stability as one of the underlying mechanisms responsible for reduced PTEN activity.
Keywords: PTEN, PTEN hamartoma tumor syndrome, autism spectrum disorders, macrocephaly, Hong Kong
Introduction
The PTEN Hamartoma Tumor Syndrome (PHTS) is a collection of developmental disorders associated with the mutations in the human PTEN gene localized on chromosome 10q23 [Hansen‐Kiss et al., 2017]. PHTS encompasses previously described hamartoma conditions including Cowden syndrome (CS), Bannayan–Riley–Ruvalcaba syndrome, PTEN‐related Proteus syndrome, and Proteus‐like syndrome. PHTS is an autosomal dominant inherited disorder characterized by macrocephaly, hamartomatous overgrowth of multiple tissues and increased risk of developing cancers of the breast, thyroid, skin, and gastrointestinal tract. In fact, more than 90% of individuals with CS have clinical manifestations by the late second decade and have an 85% lifetime risk of developing breast cancer [Zbuk & Eng, 2007]. In terms of prevalence, it is suggested that the incidence of CS is approximately 1 in 200,000 [Nelen et al., 1999], and a combination of inheritance and de novo mutations in the PTEN gene accounts for some of the PHTS cases.
Germline mutation in the PTEN gene is found in approximately 20% of individuals diagnosed with autism/pervasive developmental disorder with macrocephaly [Butler et al., 2005]. Autism spectrum disorder (ASD) is a neurodevelopmental disorder with a median age at first diagnosis of 3.8 years of age [Christensen et al., 2016]. The majority (>80%) of ASD cases has no known genetic origin with affected individuals showing impaired social interactions, delayed speech development, and sensory hypersensitivity [De Rubeis & Buxbaum, 2015]. The clinical presentation of ASD is highly heterogeneous, as reflected in the genetic diversity of this disorder [Kleijer et al., 2014]. The prevailing view is that the majority of ASD risk is associated with the inheritance of common genetic variants, such as single nucleotide polymorphism or copy number variation. Only a small fraction of the risk is derived from rare de novo mutations [Gaugler et al., 2014]. Approximately 80% of ASD occurrences are sporadic and 20% are syndromic. Syndromic ASD patients have autistic features in addition to a multitude of pathologies associated with some well‐established neurodevelopmental syndromes such as Fragile X (FMR1), Rett (MECP2), Angelman (UBE3A), Phelan‐McDermid (SHANK3), and PHTS (PTEN) [O'Roak et al., 2012].
The human PTEN gene encodes a lipid phosphatase with specificity towards phosphatidylinositol (3,4,5) triphosphate (PIP3) [Parsons, 2004]. In human cancer, the loss of PTEN functions in epithelial cell types leads to high PIP3 levels, and this drives diverse protumorigenic pathways emulating a constitutively active phosphoinositide 3‐kinase (PI3‐K) [Song, Salmena, & Pandolfi, 2012]. The outcome of PTEN loss in neuronal cell types is beginning to emerge. Cell type specific deletion of PTEN gene in neural progenitor cells or postmitotic neurons in mice resulted in macrocephaly, excessive dendritic arborization, and autistic features [Groszer et al., 2001; Kwon et al., 2006].
The mammalian PTEN genes are highly conserved with an amino (N)‐terminal catalytic domain and a carboxyl (C)‐terminal regulatory C2 domain, which is followed by a flexible tail region composed of numerous sites for posttranslational modifications. The posttranslational modifications of the tail region are implicated in regulating PTEN catalytic activity, stability and subcellular localization. In PHTS, missense, frameshift and nonsense variants have been reported to target the entire coding region of the human PTEN gene [Hansen‐Kiss et al., 2017]. In this report, we characterized PTEN germline mutations associated with three cases of PHTS with macrocephaly and neurodevelopmental delays.
Methods
Clinical Cases
Patients with a clinical suspicion of PHTS including autistic features and/or neurodevelopmental delays and macrocephaly were referred for assessment and genetic testing to the Clinical Genetic Service (CGS) of Department of Health. The CGS is the only government funded genetic referral centers that provide comprehensive genetic counseling, diagnostic and laboratory service for the whole of Hong Kong population. All records of patients with suspected PHTS between January 1995 and September 2016 under CGS were retrieved from the computer database system. A total of thirteen patients with clinical diagnoses after assessment were recruited for genetic investigation.
Chemicals
All chemicals were purchased from Sigma Aldrich unless otherwise indicated.
Antibody Reagents
Antibodies against PTEN (#9552), p‐Akt‐S473 (#3271), c‐Akt (#9272), PTEN‐pS380/pT382/pT383 (#9554) were from Cell Signaling Inc. The anti‐AU5 monoclonal antibody (#ab130113) was purchased from Abcam Inc. and anti‐actin antibody (#I‐19) was from Santa Cruz Inc. An antibody directed against PTEN‐pT366 has been described previously [Tibarewal et al., 2012].
PTEN Mutation Analysis
All 9 exons of the PTEN gene were amplified by polymerase chain reaction (PCR) from blood DNA followed by Sanger sequencing as described previously [Li & Sun, 1997; Liaw et al., 1997; Steck et al., 1997]. 20 ng of genomic DNA was amplified using Q5 high‐fidelity DNA polymerase (New England BioLabs) under the following cycling condition: hot start at 98°C, 30 sec, and 25 cycles of 98°C, 10 sec, 55°C, 30 sec, and 72°C, 30 sec. The annealing temperature for exon 1 PCR was raised to 57°C. Each exon was first pre‐amplified with two outside primers (a and b). PCR products were purified by a PCR Cleanup kit (Geneaid) and eluted with 20 μl of water. DNAs were diluted 60 times and amplified with a pair of nested primers (c and d). Exon 4 was amplified once with a primer pair (X4a and X4b) and sequenced directly with a nested primer (X4c). PCR products were resolved by agarose gel electrophoresis and correct size fragments were isolated by a Gel Extraction Kit (Geneaid). DNA fragments were sequenced with the nested primers. Mutations detected will be confirmed with an independent round of PCR reaction and resequencing of the opposite strand.
Exon1: X1a cagccgttcggaggatta, X1b atatgacctagcaacctgacca
X1c gttttcccagtcacgacgagtcgctgcaaccatcca, X1d aggaaacagctatgaccatctaagagagtgacagaaaggta
Exon2: X2a ccatgtggaagttacctttta, X2b tacggtaagccaaaaaatga
X2c gttttcccagtcacgacgtgaccaccttttattactcca, X2d aggaaacagctatgaccatagtatctttttctgtggctta
Exon3: X3a atattctctgaaaagctctgg, X3b ttaatcggtttaggaatacaa
X3c gttttcccagtcacgacgatagaaggggtatttgttgga, X3d aggaaacagctatgaccatcctcactctaacaagcagata
Exon4: X4a gttaaacacagcataatatgtgtc, X4b tatgtatctcactcgataatctgg, X4c ctcactcgataatctggatgactc
Exon5: X5a agtttgtatgcaacatttctaa, X5b ttacttgtcaattacacctca
X5c gttttcccagtcacgacggcaacatttctaaagttaccta, X5d aggaaacagctatgaccatctgttttccaataaattctca
Exon6: X6a atatgttcttaaatggctacga, X6b ctttagcccaatgagttga
X6c gttttcccagtcacgacgagttaccatagcaatttagtga, X6d aggaaacagctatgaccataatttgttcaaatgcttcaga
Exon7: X7a acagaatccatatttcgtgta, X7b taatgtctcaccaatgcca
X7c gttttcccagtcacgacgatcgtttttgacagtttg, X7d aggaaacagctatgaccattcccaatgaaagtaaagtaca
Exon8: X8a tgcaaatgtttaacataggtga, X8b cgtaaacactgcttcgaaata
X8c gttttcccagtcacgacgaggtgacagattttctttttta, X8d aggaaacagctatgaccatagctgtactcctagaatta
Exon9: X9a cctcttaaaagatcatgtttg, X9b agattggtcaggaaaagagaa
X9c gttttcccagtcacgacggttcatctgcaaaatgga, X9d aggaaacagctatgaccatggtaatctgacacaatgtccta
Expression Plasmids
The I101T, D109X, K13E, K289E, I101T/K289E, and I101T/K13E mutants were generated by PCR‐based site‐directed mutagenesis. All cDNAs generated were cloned into either the pEF‐AU5 or pEGFP‐C1 vector and authenticity confirmed by sequencing analysis as described previously [Kimmelman, Nunez Rodriguez, & Chan, 2002]. The wild‐type (WT) and D92A/C124A (ΔCAT) catalytic dead expression plasmids have been described before [Odriozola, Singh, Hoang, & Chan, 2007; Singh, Odriozola, Guan, Kennedy, & Chan, 2011].
Cell Cultures
The HEK293T, PC3, and U251 cell lines were from the cell bank at the National Cancer Institute, USA. Cultures were maintained in DMEM supplemented with 10% fetal bovine serum (FBS) and penicillin‐streptomycin (pen‐strep) mixture manufactured by Life Technologies. For transfection of cells, approximately 1 × 10⁵ cells were seeded in a well of a 6‐well culture dish. 0.1 to 3.0 μg of plasmids was co‐incubated with 2 μl of Lipofectamine 2000 in 0.2 ml of Opti‐MEM (Life Technologies). This mixture was added to 2 ml of DMEM + 5% FBS medium without pen‐strep and incubated for 16 hr. Cells were processed 24–48 hr later.
Lipid Phosphatase Assay
An immunoprecipitation‐coupled lipid phosphatase assay was performed as previously described [Singh, Odriozola, Guan, Kennedy, & Chan, 2011]. Briefly, 3 × 10⁵ 293T cells in 100‐mm plates were transfected by lipofection using 10 μg of various PTEN expression constructs. After 36 hr, cells were washed twice with cold TBS (25 mM Tris‐HCl pH8.0, 150 mM NaCl) and solubilized in 550 μl of lysis buffer (25 mM Tris‐HCl pH8.0, 150 mM NaCl, 1% Triton X‐100, 2 mM DTT, and a protease inhibitor cocktail). The entire lysate was subjected to immunoprecipitation with 1 μg of an anti‐AU5 epitope antibody for 3 hr at 4°C. The antibody bound PTEN protein was captured with 35 μl of GammaBind G sepharose beads (GE Healthcare Life Sciences) for 1 hr. Reactions were initiated with the addition of 30 μl of reaction mixture (25 mM Tris‐HCl pH8.0, 10 mM DTT, 50 μM PIP3 and 50 μM PIP2) (Echelon). After incubating at 37°C for 10 min, 100 μl of Malachite green (Echelon) was added to 25 µl of each reaction mixture. The absorbance at OD 620 nm was measured in an xMark Microplate Absorbance Spectrophotometer (Bio‐Rad). The amount of PTEN protein assayed was quantified using purified glutathione S‐transferase (GST)‐PTEN fusion protein as a standard. The enzymatic activity was presented as pmol PPi released/ng/min of PTEN.
Western Blotting Analysis
Cells were routinely solubilized in 100 μl of either 2× Laemmli buffer or RIPA buffer composed of 50 mM Tris‐HCl pH7.5, 1% Triton X‐100, 0.5% sodium deoxycholate, 0.1% SDS, 150 mM NaCl, 10 mM MgCl2, and protease and phosphatase inhibitors. Approximately 5–20 μg of total cell lysates was resolved on 10% SDS‐PAGE gels, protein species were transferred onto nitrocellulose membranes and probed with selected primary antibodies. Bound antibodies were detected with either horseradish peroxidase‐conjugated anti‐mouse or rabbit secondary antibodies. The expression levels of protein were visualized by the standard ECL method (Life Technologies) followed by exposure to X‐ray films. Band intensity was quantified by the GS‐900 Calibrated Densitometer System (Bio‐Rad).
Immunofluorescence Analysis
Cells were seeded with a density of 1 × 10⁴ on a glass coverslip coated with 0.5% Matrigel®Matrix (CORNING #356231), in a 12‐well‐plate. Cells were transfected with 0.5 μg of DNA and 1 μl of Lipofectamine 2000 for 6 hr in DMEM without pen‐strep. After 36 hr, cells were fixed with 4% paraformaldehyde for 15 min and permeabilized with 0.5% of Triton X‐100 in PBS for 12 min at room temperature (RT). Permeabilized cells were incubated with 0.1% glycine and then blocked with 5% FBS in PBS. After blocking, cells were incubated with anti‐AU5 (1:100) at 4°C overnight. Cells were washed with PBS and then incubated with Alexa Fluor® 488 conjugated donkey anti‐mouse IgG (H + L) antibody (1:200) (Life Technologies) for 1 hr. The cells were incubated with 300 nM DAPI and mounted on glass slides with mounting medium (VECTOR laboratories). Cells were imaged on a confocal microscope (Olympus FV1200 SIM) using a 60× silicon oil objective. Focal planes with the nuclear diameter at its widest were selected for imaging analysis. The fluorescence signals of nucleus and cytosol were measured by ImageJ software and calculated by the formula: Integrated density of the chosen compartment−background fluorescence signal. The relative ratios of nucleus to cytosol intensity were calculated from 27 cells for each transfected culture. Separately, EGFP‐PTEN was imaged on live cells by fluorescence microscope (Nikon Ti‐E) using the MetaMorph imaging software.
Statistical Analysis
Statistical significance was analyzed by Mann–Whitney test. For multivariant analysis, Two‐way ANOVA followed by Bonferroni posttest was used. Statistical significance was considered to be P values of <0.05.
Results
Mutation Analysis of the PTEN Gene in PHTS Patients
A total of 13 genomic DNA samples from patients presenting with PHTS features referred to CGS were analyzed for PTEN mutations (Table 1). All 9 coding exons of the human PTEN gene were amplified by PCR and subjected to Sanger sequencing analysis. Patient D07018 was a female patient diagnosed at age 9 with moderate intellectual disability, autistic features, overgrowth and macrocephaly. Sequencing analysis revealed a T to C transition mutation at nucleotide 302 (c. 302T > C) resulting in a missense mutation altering codon 101 from an isoleucine to a threonine (Fig. 1). The authenticity of this mutations was ascertained with separate PCR reactions and both strands were sequenced (data not shown). Patient D02373 is a 10‐year‐old male patient with developmental delays and autistic features. The PTEN gene of this patient harbored an insertion of a C nucleotide at position 327 (c. 327_328insC) resulting in a shift in the reading frame and an extension from codon 109 for an additional 4 amino acids (Pro‐Met‐Ala‐Lys) before it terminated at a stop codon (TGA) (Fig. 1). This resulted in the generation of a truncated PTEN molecule (denoted here as D109X) with 113 amino acids in length, and with only a portion of the catalytic domain being preserved. The third patient, D09742, was a 10‐year‐old Chinese boy referred to CGS for developmental delays, ASD and macrocephaly (>97th percentile). Clinical examination showed that he has no dysmorphic feature, goiter or abnormal skin change. Chromosomal microarray analysis was normal, baseline metabolic workup and MRI brain scan was normal. Based on the intellectual deficits and macrocephaly, PTEN mutation was suspected. Sequencing analysis revealed a c. 1003C > T truncated mutation at codon R335 (R335X) which resulted in the deletion of the C‐terminal PEST domain and PDZ‐binding motif. Ectopic expression of the D109X mutant in cultured cells failed to yield any detectable truncated protein species (data not shown). Also, the C‐terminal truncation mutants similar to R335X have been extensively studied [Sun et al., 2014; Tolkacheva et al., 2001]. Therefore, the I101T mutant was analyzed in greater details because it has not been extensively characterized.
Table 1.
Patient Cases. Patient Identification Numbers, Clinical Features, PTEN Mutation Sites and Origins of Mutation are Shown
| Patient ID | Clinical features | PTEN mutation | Growth parameters | Familial/De novo |
|---|---|---|---|---|
| D06035 | Mild intellectual disability, overgrowth, autism | HC, BH, BW 90–97% | ||
| D05214 | Autism | HC 50%, BH, BW 25–50% | ||
| C07087 | Macrocephaly, mild intellectual disability, epiphyseal dysplasia | HC>97%, BW, BH 50–75% | ||
| D08525 | Autism, overgrowth | HC, BH, BW 90–97% | ||
| D02373 | Developmental delay, autistic features | c. 327 328insC | HC>97%, BH, BW 90–97% | Familial |
| D03714 | Developmental delay | HC, BH, BW 25–50% | ||
| D08022 | Developmental delay, autistic features | HC, BH, BW 10–25% | ||
| D03288 | Intellectual disability, macrocephaly | HC >97%, BW, BH 50–75% | ||
| D07018 | Moderate intellectual disability, autistic features, overgrowth, macrocephaly | c. 302T>C | HC>97%, BH, BW 90–97% | De novo |
| D10620 | Developmental delay | HC, BH, BW 25–50% | ||
| GS7 | Intellectual disability, pigmented macule over penile region | HC 50%, BH, BW 25–50% | ||
| K10265 | Intellectual disability, dysmorphism, strong family history of cancer | HC, BH, BW 25–50% | ||
| D09742 | Macrocephaly, developmental delay, autistic features | c. 1003C>T | HC >97%, BW, BH 50–75% | De novo |
HC, head circumference; BW, body weight; BH, body height.
Figure 1.

Mutation analysis of PTEN gene. All 9 exons of the human PTEN gene were amplified and subjected to Sanger sequencing analysis. A T to C substitution at position 302 of codon 101 was detected in patient D07018, a C insertion at position 327–328 of codon 109 in patient D02373, and a C to T substitution at position 1003 of codon 335 in patient D09742. Mutation sites are indicated by arrows.
The PTEN I101T mutant has reduced protein expression level
The I101T mutant was tagged in the amino (N)‐terminus with an AU5 epitope and ectopically expressed in a PTEN‐null prostate cancer cell line, PC3. As shown in Figure 2A, the expression level of I101T was reduced by 4‐fold when compared to wild‐type (WT) or a catalytic‐dead (ΔCAT) PTEN D92A,C124A mutant (Fig. 2A). Similar results were also obtained in 293T cells with a 2.5‐fold reduction in protein expression (Fig. 2B). These results were not due to lowered transfection efficiency as cotransfection with a GFP plasmid yielded similar fraction of GFP‐positive cells and GFP protein expression in both PC3 and 293T cells (Fig. S1). The low expression level suggests that this mutant may be unstable. To investigate whether I101T has a reduced protein half‐life (t 1/2), cells transfected with WT or I101T expression plasmids were treated with 80 μg/ml of cycloheximide (CHX) at regular interval for 12 hr. WT PTEN has a t 1/2 of ∼5.5 hr, while I101T has a significantly shorter t 1/2 of ∼2 hr (Fig. 2C).
Figure 2.

Expression analysis of PTEN I101T mutant. (A) Indicated expression plasmids were transfected in PC3 cells. After 48 hr, cells were solubilized with Laemmli buffer. Western blotting analysis was carried out using anti‐PTEN and anti‐actin antibodies. (B) Similar experiments were conducted in 293T cells with comparable results being obtained. Results were quantified from six independent experiments. Bars, SD. **P < 0.01; Mann–Whitney test. (C) 293T cells were transfected with either WT or I101T expression plasmids. Cells were treated with cycloheximide (80 μg/ml) for the indicated durations. Cells were solubilized in Lammeli buffer and the levels of PTEN were determined by Western blotting analysis and normalized to actin levels. Results from three independent experiments were quantified. Bars, SD. **P < 0.01; Two‐Way ANOVA with Bonferroni posttest.
To investigate if altered ubiquitination could be responsible for the reduced expression of I101T, 293T cells expressing I101T were treated with 10 μM of MG132, which is a proteasome inhibitor. I101T has a 3.6‐fold increase in basal level of polyubiquitination (Fig. 3A). MG132 treatment further potentiated the extent of polyubiquitination by 9.1‐fold when compared to WT or the ΔCAT mutant (Fig. 3A). This result suggests that I101T may undergo a higher rate of degradation through polyubiquitination. Since both codon K13 and K289 of PTEN were previously reported to be ubiquitination sites, they were mutated to generate I101T/K13E and I101T/K289E double mutants. The rationale was that the substitutions of these sites could rescue the degradation of the I101T mutant. Transfection of the same amount of plasmid DNA into 293T cells showed that the I101T/K13E double mutant partially restored the I101T level from 32% to 77% of WT (Fig. 3B). In contrast, the I101T/K289E double mutant failed to rescue the reduced protein expression of the I101T mutant. Of note, the K13E mutant was intrinsically more stable and displayed higher protein expression level. Next, PTEN levels in whole cell lysates were normalized and Western blotting was carried out. Under this condition, I101T showed a higher intensity of smear above the unmodified 57 kDa PTEN band (Fig. 3C). The higher intensity of smear indicated that a larger proportion of I101T was polyubiquitinated. For the double mutants, only the I101T/K13E but not the I101T/K289E mutant showed a decreased in polyubiquitination (Fig. 3C). Overall, our results indicate that K13 is responsible for the polyubiquitination and degradation of I101T.
Figure 3.

Enhanced polyubiquitination of PTEN I101T mutant. (A) Western blotting analysis of whole cell extracts of 293T transfected with the indicated expression plasmids. Cells were treated with (+) or without (−) 10 μM of MG132 for 6 hr. The intensity of the polyubiquitinated (PolyUb) PTEN protein species (bracketed) was quantified and normalized to the levels of the unmodified PTEN. Results derived from six independent experiments. Bars, SD. *, P < 0.05; **P < 0.01; ns, not significant; Mann–Whitney test. (B) Western blotting analysis was carried out as outlined in (A) and the relative expression of PTEN was quantified and normalized to actin. Results from six independent experiments. Bars, SD. **P < 0.01; ns, not significant; Mann–Whitney test. (C) Similar lysates were first normalized to give similar PTEN expression and Western blotting analysis was performed using anti‐PTEN antibody to detect the extent of polyubiquitination. The non‐ubiquitinated PTEN protein species are marked with an asterisk.
To examine whether the reduced protein expression was due to changes in protein phosphorylation, the I101T mutant was expressed in 293T cells and immunoprecipitated with an anti‐AU5 antibody. Due to the uneven expression of PTEN mutants, the amounts of lysate were adjusted in order to normalize the level of PTEN being analyzed. Western blotting analysis using an anti‐phospho‐PTEN S380/T382/T383 antibody did not reveal significant changes in phosphorylation at these three sites (Fig. 4A). However, probing with an anti‐phospho‐PTEN T366 antibody revealed a 4.5‐fold reduction in phosphorylation (Fig. 4B). As expected, the ΔCAT mutant, which has been shown to be more stable than WT, showed a 2.6‐fold increase in p‐PTEN T366 level (Fig. 4B). Thus, our data demonstrate that the I101T mutant has reduced phosphorylation at the T366 site, which may contribute to its reduced protein expression level.
Figure 4.
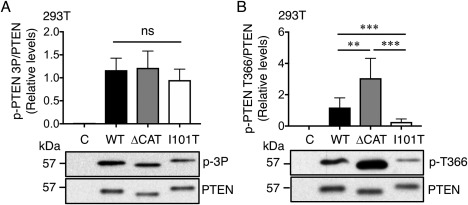
Phosphorylation state of PTEN I101T mutant. Western blot analysis of 293T cells transfected with WT, ΔCAT and I101T. Similar level of PTEN was immunoprecipitated with an anti‐AU5 antibody and Western blotting analysis was carried out with either an anti‐p‐PTEN S380/T382/T383 (p‐3P) (A) or an anti‐p‐PTEN T366 (B) antibodies. Results were derived from six independent experiments for (A) and seven individual experiments for (B). Bars, SD. **P < 0.01; ***P < 0.001; ns, not significant; Mann–Whitney test.
Lipid Phosphatase Activity of the PTEN I101T Mutant
Codon I101 is located within the phosphatase domain of PTEN. To examine whether the I101T mutation could affect PTEN lipid phosphatase activity, both in vivo and in vitro enzymatic assays were performed. For the in vivo assay, I101T was ectopically expressed in two PTEN‐null cell lines, PC3 and U251, to determine its lipid phosphatase activity. As shown in Figure 5A and B, I101T retained 46% and 75% of the ability of WT in suppressing p‐Akt S473 in PC3 and U251, respectively. To examine the ability of I101T in suppressing serum‐induced p‐Akt, PC3 cells were serum‐starved overnight and stimulated with FBS for 10 min. Under this condition, I101T still retained most of the capacity in suppressing both p‐Akt T308 and p‐Akt S473 as compared to wild‐type (Fig. 5C). One caveat of this data is that the I101T mutant has lower protein expression levels and the fact that overexpression system was used. Therefore, in vitro assays were performed by normalizing the expression level of different PTEN protein species. In this assay, AU5‐tagged PTEN WT, ΔCAT and I101T mutants were expressed in 293T and immunoprecipitated with an anti‐AU5 epitope antibody. Affinity purified proteins were then incubated in a reaction mixture containing PIP3+PIP2 for 10 min at 37°C and the enzymatic activity was expressed as pmol of free phosphate released per ng of PTEN per min (pmol ng−1min−1). As shown in Figure 5D, the I101T mutant retained ∼30% of the lipid phosphatase activity of the WT protein. As expected, the catalytic dead ΔCAT mutant had the lowest apparent enzymatic activity. Thus, these results are consistent with the in vivo assays. We conclude that the PTEN I101T mutant has a partial loss of lipid phosphatase activity and together with the reduced protein expression, contribute to the symptoms observed in this patient.
Figure 5.

Lipid phosphatase activity of PTEN I101T mutant. Empty vector control (C), PTEN WT and I101T expression plasmids were transfected in either PC3 (A) or U251 (B) cell lines. The levels of p‐Akt S473 (p‐Akt) and total Akt (c‐Akt) were examined by Western blotting analysis. Specific p‐Akt levels were calculated from six and three individual experiments for PC3 and U251, respectively. Bars, SD. *P < 0.05; **P < 0.01; ns, not significant; Mann–Whitney test. (C) PC3 transfected with indicated plasmids were serum‐starved for overnight and stimulated with 10% FBS for 10 min. The levels of p‐Akt T308, p‐Akt S473 and total Akt (c‐Akt) were examined by Western blotting analysis. Specific p‐Akt levels were calculated from three individual experiments. ns, not significant; Mann–Whitney test. (D) Indicated plasmids were transfected in 293T cells. PTEN was immunoprecipitated by an anti‐AU5 antibody and probed with an anti PTEN antibody (lower panel). PTEN protein levels were normalized and lipid phosphatase assay was carried out with PIP2+PIP3 as substrates with released phosphate measured by a Malachite Green Assay kit (Echelon). Lipid phosphatase activities from seven independent experiments were quantified and expressed as pmol ng−1min−1. Bars, SD. **P < 0.01, ***P < 0.001; Mann–Whitney test.
The PTEN I101T Mutant Has Decreased Nuclear Localization
PTEN is known to associate with microvesicles in the cytoplasm [Naguib et al., 2015] and its nuclear localization is linked to its role in genomic stability [Shen et al., 2007; van Ree, Nam, Jeganathan, Kanakkanthara, & van Deursen, 2016]. To test whether the PTEN I101T mutant has altered subcellular distribution, immunofluorescence analysis was conducted using an anti‐AU5 monoclonal antibody. As shown in Fig. 6A, AU5‐tagged PTEN has an overall greater staining intensity in the cytoplasm than in the cell nucleus. The I101T mutant as well as the ΔCAT mutant showed a 75% decrease in nuclear/cytosol (N/C) distribution when compared with WT (Fig. 6A). To confirm this finding, GFP‐tagged PTEN WT or I101T were expressed in 293T. Analyzing the N/C distribution also revealed a decrease in N/C ratio by approximately 55% of the I101T mutant (Fig. 6B). This data suggests that the PTEN I101T mutant may have its nuclear functions compromised.
Figure 6.

Nuclear localization of PTEN I101T mutant. (A) Immunofluorescence analysis of AU5‐tagged PTEN WT, ΔCAT, and I101T in 293T using an anti‐AU5 antibody and detected with an anti‐mouse IgG antibody conjugated with Alexa 488 fluorophore. Cell nuclei were stained with DAPI. Positive control for nuclear staining was provided by a PTEN tagged with a nuclear localization signal (NLS‐WT). Fluorescent signals were captured by confocal microscopy and representative images are shown. Fluorescent intensity was quantified for the cytosolic and nuclear compartments by ImageJ software and expressed as a relative ratio. Bars, SD; n = 27; ***P < 0.001. ns, not significant. One‐way ANOVA. (B) Live cell imaging of GFP‐PTEN WT and GFP‐PTEN I101T; nuclei were stained with Hoechst 33342. Fluorescent intensity was quantified for the cytosolic and nuclear compartments and expressed as a ratio of the nuclear to cytosol fluorescence intensity. Bars, SD. n = 7, ***P < 0.001. Mann–Whitney test.
Discussion
The 13 patients in our cohort have clinical features of autism and macrocephaly. The PTEN mutation frequency of 23% (3/13) resembles the one reported by Butler et al. from a subset of individuals with ASD and extreme macrocephaly [Butler et al., 2005]. It is also interesting to note that only 25% of PHTS subjects have pathologic germline mutations in the PTEN gene [Ngeow & Eng, 2016; Tan et al., 2011]. Therefore, the genetic basis of a significant fraction of PHTS still remained to be uncovered. There are several possibilities. First, a host of posttranslational modifications such as phosphorylation, ubiquitination, acetylation, and SUMOylation can suppress PTEN catalytic activity and subcellular localization [Singh & Chan, 2011]. Alternatively, The PTEN promoter region can be subjected to epigenetic silencing [Salvesen et al., 2001]. Similarly, PTEN gene expression can be reduced posttranscriptionally by microRNAs [Meng et al., 2007]. Also, individual exons can be deleted entirely rendering detection by conventional Sanger sequencing not feasible. The use of next generation sequencing approaches may resolve this issue. In this cohort, 2 out of 3 cases with PTEN mutations are de novo change (Table 1). Along this line, a study of 187 pathogenic PTEN‐positive families led to an estimate that the frequency of de novo PTEN mutation is between 10.7% and 47.6% [Mester & Eng, 2012].
The I101T mutant revealed in our cohort has previously been identified from a Cowden Disease cohort of 3,042 probands [Tan et al., 2011; Vanderver et al., 2014]. Separately, Medne et al. had reported the same mutation in a patient with macrocephaly and hypotonia but with normal speech and cognitive development (http://www.ashg.org/genetics/ashg07s/f2114http://7.htm). A survey of the COSMIC database revealed ten human cancers that harbored the I101T mutation: eight cases of gliomas [James et al., 1999; Sasaki et al., 2001; Schmidt et al., 1999], one case of lymphoid neoplasm and one case of colorectal cancer.
As for the biochemical properties of the I101T mutant, the major mechanism of PTEN inactivation is the 2.5 to 4‐fold or on an average 70% reduction in its protein expression when compared with WT. In conjunction with a 70% decrease in lipid phosphatase activity in the I101T mutant, we estimated that this patient retains ∼21% of the total PTEN catalytic function. Since patient D07018 harbors a wild‐type allele, it is expected that each somatic cell still possesses ∼71% of PTEN catalytic activity. Similarly, decreased in protein stability has been reported with other ASD PTEN mutants [Spinelli, Black, Berg, Eickholt, & Leslie, 2015]. Recent detailed biochemical analysis of PTEN phosphorylation site mutants revealed that phosphorylation at T366/S370 occludes the catalytic pocket of PTEN without affecting its liposome binding capacity [Masson, Perisic, Burke & Williams, 2016]. It was paradoxical that the reduced p‐T366 in I101T mutant was associated with a reduction in lipid phosphatase activity towards soluble PIP3. There are two plausible explanations. First, there are other phosphorylation sites in the C‐terminal PEST domain of PTEN that could be altered in the I101T mutant to reduce its intrinsic phosphatase activity. These include S362, S370, S380, T382, T383, S385, S370, and T398 [Singh & Chan, 2011; Fragoso & Barata, 2015]. Second, codon I101 is located in the alpha‐helical structure of the pα3 region [Lee et al., 1999]. It is unlikely to be involved in the direct interaction with lipid or protein substrates such as those encompassing codon 120–130. However, the isoleucine to threonine substitution may distort the catalytic pocket leading to compromised substrate binding or catalytic activity.
The 4.5‐fold reduction in p‐T366 of the I101T mutant also correlated with a destabilization of PTEN protein. T366 is phosphorylated by both Gsk3‐β and Plk3, which can have either a destabilizing or stabilizing role, respectively [Maccario, Perera, Davidson, Downes, & Leslie, 2007; Xu et al., 2010]. Currently, it is unclear if the reduced I101T protein expression is caused by reduced p‐T366 level. Generating a I101T/T366E mutant to mimic constitutive phosphorylation of T366 may resolve this issue. Our results have indicated that K13 is critically important in the polyubiquitination and stability of the I101T mutant. The first cancer‐associated mutant of K13, K13E, was identified in a human glioblastoma sample [Duerr et al., 1998]. The K13E mutant fails to bind plasma membrane and has attenuated ability to translocate to the cell nucleus [Gil et al., 2006; Trotman et al., 2007; Walker, Leslie, Perera, Batty, & Downes, 2004]. Indeed, K13 is polyubiquintinated and implicated in protein stability, while K289 is preferentially mono‐ubiquitinated and plays a role in nuclear targeting [Trotman et al., 2007]. Therefore, it is not surprising that the I101T/K13E mutant but not the I101T/K289E mutant has restored protein expression. How heightened polyubiquitination at K13 in the I101T mutant can perturb nuclear localization is currently not clear.
It is also important to note that partial reduction rather than complete loss of PTEN phosphatase activity may be a defining feature of ASD‐associated PTEN mutants, which has been reported by two groups previously [Rodriguez‐Escudero et al., 2011; Spinelli et al., 2015]. Indeed, it is estimated that patient D07018 retains 71% of wild‐type PTEN catalytic activity. Either neural cell types are hypersensitive to modest PTEN loss or additional genetic variations are in play to cause the clinical symptoms in PHTS patients. Eventually, there is a need to examine if the extent of loss in PTEN activity in target cells shows correlation with disease severity not only in PHTS patients but also in idiopathic ASD.
We have observed reduced nuclear localization of the I101T mutant. PTEN has been implicated in chromosome stability through binding to centromeric protein CENPC‐C [Shen et al., 2007] as well as Dlg1 which is involved in mitotic spindle pole movement [van Ree, Nam, Jeganathan, Kanakkanthara, & van Deursen, 2016]. Moreover, PTEN together with p53, can regulate gene transcription under genotypic stress conditions [Li et al., 2006]. The role of nuclear PTEN in ASD is not defined. Indeed, we have also analyzed the nuclear localization of several ASD‐associated PTEN mutants and found both increased and decreased nuclear localization (manuscript in preparation). Whether altered phosphorylation or SUMOylation of the I101T can affect nuclear localization is not clear at present. Future research into understanding the transcriptome of neuronal cells carrying specific ASD‐associated PTEN mutant may provide molecular insights into the disease mechanisms of ASD.
Conflict of Interest
The authors have no conflicts of interest to declare.
Supporting information
Additional Supporting Information may be found in the online version of this article at the publisher's website.
Figure S1. Transfection efficiency of PC3 and 293T cells. (A) PC3 and (B) 293T cells were cotransfected with 0.5 µg PTEN and 0.3 µg pEGFP (GFP) expression plasmids. Cells were solubilized after 24 hr and fluorescent images from five random fields were counted for the number of green cells and expressed at fraction of GFP+ cells. The expression levels of PTEN and GFP are shown in the bottom panels.
Acknowledgments
This work was supported by the Lo Kwee‐Seong Biomedical Research Seed Fund, 6903806; Collaborative Research Fund grant, C4014‐14G, from the Hong Kong University Grants Committee; Pilot Project Fund, 4930742, from the Brain and Mind Institute of the Chinese University of Hong Kong; and Y.W. and M.Y. were supported by Hong Kong PhD Fellowships, PF12–13876 and PF12–13584, respectively.
References
- Butler, M.G. , Dasouki, M.J. , Zhou, X.P. , Talebizadeh, Z. , Brown, M. , Takahashi, T.N. , … Eng, C. (2005). Subset of individuals with autism spectrum disorders and extreme macrocephaly associated with germline PTEN tumour suppressor gene mutations. Journal of Medical Genetics, 42, 318–321. [DOI] [PMC free article] [PubMed] [Google Scholar]
- Christensen, D.L. , Baio, J. , Van Naarden Braun, K. , Bilder, D. , Charles, J. , Constantino, J.N. , … Yeargin‐Allsopp, M. (2016). Prevalence and characteristics of autism spectrum disorder among children aged 8 years–autism and developmental disabilities monitoring network, 11 sites, United States, 2012. MMWR Surveillance Summaries, 65, 1–23. [DOI] [PMC free article] [PubMed] [Google Scholar]
- De Rubeis, S. , & Buxbaum, J.D. (2015). Genetics and genomics of autism spectrum disorder: embracing complexity. Human Molecular Genetics, 24, R24–R31. [DOI] [PMC free article] [PubMed] [Google Scholar]
- Duerr, E.M. , Rollbrocker, B. , Hayashi, Y. , Peters, N. , Meyer‐Puttlitz, B. , Louis, D.N. , … von Deimling, A. (1998). PTEN mutations in gliomas and glioneuronal tumors. Oncogene, 16, 2259–2264. [DOI] [PubMed] [Google Scholar]
- Fragoso, R. , & Barata, J.T. (2015). Kinases, tails and more: Regulation of PTEN function by phosphorylation. Methods, 77–78, 75–81. [DOI] [PubMed] [Google Scholar]
- Gaugler, T. , Klei, L. , Sanders, S.J. , Bodea, C.A. , Goldberg, A.P. , Lee, A.B. , … Buxbaum, J.D. (2014). Most genetic risk for autism resides with common variation. Nature Genetics, 46, 881–885. [DOI] [PMC free article] [PubMed] [Google Scholar]
- Gil, A. , Andres‐Pons, A. , Fernandez, E. , Valiente, M. , Torres, J. , Cervera, J. , & Pulido, R. (2006). Nuclear localization of PTEN by a Ran‐dependent mechanism enhances apoptosis: Involvement of an N‐terminal nuclear localization domain and multiple nuclear exclusion motifs. Molecular Biology of Cell, 17, 4002–4013. [DOI] [PMC free article] [PubMed] [Google Scholar]
- Groszer, M. , Erickson, R. , Scripture‐Adams, D.D. , Lesche, R. , Trumpp, A. , Zack, J.A. , … Wu, H. (2001). Negative regulation of neural stem/progenitor cell proliferation by the PTEN tumor suppressor gene in vivo. Science, 294, 2186–2189. [DOI] [PubMed] [Google Scholar]
- Hansen‐Kiss, E. , Beinkampen, S. , Adler, B. , Frazier, T. , Prior, T. , Erdman, S. , … Herman, G. (2017). A retrospective chart review of the features of PTEN hamartoma tumour syndrome in children. Journal of Medical Genetics, 54, 471–478. [DOI] [PubMed] [Google Scholar]
- James, C.D. , Galanis, E. , Frederick, L. , Kimmel, D.W. , Cunningham, J.M. , Atherton‐Skaff, P.J. , … Scheithauer, B.W. (1999). Tumor suppressor gene alterations in malignant gliomas: histopathological associations and prognostic evaluation. International Journal of Oncology, 15, 547–553. [DOI] [PubMed] [Google Scholar]
- Kimmelman, A.C. , Nunez Rodriguez, N. , & Chan, A.M. (2002). R‐Ras3/M‐Ras induces neuronal differentiation of PC12 cells through cell‐type‐specific activation of the mitogen‐activated protein kinase cascade. Molecular and Cellular Biology, 22, 5946–5961. [DOI] [PMC free article] [PubMed] [Google Scholar]
- Kleijer, K.T. , Schmeisser, M.J. , Krueger, D.D. , Boeckers, T.M. , Scheiffele, P. , Bourgeron, T. , … Burbach, J.P. (2014). Neurobiology of autism gene products: Towards pathogenesis and drug targets. Psychopharmacology (Berl), 231, 1037–1062. [DOI] [PubMed] [Google Scholar]
- Kwon, C.H. , Luikart, B.W. , Powell, C.M. , Zhou, J. , Matheny, S.A. , Zhang, W. , … Parada, L.F. (2006). PTEN regulates neuronal arborization and social interaction in mice. Neuron, 50, 377–388. [DOI] [PMC free article] [PubMed] [Google Scholar]
- Lee, J.O. , Yang, H. , Georgescu, M.M. , Di Cristofano, A. , Maehama, T. , Shi, Y. , … Nikola, P.P. (1999). Crystal structure of the PTEN tumor suppressor: Implications for its phosphoinositide phosphatase activity and membrane association. Cell, 99, 323–334. [DOI] [PubMed] [Google Scholar]
- Li, A.G. , Piluso, L.G. , Cai, X. , Wei, G. , Sellers, W.R. , & Liu, X. (2006). Mechanistic insights into maintenance of high p53 acetylation by PTEN. Molecular Cell, 23, 575–587. [DOI] [PubMed] [Google Scholar]
- Li, D.M. , & Sun, H. (1997). TEP1, encoded by a candidate tumor suppressor locus, is a novel protein tyrosine phosphatase regulated by transforming growth factor beta. Cancer Research, 57, 2124–2129. [PubMed] [Google Scholar]
- Liaw, D. , Marsh, D.J. , Li, J. , Dahia, P.L. , Wang, S.I. , Zheng, Z. , … Parsons, R. (1997). Germline mutations of the PTEN gene in Cowden disease, an inherited breast and thyroid cancer syndrome. Nature Genetics, 16, 64–67. [DOI] [PubMed] [Google Scholar]
- Masson, G.R. , Perisic, O. , Burke, J.E. , & Williams, R.L. (2016). The intrinsically disordered tails of PTEN and PTEN‐L have distinct roles in regulating substrate specificity and membrane activity. Biochemical Journal, 473, 135–144. [DOI] [PMC free article] [PubMed] [Google Scholar]
- Maccario, H. , Perera, N.M. , Davidson, L. , Downes, C.P. , & Leslie, N.R. (2007). PTEN is destabilized by phosphorylation on Thr366. Biochemical Journal, 405, 439–444. [DOI] [PMC free article] [PubMed] [Google Scholar]
- Meng, F. , Henson, R. , Wehbe‐Janek, H. , Ghoshal, K. , Jacob, S.T. , & Patel, T. (2007). MicroRNA‐21 regulates expression of the PTEN tumor suppressor gene in human hepatocellular cancer. Gastroenterology, 133, 647–658. [DOI] [PMC free article] [PubMed] [Google Scholar]
- Mester, J. , & Eng, C. (2012). Estimate of de novo mutation frequency in probands with PTEN hamartoma tumor syndrome. Genetics in Medicine, 14, 819–822. [DOI] [PMC free article] [PubMed] [Google Scholar]
- Naguib, A. , Bencze, G. , Cho, H. , Zheng, W. , Tocilj, A. , Elkayam, E. , … Trotman, L.C. (2015). PTEN functions by recruitment to cytoplasmic vesicles. Molecular Cell, 58, 255–268. [DOI] [PMC free article] [PubMed] [Google Scholar]
- Nelen, M.R. , Kremer, H. , Konings, I.B. , Schoute, F. , van Essen, A.J. , Koch, R. , … Padberg, G.W. (1999). Novel PTEN mutations in patients with Cowden disease: Absence of clear genotype‐phenotype correlations. European Journal of Human Genetics, 7, 267–273. [DOI] [PubMed] [Google Scholar]
- Ngeow, J. , & Eng, C. (2016). Germline PTEN mutation analysis for PTEN hamartoma tumor syndrome. Methods in Molecular Biology, 1388, 63–73. [DOI] [PubMed] [Google Scholar]
- O'Roak, B.J. , Vives, L. , Fu, W. , Egertson, J.D. , Stanaway, I.B. , Phelps, I.G. , … Shendure, J. (2012). Multiplex targeted sequencing identifies recurrently mutated genes in autism spectrum disorders. Science, 338, 1619–1622. [DOI] [PMC free article] [PubMed] [Google Scholar]
- Odriozola, L. , Singh, G. , Hoang, T. , & Chan, A.M. (2007). Regulation of PTEN activity by its carboxyl‐terminal autoinhibitory domain. Journal of Biological Chemistry, 282, 23306–23315. [DOI] [PubMed] [Google Scholar]
- Parsons, R. (2004). Human cancer, PTEN and the PI‐3 kinase pathway. Seminars in Cellular and Developmental Biology, 15, 171–176. [DOI] [PubMed] [Google Scholar]
- Rodriguez‐Escudero, I. , Oliver, M.D. , Andres‐Pons, A. , Molina, M. , Cid, V.J. , & Pulido, R. (2011). A comprehensive functional analysis of PTEN mutations: Implications in tumor‐ and autism‐related syndromes. Human Molecular Genetics, 20, 4132–4142. [DOI] [PubMed] [Google Scholar]
- Salvesen, H.B. , MacDonald, N. , Ryan, A. , Jacobs, I.J. , Lynch, E.D. , Akslen, L.A. , & Das, S. (2001). PTEN methylation is associated with advanced stage and microsatellite instability in endometrial carcinoma. International Journal of Cancer, 91, 22–26. [DOI] [PubMed] [Google Scholar]
- Sasaki, H. , Zlatescu, M.C. , Betensky, R.A. , Ino, Y. , Cairncross, J.G. , & Louis, D.N. (2001). PTEN is a target of chromosome 10q loss in anaplastic oligodendrogliomas and PTEN alterations are associated with poor prognosis. American Journal of Pathology, 159, 359–367. [DOI] [PMC free article] [PubMed] [Google Scholar]
- Schmidt, E.E. , Ichimura, K. , Goike, H.M. , Moshref, A. , Liu, L. , & Collins, V.P. (1999). Mutational profile of the PTEN gene in primary human astrocytic tumors and cultivated xenografts. Journal of Neuropathology and Experimental Neurology, 58, 1170–1183. [DOI] [PubMed] [Google Scholar]
- Shen, W.H. , Balajee, A.S. , Wang, J. , Wu, H. , Eng, C. , Pandolfi, P.P. , & Yin, Y. (2007). Essential role for nuclear PTEN in maintaining chromosomal integrity. Cell, 128, 157–170. [DOI] [PubMed] [Google Scholar]
- Singh, G. , & Chan, A.M. (2011). Post‐translational modifications of PTEN and their potential therapeutic implications. Current Cancer Drug Targets, 11, 536–547. [DOI] [PubMed] [Google Scholar]
- Singh, G. , Odriozola, L. , Guan, H. , Kennedy, C.R. , & Chan, A.M. (2011). Characterization of a novel PTEN mutation in MDA‐MB‐453 breast carcinoma cell line. BMC Cancer, 11, 490. [DOI] [PMC free article] [PubMed] [Google Scholar]
- Song, M.S. , Salmena, L. , & Pandolfi, P.P. (2012). The functions and regulation of the PTEN tumour suppressor. Nature Reviews Molecular Cell Biology, 13, 283–296. [DOI] [PubMed] [Google Scholar]
- Spinelli, L. , Black, F.M. , Berg, J.N. , Eickholt, B.J. , & Leslie, N.R. (2015). Functionally distinct groups of inherited PTEN mutations in autism and tumour syndromes. Journal of Medical Genetics, 52, 128–134. [DOI] [PMC free article] [PubMed] [Google Scholar]
- Steck, P.A. , Pershouse, M.A. , Jasser, S.A. , Yung, W.K. , Lin, H. , Ligon, A.H. , … Tavtigian, S.V. (1997). Identification of a candidate tumour suppressor gene, MMAC1, at chromosome 10q23.3 that is mutated in multiple advanced cancers. Nature Genetics, 15, 356–362. [DOI] [PubMed] [Google Scholar]
- Sun, Z. , Huang, C. , He, J. , Lamb, K.L. , Kang, X. , Gu, T. , … Yin, Y. (2014). PTEN C‐terminal deletion causes genomic instability and tumor development. Cell Reports, 6, 844–854. [DOI] [PMC free article] [PubMed] [Google Scholar]
- Tan, M.H. , Mester, J. , Peterson, C. , Yang, Y. , Chen, J.L. , Rybicki, L.A. , … Eng, C. (2011). A clinical scoring system for selection of patients for PTEN mutation testing is proposed on the basis of a prospective study of 3042 probands. American Journal of Human Genetics, 88, 42–56. [DOI] [PMC free article] [PubMed] [Google Scholar]
- Tibarewal, P. , Zilidis, G. , Spinelli, L. , Schurch, N. , Maccario, H. , Gray, A. , … Leslie, N.R. (2012). PTEN protein phosphatase activity correlates with control of gene expression and invasion, a tumor‐suppressing phenotype, but not with AKT activity. Science Signaling, 5, ra18. [DOI] [PubMed] [Google Scholar]
- Tolkacheva, T. , Boddapati, M. , Sanfiz, A. , Tsuchida, K. , Kimmelman, A.C. , & Chan, A.M. (2001). Regulation of PTEN binding to MAGI‐2 by two putative phosphorylation sites at threonine 382 and 383. Cancer Research, 61, 4985–4989. [PubMed] [Google Scholar]
- Trotman, L.C. , Wang, X. , Alimonti, A. , Chen, Z. , Teruya‐Feldstein, J. , Yang, H. , … Pandolfi, P.P. (2007). Ubiquitination regulates PTEN nuclear import and tumor suppression. Cell, 128, 141–156. [DOI] [PMC free article] [PubMed] [Google Scholar]
- van Ree, J.H. , Nam, H.J. , Jeganathan, K.B. , Kanakkanthara, A. , & van Deursen, J.M. (2016). PTEN regulates spindle pole movement through Dlg1‐mediated recruitment of Eg5 to centrosomes. Nature Cell Biology, 18, 814–821. [DOI] [PMC free article] [PubMed] [Google Scholar]
- Vanderver, A. , Tonduti, D. , Kahn, I. , Schmidt, J. , Medne, L. , Vento, J. , … Helger, G.Y. (2014). Characteristic brain magnetic resonance imaging pattern in patients with macrocephaly and PTEN mutations. American Journal of Medical Genetics Part A, 164A, 627–633. [DOI] [PMC free article] [PubMed] [Google Scholar]
- Walker, S.M. , Leslie, N.R. , Perera, N.M. , Batty, I.H. , & Downes, C.P. (2004). The tumour‐suppressor function of PTEN requires an N‐terminal lipid‐binding motif. Biochemical Journal, 379, 301–307. [DOI] [PMC free article] [PubMed] [Google Scholar]
- Xu, D. , Yao, Y. , Jiang, X. , Lu, L. , & Dai, W. (2010). Regulation of PTEN stability and activity by Plk3. Journal of Biological Chemistry, 285, 39935–39942. [DOI] [PMC free article] [PubMed] [Google Scholar]
- Zbuk, K.M. , & Eng, C. (2007). Hamartomatous polyposis syndromes. Nature Clinical Practice Gastroenterology and Hepatology, 4, 492–502. [DOI] [PubMed] [Google Scholar]
Associated Data
This section collects any data citations, data availability statements, or supplementary materials included in this article.
Supplementary Materials
Additional Supporting Information may be found in the online version of this article at the publisher's website.
Figure S1. Transfection efficiency of PC3 and 293T cells. (A) PC3 and (B) 293T cells were cotransfected with 0.5 µg PTEN and 0.3 µg pEGFP (GFP) expression plasmids. Cells were solubilized after 24 hr and fluorescent images from five random fields were counted for the number of green cells and expressed at fraction of GFP+ cells. The expression levels of PTEN and GFP are shown in the bottom panels.