

Abstract
Aims
Sodium glucose co‐transporter 2 inhibitors (SGLT2i) are indicated for treatment of type 2 diabetes mellitus (T2DM); some SGLT2i have reported cardiovascular benefit, and some have reported risk of below‐knee lower extremity (BKLE) amputation. This study examined the real‐world comparative effectiveness within the SGLT2i class and compared with non‐SGLT2i antihyperglycaemic agents.
Materials and methods
Data from 4 large US administrative claims databases were used to characterize risk and provide population‐level estimates of canagliflozin's effects on hospitalization for heart failure (HHF) and BKLE amputation vs other SGLT2i and non‐SGLT2i in T2DM patients. Comparative analyses using a propensity score–adjusted new‐user cohort design examined relative hazards of outcomes across all new users and a subpopulation with established cardiovascular disease.
Results
Across the 4 databases (142 800 new users of canagliflozin, 110 897 new users of other SGLT2i, 460 885 new users of non‐SGLT2i), the meta‐analytic hazard ratio estimate for HHF with canagliflozin vs non‐SGLT2i was 0.39 (95% CI, 0.26‐0.60) in the on‐treatment analysis. The estimate for BKLE amputation with canagliflozin vs non‐SGLT2i was 0.75 (95% CI, 0.40‐1.41) in the on‐treatment analysis and 1.01 (95% CI, 0.93‐1.10) in the intent‐to‐treat analysis. Effects in the subpopulation with established cardiovascular disease were similar for both outcomes. No consistent differences were observed between canagliflozin and other SGLT2i.
Conclusions
In this large comprehensive analysis, canagliflozin and other SGLT2i demonstrated HHF benefits consistent with clinical trial data, but showed no increased risk of BKLE amputation vs non‐SGLT2i. HHF and BKLE amputation results were similar in the subpopulation with established cardiovascular disease. This study helps further characterize the potential benefits and harms of SGLT2i in routine clinical practice to complement evidence from clinical trials and prior observational studies.
Keywords: SGLT2 inhibitor, type 2 diabetes
1. INTRODUCTION
Canagliflozin is a sodium glucose co‐transporter 2 inhibitor (SGLT2i) that is approved for the treatment of type 2 diabetes mellitus (T2DM). In the CANagliflozin cardioVascular Assessment Study (CANVAS) Program that enrolled patients with T2DM and established cardiovascular disease or high cardiovascular risk, canagliflozin reduced the risk of major adverse cardiovascular events, hospitalization for heart failure (HHF) and death from cardiovascular causes or HHF relative to placebo, while increasing the risk of below‐knee lower extremity (BKLE) amputation.1 Multivariable analyses showed that the risk of amputation with canagliflozin was largely driven by known risk factors for amputation (ie, prior amputation, peripheral vascular disease, male sex, neuropathy, HbA1c > 8.0% and presence of cardiovascular disease), although canagliflozin treatment increased the risk of amputation independent of other risk factors.2
The EMPA‐REG OUTCOME trial showed a reduction in the risk of major adverse cardiovascular events, HHF and all‐cause mortality with empagliflozin vs placebo; there was no report of an increased risk of amputation with empagliflozin.3, 4 Findings from observational studies have confirmed the observed benefits of SGLT2i on HHF in clinical trials.5, 6 Two retrospective database studies compared the risk of amputation with SGLT2i and non‐SGLT2i. No difference in rate of amputation was seen among all new users in a privately insured, general population with T2DM, 21% with established cardiovascular disease,7 while an increased risk was seen in a subpopulation of patients with T2DM and established cardiovascular disease in the Department of Defense Military Health System according to the EASEL study.8 No study has directly compared drugs in the SGLT2i class to determine if there is a class effect for safety and effectiveness.
This study, OBSERVE‐4D, examined the comparative effects of canagliflozin vs other SGLT2i and non‐SGLT2i antihyperglycaemic agents (AHAs) on the risk of HHF and BKLE amputation in patients with T2DM, overall and within the subpopulation of patients with established cardiovascular disease, across 4 US administrative claims databases.
2. MATERIALS AND METHODS
A series of analyses was conducted within this population‐level effect estimation study following a retrospective comparative cohort design across 4 observational databases. The study was registered on http://clinicaltrials.gov (NCT03492580), and the protocol was reviewed by the FDA prior to study execution. All analyses were pre‐planned, with primary and sensitivity analyses pre‐specified as part of the protocol; no post hoc sensitivity analyses were performed. The full protocol, including all diagnoses, procedures and drug codes used to define the cohorts, as well as all analytic source codes to execute the study, has been made publicly available at https://github.com/OHDSI/StudyProtocols/tree/master/AhasHfBkleAmputation.
2.1. Data sources
De‐identified patient‐level data from 4 US administrative claims databases were used for this study: (1) Truven MarketScan® Commercial Claims and Encounters (CCAE), a medical and drug insurance claims database of unique patients that includes active employees, early retirees and their dependents insured by employer‐sponsored plans; (2) Truven MarketScan® Multi‐state Medicaid (MDCD), an administrative claims database that includes the pooled healthcare experience of Medicaid enrollees from multiple states; (3) Truven MarketScan® Medicare Supplemental Beneficiaries (MDCR), an administrative health claims database for Medicare‐eligible active and retired employees and their Medicare‐eligible dependents from employer‐sponsored supplemental plans; and (4) OptumInsight's Clinformatics® Datamart (Optum), an administrative health claims database for members who are fully insured in commercial plans or in administrative services only and commercial Medicare.
2.2. Exposure Cohorts
Six primary exposure cohorts of interest were defined as new users of: (1) canagliflozin; (2) empagliflozin or dapagliflozin; (3) empagliflozin; (4) dapagliflozin; (5) select non‐SGLT2i, defined as any dipeptidyl peptidase‐4 inhibitor (DPP‐4i), glucagon‐like peptide‐1 (GLP‐1) receptor agonist or other AHA (acarbose, bromocriptine, miglitol, nateglinide, repaglinide); and (6) all non‐SGLT2i, defined as any DPP‐4i, GLP‐1 receptor agonist, thiazolidinediones (TZD), sulfonylureas (SU), insulin or other AHA.
Each exposure cohort was defined as the set of patients who had a first exposure for the cohort‐defining drug(s), with the first exposure date (index date) occurring between April 1, 2013 and May 15, 2017, who had at least 1 diagnosis of T2DM without any diagnosis of T1DM or secondary diabetes on or any time before the index date, and for whom there was no evidence of dispensing of the defining drug in the required ≥365 days of prior continuous observation.
For each exposure cohort, risk was characterized across all new users, as well as within the subpopulation of patients with established cardiovascular disease, defined as having at least 1 diagnosis code for a condition indicating cardiovascular disease, such as arteriosclerotic vascular disease, cerebrovascular disease, ischemic heart disease or peripheral vascular disease, or having undergone at least 1 procedure indicating established cardiovascular disease, such as percutaneous transluminal coronary angioplasty, coronary artery bypass graft or revascularization, any time on or prior to the exposure start.
2.3. Outcome ascertainment
This study examined 2 primary outcomes of interest: (1) HHF and (2) BKLE amputation events. HHF was defined as all hospital admissions with a primary diagnosis of heart failure, as identified by ICD‐9‐CM and ICD‐10‐CM codes. BKLE amputation events were defined as all new BKLE amputation procedures, as identified by CPT‐4 or ICD‐9‐PCS codes for amputation of lower leg, ankle, foot or toe, excluding recent (within 30 days) revisions.
Additionally, 44 negative control outcomes, that is, conditions believed not to be causally associated with any of the exposure cohorts based on product labeling, published literature and spontaneous adverse event reporting, which have been used in prior observational studies of canagliflozin,7 were selected as a statistical diagnostic strategy to identify residual systematic error in the databases or study design and to empirically calibrate P values for any systematic error observed.9, 10 For each negative control outcome, we assumed a priori that the true hazard ratio (HR) was 1, and we applied the same analysis designed for the outcomes of interest to each negative control outcome, with the difference between the estimated HR of the negative control and 1 representing an estimate of the systematic error present for that outcome. Using these error estimates from all 44 negative controls, we produced an empirical null distribution that reflects the range of potential bias that may be present within the unknown outcomes (eg, HHF and BKLE amputation) and used this distribution to compute a calibrated P value for each outcome.
2.4. Time‐at‐risk periods
Two primary time‐at‐risk periods were evaluated: (1) an on‐treatment period aimed at evaluating risk during the period in which an individual is exposed to the drug; and (2) an intent‐to‐treat period aimed at evaluating overall risk after initiating treatment. The on‐treatment period was defined as the time from 1 day after exposure cohort start date (ie, the date of first exposure to the cohort‐defining drug/s) until the exposure cohort end date, defined as the end of the first persistent period of exposure, allowing for a 30‐day gap between successive exposures until the final exposure record. This exposure cohort end date represents the date the patient was expected to finish the dispensed supply of the last drug dispensed, but censoring at the time that any dispensing of a different non‐metformin AHA was observed. The intent‐to‐treat period was defined as the time from 1 day after exposure cohort start date to the end of the patient's observation period. Four additional time‐at‐risk variants were run for sensitivity analyses, as defined in the protocol.
2.5. Statistical analyses
Crude incidence rates of both outcomes were estimated within each exposure cohort and pre‐defined subgroups were estimated as the number of individuals with the outcome during each time‐at‐risk window, divided by the total time‐at‐risk.
Population‐level effect estimation analyses using a comparative cohort design were applied for 7 pairwise comparisons and all associated subgroups therein, that is, new users of: (1) canagliflozin vs empagliflozin or dapagliflozin; (2) canagliflozin vs empagliflozin; (3) canagliflozin vs dapagliflozin; (4) canagliflozin vs any DPP‐4i, GLP‐1 receptor agonist or other select AHA; (5) canagliflozin vs any DPP‐4i, GLP‐1 receptor agonist, TZD, SU, insulin or other select AHA; (6) empagliflozin or dapagliflozin vs any DPP‐4i, GLP‐1 receptor agonist or other select AHA; and (7) empagliflozin or dapagliflozin vs any DPP‐4i, GLP‐1 receptor agonist, TZD, SU, insulin or other select AHA. Patients with an observed outcome prior to index exposure were handled in 2 ways: (1) time‐to‐first‐post‐index‐event analysis, where hazards of an occurrence of outcome among all exposed patients were estimated, independent of prior outcome history; and (2) time‐to‐first‐ever‐event analysis, where hazards of first occurrence of outcome were estimated among patients with no history of the outcome.
Propensity score adjustment was used as an analytic strategy to reduce potential confounding as the result of imbalance between the target and comparator cohorts in baseline covariates. The propensity score is the probability of a patient being classified in the target cohort vs the comparator cohort, given a set of observed covariates. The propensity score was estimated using the predicted probability from a regularized logistic regression model, fit with a Laplace prior (LASSO) and the regularization hyperparameter selected through cross‐validation. Covariates used in the propensity score model included demographics (gender, age, index year and month), prior conditions, drugs, procedures and measurements observed during the 365 days prior to exposure, Charlson comorbidity index, the number of distinct conditions, drugs, procedures and visits observed in the prior 365 days and prior outcome history. Propensity score adjustment was performed in 2 ways: (1) variable‐ratio matching, where the target cohort and comparator cohorts were matched with a maximum ratio of 100 and using a caliper of 0.2 times the standard deviation of the logit of the propensity score distribution; and (2) stratification, where matched sets were derived from deciles of the propensity score distribution across both cohorts. The final outcome model applied a Cox proportional hazard model conditioned on the matched sets.11, 12 For each outcome model, we reported the HR, 95% confidence interval (CI), nominal P value and empirically calibrated P value.
Standardized mean difference was used as a metric to evaluate the performance of propensity score adjustment. The propensity score distribution of the target and comparator cohorts was plotted to evaluate comparability of the 2 cohorts, scaling the plot to the preference score to normalize for any imbalance in cohort size. The potential for residual systematic error was examined by plotting the distribution of estimates from negative control outcomes.
A large set of sensitivity analyses was performed to evaluate the robustness of findings, the complete details of which are described in the protocol. For each pairwise comparison of target and comparator exposures (n = 7), for each outcome (n = 2) and for each database (n = 4), there were 192 different analyses performed: 2 population types (overall population, subpopulation with established cardiovascular disease) by 4 different prior exposure assumptions (no restrictions, ≥1 prior non‐metformin AHA exposure, no prior non‐metformin AHA exposure, no prior exposure to comparator) by 6 time‐at‐risk windows (on‐treatment, intent‐to‐treat, on‐treatment with delayed induction and delayed lag, on‐treatment without censoring at switch, on‐treatment with delayed indication and delayed lag without censoring at switch, modified intent‐to‐treat) by 2 event types (first‐ever event, first post‐index event) by 2 propensity score adjustment strategies (variable ratio matching, stratification). In total, 10 752 effect estimates were produced.
Data source‐specific effect estimates were generated separately for each comparison‐outcome‐analysis combination in the 4 different populations, each of which reflects different patient compositions and follow‐up times and could potentially reveal different effects. Additionally, random‐effects meta‐analytic estimates were generated using the DerSimonian‐Laird and Hartung‐Knapp‐Sidik‐Jonkman methods13 to pool evidence across the 4 databases for all comparison‐outcome‐analyses for which there was sufficient homogeneity (I2 < 40%). The meta‐analytic estimates provide a composite summary which can serve as a useful supplement to the source‐specific estimates that can have greater precision than any source‐specific estimate.14 Although our analysis should be considered a form of individual patient‐level meta‐analysis, we did not perform a “one‐step” analysis because of the fundamental differences in populations. In order to preserve the internal validity of each population, we fit a propensity score model for each database that was unique to the patient composition and baseline characteristics of that database, and produced an effect estimate within the follow‐up time provided by each source. We specified a priori that we would not produce a meta‐analytic estimate when substantial heterogeneity was observed, because the variability reflects a potential violation of the random‐effects assumption that study estimates were drawn from the same underlying effect distribution and the use of a composite summary could be inappropriate.15
3. RESULTS
All results have been made publicly available through an interactive web‐based application at http://data.ohdsi.org/AhasHfBkleAmputation. This section summarizes the key findings across these results.
3.1. Overall population
Table 1 summarizes the number of patients exposed, total time‐at‐risk and the number of post‐index outcomes observed within 4 cohorts of interest, that is, new users of: (1) canagliflozin; (2) empagliflozin or dapagliflozin (other SGLT2i); (3) all non‐SGLT2i AHAs (any DPP‐4i, GLP‐1 receptor agonist, TZD, SU, insulin or other AHA); and (4) select non‐SGLT2i AHAs (any DPP‐4i, GLP‐1 receptor agonist, or other select AHA). Across the 4 databases, there were 142 800 new users of canagliflozin, 110 897 new users of other SGLT2i, 460 885 new users of all non‐SGLT2i AHAs and 345 867 new users of select non‐SGLT2i. CCAE is the largest database, contributing 48% to 72% of exposures in each cohort and 14% to 65% of the outcomes, while MDCD is the smallest database, contributing 1% to 9% of exposures and 2% to 21% of outcomes. The median time‐at‐risk for canagliflozin new users ranged across databases from 61 to 104 days in the on‐treatment period, and from 284 to 562 days in the intent‐to‐treat period. The incidence rate for BKLE amputation among new users of canagliflozin in the overall population ranged from 1.0 to 5.0 events per 1000 person‐years in the on‐treatment analysis, and from 1.5 to 4.5 events per 1000 person‐years in the intent‐to‐treat analysis. The incidence rate for HHF among new users of canagliflozin in the overall population ranged from 0.9 to 5.5 events per 1000 person‐years in the on‐treatment analysis, and from 2.1 to 11.8 events per 1000 person‐years in the intent‐to‐treat analysis. Across all cohorts, MDCD had the highest incidence rates for BKLE amputation, while MDCD and MDCR had higher rates of HHF than CCAE and Optum.
Table 1.
Crude incidence rate (per 1000 patient‐years) of HHF and BKLE amputation in the overall population of new users of: (1) canagliflozin, (2) empagliflozin or dapagliflozin (other SGLT2i), (3) all non‐SGLT2i, and (4) select non‐SGLT2i (DPP‐4i, GLP‐1 receptor agonists or other AHAs) during the on‐treatment and intent‐to‐treat time‐at‐risk periods
| CCAE | MDCD | MDCR | Optum | ||||||||||||||
|---|---|---|---|---|---|---|---|---|---|---|---|---|---|---|---|---|---|
| Persons | PY | Events | IR | Persons | PY | Events | IR | Persons | PY | Events | IR | Persons | PY | Events | IR | ||
| HHF | |||||||||||||||||
| On‐treatment | Canagliflozin | 73 024 | 36 013 | 32 | 0.9 | 6793 | 2015 | 11 | 5.5 | 10 802 | 5485 | 30 | 5.5 | 42 309 | 19 483 | 69 | 3.5 |
| Other SGLT2i | 70 522 | 31 526 | 37 | 1.2 | 1425 | 419 | 3 | 7.2 | 5041 | 2124 | 12 | 5.6 | 21 184 | 7600 | 21 | 2.8 | |
| All non‐SGLT2i | 218 512 | 125 334 | 456 | 3.6 | 42 565 | 18 486 | 470 | 25.4 | 43 615 | 30 687 | 677 | 22.1 | 149 999 | 84 927 | 1695 | 20.0 | |
| Select non‐SGLT2i | 159 012 | 76 054 | 206 | 2.7 | 21 369 | 7377 | 105 | 14.2 | 35 501 | 20 360 | 431 | 21.2 | 104 354 | 45 742 | 783 | 17.1 | |
| Intent‐to‐treat | Canagliflozin | 78 414 | 129 998 | 276 | 2.1 | 7467 | 7527 | 81 | 10.8 | 11 663 | 19 156 | 226 | 11.8 | 45 256 | 64 333 | 391 | 6.1 |
| Other SGLT2i | 80 295 | 96 864 | 181 | 1.9 | 1625 | 1660 | 16 | 9.6 | 5707 | 6639 | 54 | 8.1 | 23 270 | 26 477 | 130 | 4.9 | |
| All non‐SGLT2i | 221 744 | 322 365 | 1122 | 3.5 | 43 061 | 57 151 | 1255 | 22.0 | 45 018 | 68 780 | 1643 | 23.9 | 151 062 | 215 847 | 3793 | 17.6 | |
| Select non‐SGLT2i | 172 583 | 252 343 | 816 | 3.2 | 23 443 | 29 478 | 456 | 15.5 | 38 408 | 60 762 | 1405 | 23.1 | 111 433 | 164 365 | 2713 | 16.5 | |
| BKLE amputation | |||||||||||||||||
| On‐treatment | Canagliflozin | 73 024 | 36 004 | 37 | 1.0 | 6793 | 2011 | 10 | 5.0 | 10 802 | 5489 | 11 | 2.0 | 42 309 | 19 496 | 25 | 1.3 |
| Other SGLT2i | 70 522 | 31 521 | 34 | 1.1 | 1425 | 419 | 1 | 2.4 | 5041 | 2124 | 5 | 2.4 | 21 184 | 7603 | 13 | 1.7 | |
| All non‐SGLT2i | 218 512 | 125 434 | 192 | 1.5 | 42 565 | 18 659 | 77 | 4.1 | 43 615 | 30 996 | 58 | 1.9 | 149 999 | 85 604 | 179 | 2.1 | |
| Select non‐SGLT2i | 159 012 | 76 088 | 86 | 1.1 | 21 369 | 7405 | 15 | 2.0 | 35 501 | 20 522 | 38 | 1.9 | 104 354 | 45 961 | 71 | 1.5 | |
| Intent‐to‐treat | Canagliflozin | 78 414 | 130 064 | 200 | 1.5 | 7467 | 7567 | 34 | 4.5 | 11 663 | 19 347 | 35 | 1.8 | 45 256 | 64 555 | 119 | 1.8 |
| Other SGLT2i | 80 295 | 96 911 | 135 | 1.4 | 1625 | 1665 | 7 | 4.2 | 5707 | 6665 | 15 | 2.3 | 23 270 | 26 536 | 52 | 2.0 | |
| All non‐SGLT2i | 221 744 | 323 048 | 470 | 1.5 | 43 061 | 58 119 | 291 | 5.0 | 45 018 | 70 280 | 143 | 2.0 | 151 062 | 219 005 | 480 | 2.2 | |
| Select non‐SGLT2i | 172 583 | 252 804 | 382 | 1.5 | 23 443 | 29 837 | 109 | 3.7 | 38 408 | 62 038 | 142 | 2.3 | 111 433 | 166 698 | 363 | 2.2 | |
Abbreviations: AHA, antihyperglycaemic agent; BKLE, below‐knee lower extremity; DPP‐4i, dipeptidyl peptidase‐4 inhibitor; GLP‐1, glucagon‐like peptide‐1; HHF, heart failure hospitalization; IR, incidence rate per 1000 patient‐years; CCAE, Truven MarketScan Commercial Claims and Encounters; MDCD, Truven MarketScan Multi‐state Medicaid; MDCR, Truven MarketScan Medicare Supplemental Beneficiaries; PY,patient‐years; SGLT2i, sodium glucose co‐transporter 2 inhibitors
Table 2 compares baseline characteristics of the target and comparator cohorts before and after propensity score matching across each of the 4 databases. The composition of exposed populations varied greatly among the databases; for example, the median age of canagliflozin new users was 55 years in CCAE and Optum, 50 years in MDCD and 70 years in MDCR. Across all databases, new users of canagliflozin had a history of substantial prior use of other non‐metformin AHAs, including sitagliptin (29%‐43%), glimepiride (21%‐29%), glipizide (20%‐26%), pioglitazone (13%‐25%) and insulin glargine (14%‐28%). Compared with all non‐SGLT2i new users, canagliflozin new users had a higher baseline prevalence of hyperlipidaemia and hypertension, and, accordingly, had a history of higher prior use of agents acting on the renin‐angiotensin system and lipid‐modifying agents. In MDCD, MDCR and Optum, prior to propensity score matching, a greater proportion of patients in the all non‐SGLT2i cohort had a history of certain cardiovascular diseases (ie, heart failure, cerebrovascular disease and peripheral vascular disease) compared to the canagliflozin cohort. Across all primary comparisons, propensity score adjustment was able to balance all baseline covariates, including cardiovascular disease history and amputation risk factors, to a standardized difference <0.1. All primary comparisons also passed the second diagnostic to evaluate the risk of residual bias using negative control outcomes, as empirically calibrated statistics were generally consistent with nominal values.
Table 2.
Distribution of baseline covariates across 4 databases between new users of canagliflozin and new users of all non‐SGLT2i AHAs in the overall population before and after propensity score matchinga
| CCAE | MDCD | MDCR | Optum | |||||||||||||||||||||
|---|---|---|---|---|---|---|---|---|---|---|---|---|---|---|---|---|---|---|---|---|---|---|---|---|
| Before matching | After matching | Before matching | After matching | Before matching | After matching | Before matching | After matching | |||||||||||||||||
| Canagliflozin | Non‐SGLT2i | Std. D | Canagliflozin | Non‐SGLT2i | Std. D | Canagliflozin | Non‐SGLT2i | Std. D | Canagliflozin | Non‐SGLT2i | Std. D | Canagliflozin | Non‐SGLT2i | Std. D | Canagliflozin | Non‐SGLT2i | Std. D | Canagliflozin | Non‐SGLT2i | Std. D | Canagliflozin | Non‐SGLT2i | Std. D | |
| Age group | ||||||||||||||||||||||||
| 15–19 | 0.0 | 0.3 | −0.05 | 0.1 | 0.1 | −0.01 | 0.7 | 2.0 | −0.11 | 0.7 | 0.9 | −0.02 | 0.0 | 0.1 | −0.04 | 0.0 | 0.1 | −0.04 | ||||||
| 20–24 | 0.2 | 0.7 | −0.07 | 0.2 | 0.3 | −0.01 | 0.8 | 1.8 | −0.09 | 0.8 | 0.9 | −0.01 | 0.1 | 0.3 | −0.04 | 0.1 | 0.2 | −0.01 | ||||||
| 25–29 | 0.5 | 1.3 | −0.09 | 0.5 | 0.6 | 0.00 | 2.5 | 3.7 | −0.07 | 2.7 | 2.3 | 0.03 | 0.4 | 0.8 | −0.05 | 0.4 | 0.5 | −0.01 | ||||||
| 30–34 | 1.6 | 3.2 | −0.11 | 1.7 | 1.8 | 0.00 | 5.5 | 6.3 | −0.04 | 5.7 | 5.5 | 0.00 | 1.5 | 2.1 | −0.05 | 1.6 | 1.6 | 0.00 | ||||||
| 35–39 | 4.1 | 6.1 | −0.09 | 4.3 | 4.4 | 0.00 | 9.8 | 9.0 | 0.03 | 9.9 | 9.8 | 0.00 | 3.6 | 3.8 | −0.01 | 3.7 | 3.8 | 0.00 | ||||||
| 40–44 | 8.5 | 10.0 | −0.05 | 8.8 | 8.8 | 0.00 | 13.0 | 10.4 | 0.08 | 12.7 | 12.7 | 0.00 | 0.0 | 0.0 | 0.00 | 0.0 | 0.0 | 0.00 | 7.1 | 5.9 | 0.05 | 7.1 | 7.2 | 0.00 |
| 45–49 | 14.3 | 14.5 | −0.01 | 14.4 | 14.5 | 0.00 | 15.4 | 12.3 | 0.09 | 14.7 | 15.0 | −0.01 | 0.1 | 0.0 | 0.01 | 0.1 | 0.1 | 0.01 | 11.1 | 8.6 | 0.09 | 10.8 | 11.0 | −0.01 |
| 50–54 | 20.8 | 19.4 | 0.03 | 20.6 | 20.6 | 0.00 | 17.5 | 15.8 | 0.04 | 16.9 | 17.1 | 0.00 | 0.3 | 0.2 | 0.01 | 0.3 | 0.2 | 0.01 | 15.4 | 11.2 | 0.12 | 14.6 | 14.8 | −0.01 |
| 55–59 | 24.4 | 21.6 | 0.07 | 24.0 | 23.8 | 0.01 | 16.6 | 17.0 | −0.01 | 16.9 | 16.8 | 0.00 | 1.1 | 0.7 | 0.05 | 0.9 | 1.0 | 0.00 | 18.0 | 12.4 | 0.16 | 17.2 | 17.1 | 0.00 |
| 60–64 | 23.8 | 20.9 | 0.07 | 23.4 | 23.1 | 0.01 | 12.7 | 12.7 | 0.00 | 12.9 | 12.9 | 0.00 | 2.7 | 2.0 | 0.05 | 2.4 | 2.4 | 0.00 | 15.9 | 11.8 | 0.12 | 15.4 | 15.3 | 0.00 |
| 65–69 | 1.9 | 2.0 | 0.00 | 1.9 | 1.9 | 0.00 | 3.2 | 3.2 | 0.00 | 3.5 | 3.1 | 0.02 | 40.5 | 31.6 | 0.19 | 39.4 | 40.0 | −0.01 | 12.6 | 14.6 | −0.06 | 13.2 | 13.0 | 0.01 |
| 70–74 | 1.5 | 1.8 | −0.02 | 1.6 | 1.5 | 0.01 | 31.6 | 26.3 | 0.12 | 31.4 | 31.4 | 0.00 | 8.4 | 12.1 | −0.12 | 9.2 | 9.0 | 0.01 | ||||||
| 75–79 | 0.4 | 1.3 | −0.09 | 0.5 | 0.7 | −0.03 | 14.7 | 16.7 | −0.06 | 15.6 | 15.0 | 0.02 | 3.8 | 7.5 | −0.16 | 4.3 | 4.1 | 0.01 | ||||||
| 80–84 | 0.3 | 0.8 | −0.08 | 0.2 | 0.5 | −0.04 | 6.1 | 11.9 | −0.20 | 6.6 | 6.5 | 0.01 | 1.4 | 4.8 | −0.19 | 1.7 | 1.6 | 0.01 | ||||||
| 85–89 | 0.1 | 0.7 | −0.09 | 0.1 | 0.2 | −0.02 | 2.3 | 7.0 | −0.23 | 2.5 | 2.5 | 0.00 | 0.6 | 3.7 | −0.22 | 0.7 | 0.7 | 0.00 | ||||||
| Female gender | 44.9 | 45.9 | −0.02 | 45.4 | 45.3 | 0.00 | 65.0 | 64.4 | 0.01 | 64.7 | 65.0 | −0.01 | 42.0 | 46.3 | −0.09 | 42.7 | 42.9 | −0.01 | 43.3 | 45.6 | −0.05 | 44.1 | 43.7 | 0.01 |
| Prior outcomes | ||||||||||||||||||||||||
| HHF | 0.3 | 0.7 | −0.06 | 0.3 | 0.3 | 0.00 | 1.4 | 2.7 | −0.10 | 1.4 | 1.4 | −0.01 | 1.1 | 3.5 | −0.16 | 1.2 | 1.1 | 0.01 | 0.8 | 2.6 | −0.14 | 0.8 | 0.8 | 0.00 |
| BKLE amputations | 0.1 | 0.2 | −0.01 | 0.1 | 0.1 | 0.00 | 0.3 | 0.5 | −0.03 | 0.3 | 0.4 | −0.02 | 0.2 | 0.2 | −0.01 | 0.2 | 0.1 | 0.00 | 0.2 | 0.3 | −0.02 | 0.2 | 0.2 | 0.00 |
| Amputation risk factors | ||||||||||||||||||||||||
| Cellulitis of lower limb | 2.3 | 2.6 | −0.02 | 2.2 | 2.2 | 0.00 | 5.4 | 5.3 | 0.00 | 5.2 | 5.2 | 0.00 | 3.0 | 4.2 | −0.07 | 2.9 | 3.0 | −0.01 | 2.8 | 3.5 | −0.04 | 2.6 | 2.7 | 0.00 |
| Osteomyelitis | 0.3 | 0.4 | −0.03 | 0.2 | 0.3 | 0.00 | 0.7 | 1.1 | −0.04 | 0.7 | 0.7 | 0.00 | 0.3 | 0.8 | −0.06 | 0.3 | 0.4 | −0.02 | 0.4 | 0.7 | −0.04 | 0.4 | 0.4 | −0.01 |
| Ulcer of lower extremity | 1.2 | 1.2 | 0.00 | 1.1 | 1.1 | 0.00 | 3.1 | 3.4 | −0.02 | 2.7 | 2.9 | −0.01 | 2.5 | 3.9 | −0.08 | 2.3 | 2.5 | −0.01 | 1.6 | 2.6 | −0.07 | 1.5 | 1.5 | 0.00 |
| Peripheral vascular disease | 8.6 | 8.0 | 0.02 | 7.9 | 8.1 | −0.01 | 14.1 | 14.5 | −0.01 | 13.5 | 13.7 | −0.01 | 24.4 | 29.3 | −0.11 | 23.8 | 24.1 | −0.01 | 13.9 | 18.6 | −0.13 | 13.8 | 13.8 | 0.00 |
| Neurologic disorder associated with DM | 10.7 | 6.5 | 0.15 | 8.5 | 8.9 | −0.01 | 24.6 | 14.6 | 0.25 | 21.1 | 22.1 | −0.03 | 19.8 | 13.1 | 0.18 | 17.1 | 17.9 | −0.02 | 16.5 | 12.6 | 0.11 | 14.9 | 15.1 | −0.01 |
| General medical history | ||||||||||||||||||||||||
| Hyperlipidaemia | 75.4 | 61.8 | 0.30 | 73.1 | 73.0 | 0.00 | 71.8 | 53.5 | 0.38 | 69.5 | 70.5 | −0.02 | 76.6 | 69.3 | 0.17 | 75.0 | 76.0 | −0.03 | 81.9 | 71.8 | 0.24 | 80.2 | 79.9 | 0.01 |
| Hypertensive disorder | 72.9 | 64.6 | 0.18 | 71.4 | 71.3 | 0.00 | 78.5 | 72.3 | 0.15 | 77.4 | 77.7 | −0.01 | 82.7 | 81.0 | 0.04 | 81.6 | 82.7 | −0.03 | 78.5 | 75.0 | 0.08 | 77.3 | 77.0 | 0.01 |
| Renal impairment | 3.6 | 5.5 | −0.09 | 3.5 | 3.5 | 0.00 | 6.6 | 13.3 | −0.22 | 6.8 | 6.7 | 0.00 | 10.6 | 21.1 | −0.29 | 11.2 | 11.0 | 0.01 | 8.6 | 16.0 | −0.23 | 8.8 | 8.6 | 0.01 |
| Atrial fibrillation | 1.9 | 2.2 | −0.01 | 1.9 | 1.9 | 0.00 | 2.8 | 4.0 | −0.07 | 3.0 | 2.7 | 0.02 | 9.3 | 15.1 | −0.18 | 9.7 | 9.6 | 0.00 | 3.4 | 7.2 | −0.17 | 3.6 | 3.5 | 0.01 |
| Cerebrovascular disease | 1.6 | 2.1 | −0.03 | 1.6 | 1.7 | −0.01 | 4.5 | 6.8 | −0.10 | 4.6 | 4.4 | 0.01 | 4.8 | 8.9 | −0.16 | 5.0 | 4.9 | 0.00 | 2.6 | 5.3 | −0.14 | 2.8 | 2.7 | 0.00 |
| Coronary arteriosclerosis | 8.2 | 7.2 | 0.04 | 7.7 | 7.7 | 0.00 | 12.9 | 12.4 | 0.01 | 12.4 | 12.0 | 0.01 | 25.3 | 27.5 | −0.05 | 24.6 | 24.5 | 0.00 | 11.8 | 15.4 | −0.11 | 11.8 | 11.5 | 0.01 |
| Heart disease | 17.6 | 17.5 | 0.00 | 16.9 | 17.0 | 0.00 | 27.2 | 31.0 | −0.08 | 26.9 | 26.6 | 0.01 | 42.7 | 49.8 | −0.14 | 42.1 | 42.3 | 0.00 | 23.4 | 31.4 | −0.18 | 23.5 | 23.3 | 0.00 |
| Ischemic heart disease | 4.0 | 4.4 | −0.02 | 3.9 | 3.9 | 0.00 | 8.1 | 9.1 | −0.03 | 7.9 | 7.9 | 0.00 | 10.2 | 13.4 | −0.10 | 10.2 | 10.1 | 0.00 | 6.1 | 9.2 | −0.12 | 6.2 | 6.0 | 0.00 |
Abbreviations: AHA, antihyperglycemic agent; BKLE, below‐knee lower extremity; DM, diabetes mellitus; HHF, hospitalization for heart failure; CCAE, Truven MarketScan Commercial Claims and Encounters; MDCD, Truven MarketScan Multi‐state Medicaid; MDCR, Truven MarketScan Medicare Supplemental Beneficiaries; SGLT2i, sodium glucose co‐transporter 2 inhibitors; Std. D, standardized difference
All data are n (%) except for Std. D.
Table 3 shows results of the time‐to‐first‐post‐index HHF analyses. The HR (95% CI) for the meta‐analytic estimate for HHF comparing new users of canagliflozin vs new users of all non‐SGLT2i within the on‐treatment period was 0.39 (0.26‐0.60). When comparing new users of canagliflozin and new users of select non‐SGLT2i AHA in an on‐treatment analysis, the HR (95% CI) was 0.58 (0.42‐0.80). In the meta‐analysis of all 4 databases, no difference in risk of HHF was observed between new users of canagliflozin and new users of other SGLT2i (HR [95% CI]: on‐treatment, 0.90 [0.71‐1.13] and intent‐to‐treat, 1.07 [0.95‐1.20]).
Table 3.
Risk of HHF in the overall population for selected comparisons during on‐treatment and intent‐to‐treat time‐at‐risk periodsa
| On‐treatment | Intent‐to‐treat | ||||||||||||
|---|---|---|---|---|---|---|---|---|---|---|---|---|---|
| Exposure (n/PY) | Outcomes | Outcomes | |||||||||||
| Comparison | Source | Target | Comparator | Target | Comparator | HR (95% CI) | P | Calibrated P | Target | Comparator | HR (95% CI) | P | Calibrated P |
| Canagliflozin vs all non‐SGLT2i | CCAE | 60 073/29 969 | 217 583/125 090 | 23 | 448 | 0.27 (0.16‐0.44) | <.01 | <.01 | 202 | 1103 | 0.63 (0.52‐0.75) | <.01 | <.01 |
| MDCD | 5998/1780 | 38 172/16 353 | 9 | 367 | 0.48 (0.21‐0.95) | .06 | .09 | 73 | 942 | 0.94 (0.70‐1.25) | .70 | .93 | |
| MDCR | 9206/4703 | 42 744/30 367 | 28 | 649 | 0.52 (0.33‐0.79) | <.01 | .01 | 192 | 1560 | 0.83 (0.69‐1.00) | .05 | .17 | |
| Optum | 36 055/16 663 | 146 868/83 692 | 64 | 1515 | 0.38 (0.28‐0.51) | <.01 | <.01 | 343 | 3476 | 0.73 (0.63‐0.83) | <.01 | <.01 | |
| Meta‐analysis | 111 332/53 116 | 445 367/255 504 | 124 | 2979 | 0.39 (0.26‐0.60)I2 = 0.25 | .01 | <.01 | 810 | 7081 | I2 = 0.59 | |||
| Canagliflozin vs select non‐SGLT2i | CCAE | 64 795/32 246 | 158 992/76 046 | 27 | 206 | 0.40 (0.24‐0.65) | <.01 | <.01 | 245 | 816 | 0.76 (0.64‐0.90) | <.01 | <.01 |
| MDCD | 6727/1997 | 21 355/7374 | 11 | 104 | 0.62 (0.27‐1.27) | .23 | .26 | 80 | 453 | 0.88 (0.65‐1.17) | .38 | .41 | |
| MDCR | 10 217/5218 | 35 398/20 312 | 30 | 425 | 0.61 (0.38‐0.93) | .03 | .06 | 220 | 1400 | 0.85 (0.72‐1.01) | .07 | .10 | |
| Optum | 39 142/18 069 | 104 231/45 694 | 66 | 767 | 0.64 (0.46‐0.87) | .01 | .01 | 369 | 2695 | 0.82 (0.71‐0.93) | <.01 | .01 | |
| Meta‐analysis | 120 881/57 531 | 319 976/149 427 | 134 | 1502 | 0.58 (0.42‐0.80)I2 = 0.00 | .01 | <.01 | 914 | 5364 | 0.82 (0.75‐0.89)I2 = 0.00 | .01 | <.01 | |
| Canagliflozin vs other SGLT2i | CCAE | 43 411/20 314 | 70 519/31 524 | 19 | 37 | 0.85 (0.41‐1.71) | .65 | .61 | 142 | 181 | 1.02 (0.79‐1.32) | .89 | .95 |
| MDCD | 1424/404 | 1425/418 | 2 | 3 | 1.00 (0.12‐8.33) | 1.00 | .86 | 19 | 16 | 1.18 (0.53‐2.69) | .69 | .62 | |
| MDCR | 4395/2000 | 5041/2124 | 8 | 12 | 1.15 (0.39‐3.41) | .80 | .75 | 63 | 54 | 1.21 (0.78‐1.90) | .40 | .57 | |
| Optum | 20 324/8644 | 21 184/7599 | 27 | 21 | 0.83 (0.37‐1.82) | .64 | .64 | 128 | 130 | 1.07 (0.79‐1.45) | .67 | .73 | |
| Meta‐analysis | 69 554/31 363 | 98 169/41 667 | 56 | 73 | 0.90 (0.71‐1.13)I2 = 0.00 | .22 | .28 | 352 | 381 | 1.07 (0.95‐1.20)I2 = 0.00 | .16 | .32 | |
| Other SGLT2i vs all non‐SGLT2i | CCAE | 54 324/24 645 | 175 500/96 608 | 26 | 336 | 0.39 (0.24‐0.60) | <.01 | <.01 | 131 | 790 | 0.54 (0.42‐0.68) | <.01 | <.01 |
| MDCD | 1378/405 | 25 995/10 044 | 3 | 195 | 0.80 (0.19‐2.21) | .72 | .73 | 16 | 444 | 0.82 (0.44‐1.41) | .51 | .49 | |
| MDCR | 4336/1837 | 31 228/21 323 | 11 | 434 | 0.54 (0.27‐0.98) | .06 | .12 | 50 | 938 | 0.66 (0.47‐0.92) | .02 | .06 | |
| Optum | 19 588/7072 | 118 027/63 631 | 21 | 1103 | 0.38 (0.23‐0.59) | <.01 | <.01 | 124 | 2346 | 0.64 (0.51‐0.79) | <.01 | <.01 | |
| Meta‐analysis | 79 626/33 961 | 350 750/191 607 | 61 | 2068 | 0.43 (0.30‐0.62) I2 = 0.00 |
.01 | <.01 | 321 | 4518 | 0.62 (0.50‐0.75) I2 = 0.00 |
<.01 | <.01 | |
Abbreviations: BKLE, below‐knee lower extremity; CI, confidence interval; HR, hazard ratio; CCAE, Truven MarketScan Commercial Claims and Encounters; MDCD, Truven MarketScan Multi‐state Medicaid; MDCR, Truven MarketScan Medicare Supplemental Beneficiaries; PY, patient‐years; SGLT2i, sodium glucose co‐transporter 2 inhibitors.
Time‐to‐first‐post‐index‐event analysis using variable‐ratio propensity score matching.
Table 4 shows the results of the time‐to‐first‐post‐index BKLE amputation analyses. The HR (95% CI) for the meta‐analytic estimate of BKLE amputation comparing new users of canagliflozin vs new users of all non‐SGLT2i was 0.75 (0.40‐1.41) in the on‐treatment analysis and 1.01 (0.93‐1.10) in the intent‐to‐treat analysis. No differences were observed between canagliflozin and other SGLT2i in any database in the on‐treatment or intent‐to‐treat analyses. The HR (95% CI) for the meta‐analytic estimate for BKLE amputation of canagliflozin vs empagliflozin or dapagliflozin was 1.14 (0.67‐1.93) in the on‐treatment analysis and 1.13 (0.99‐1.29) in the intent‐to‐treat analysis. Kaplan–Meier plots for the on‐treatment analysis within each database across the HHF and BKLE amputation outcomes are shown in Figure 1.
Table 4.
Risk of BKLE amputation in the overall population for selected comparisons during on‐treatment and intent‐to‐treat time‐at‐risk periodsa
| On‐treatment | Intent‐to‐treat | ||||||||||||
|---|---|---|---|---|---|---|---|---|---|---|---|---|---|
| Exposure (n/PY) | Outcomes | Outcomes | |||||||||||
| Comparison | Source | Target | Comparator | Target | Comparator | HR (95% CI) | P | Calibrated P | Target | Comparator | HR (95% CI) | P | Calibrated P |
| Canagliflozin vs all non‐SGLT2i | CCAE | 60 073/29 965 | 217 583/125 189 | 24 | 190 | 0.56 (0.32‐0.92) | .03 | .06 | 144 | 467 | 1.01 (0.80‐1.28) | .92 | .85 |
| MDCD | 5998/1775 | 38 172/16 482 | 10 | 61 | 1.35 (0.46‐3.41) | .56 | .46 | 30 | 236 | 1.05 (0.62‐1.73) | .84 | .71 | |
| MDCR | 9206/4707 | 42 744/30 668 | 9 | 57 | 1.16 (0.48‐2.66) | .73 | .62 | 26 | 138 | 0.88 (0.51‐1.47) | .65 | .77 | |
| Optum | 36 055/16 676 | 146 868/84 306 | 17 | 173 | 0.67 (0.35‐1.18) | .19 | .31 | 95 | 467 | 1.03 (0.78‐1.36) | .82 | .71 | |
| Meta‐analysis | 111 332/53 125 | 445 367/256 646 | 60 | 481 | 0.75 (0.40‐1.41)I2 = 0.18 | .25 | .30 | 295 | 1308 | 1.01 (0.93‐1.10)I2 = 0.00 | .71 | .51 | |
| Canagliflozin vs select non‐SGLT2i | CCAE | 64 795/32 238 | 158 992/76 081 | 34 | 86 | 1.08 (0.65‐1.75) | .76 | .68 | 171 | 382 | 0.96 (0.77‐1.21) | .75 | .78 |
| MDCD | 6727/1993 | 21 355/7401 | 10 | 15 | 3.11 (0.87‐11.70) | .09 | .08 | 34 | 109 | 1.21 (0.73‐1.97) | .45 | .43 | |
| MDCR | 10 217/5222 | 35 398/20 471 | 11 | 37 | 0.60 (0.19‐1.64) | .36 | .42 | 34 | 142 | 0.78 (0.48‐1.24) | .31 | .33 | |
| Optum | 39 142/18 081 | 104 231/45 912 | 23 | 71 | 1.30 (0.64‐2.55) | .46 | .42 | 110 | 363 | 1.10 (0.84‐1.44) | .49 | .46 | |
| Meta‐analysis | 120 881/57 536 | 319 976/149 866 | 78 | 209 | 1.17 (0.55‐2.47)I2 = 0.21 | .56 | .43 | 349 | 996 | 1.01 (0.81‐1.25)I2 = 0.00 | .93 | .86 | |
| Canagliflozin vs other SGLT2i | CCAE | 43 411/20 312 | 70 519/31 520 | 19 | 34 | 0.88 (0.38‐2.01) | .77 | .73 | 102 | 135 | 1.13 (0.81‐1.57) | .46 | .50 |
| MDCD | 1424/403 | 1425/419 | 3 | 1 | 2.00 (0.19‐43.01) | .62 | .52 | 8 | 7 | 1.25 (0.33‐5.05) | .75 | .70 | |
| MDCR | 4395/2000 | 5041/2123 | 6 | 5 | 1.73 (0.28‐13.34) | .58 | .55 | 15 | 15 | 1.38 (0.58‐3.39) | .47 | .56 | |
| Optum | 20 324/8652 | 21 184/7603 | 12 | 13 | 1.40 (0.49‐4.28) | .54 | .54 | 46 | 52 | 1.06 (0.67‐1.68) | .82 | .85 | |
| Meta‐analysis | 69 554/31 369 | 98 169/41 666 | 40 | 53 | 1.14 (0.67‐1.93)I2 = 0.00 | .48 | .53 | 171 | 209 | 1.13 (0.99‐1.29)I2 = 0.00 | .06 | .06 | |
| Other SGLT2i vs all non‐SGLT2i | CCAE | 54 324/24 642 | 175 500/96 683 | 23 | 143 | 0.59 (0.32‐1.04) | .08 | .14 | 87 | 327 | 0.78 (0.57‐1.04) | .09 | .15 |
| MDCD | 1378/405 | 25 995/10 106 | 0 | 28 | 0.36 (NA‐5.96) | — | — | 5 | 111 | 0.99 (0.33‐2.39) | .98 | .96 | |
| MDCR | 4336/1837 | 31 228/21 522 | 4 | 37 | 1.65 (0.37‐5.26) | .46 | .39 | 13 | 85 | 1.56 (0.72‐3.12) | .23 | .17 | |
| Optum | 19 588/7076 | 118 027/64 041 | 12 | 115 | 1.02 (0.49‐1.98) | .95 | .77 | 45 | 306 | 1.31 (0.88‐1.89) | .17 | .13 | |
| Meta‐analysis | 78 248/33 556 | 324 755/182 247 | 39 | 295 | 0.84 (0.27‐2.55)I2 = 0.23 | .57 | .68 | 150 | 829 | I2 = 0.51 | |||
Abbreviations: BKLE, below‐knee lower extremity; CI, confidence interval; HR, hazard ratio; CCAE, Truven MarketScan Commercial Claims and Encounters; MDCD, Truven MarketScan Multi‐state Medicaid; MDCR, Truven MarketScan Medicare Supplemental Beneficiaries; NA, not available; PY, patient‐years; SGLT2i, sodium glucose co‐transporter 2 inhibitors.
Time‐to‐first‐post‐index‐event analysis using variable‐ratio propensity score matching.
Figure 1.
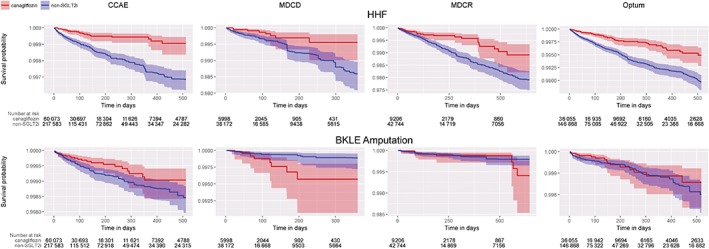
Kaplan–Meier plots for on‐treatment comparisons of canagliflozin vs all non‐SGLT2i for HHF and BKLE amputation. Abbreviations: CCAE, Truven MarketScan Commercial Claims and Encounters; MDCD, Truven MarketScan Multi‐state Medicaid; MDCR, Truven MarketScan Medicare Supplemental Beneficiaries; ITT, intent‐to‐treat; BKLE, below‐knee lower extremity; HHF, hospitalization for heart failure
3.2. Subpopulation with established cardiovascular disease
In the subpopulation with established cardiovascular disease, there were 43 043 new users of canagliflozin, 31 011 new users of other SGLT2i and 141 579 new users of all non‐SGLT2i AHAs across the 4 databases. The median time‐at‐risk for canagliflozin new users with established cardiovascular disease ranged across databases from 60 to 99 days in the on‐treatment period, and from 325 to 581 days in the intent‐to‐treat period. The incidence rates of BKLE amputation and HHF in the subpopulation with established cardiovascular disease were generally observed to be approximately double those in the overall new user cohorts.
The requirement for patients to have established cardiovascular disease at baseline tended to make the populations more comparable prior to propensity score adjustment, although some imbalances remained. For example, compared to all non‐SGLT2i new users, canagliflozin new users with established cardiovascular disease had a lower baseline prevalence of renal impairment and urinary tract disease. As with the overall population, propensity score matching achieved balance across all baseline covariates with remaining standardized differences less than 0.1.
Effect estimates in the subpopulation with established cardiovascular disease were consistent with those in the overall population (Table S1). Effect estimates for HHF were consistent with the overall population, with the comparison between new users of canagliflozin and all non‐SGLT2i yielding a statistically significant decreased risk (on‐treatment HR [95% CI], 0.44 [0.36‐0.54]) (Table S2). However, no difference was seen when comparing canagliflozin and other SGLT2i (on‐treatment HR [95% CI], 0.70 [0.30‐1.63]). Of note, 75% of the HHF events occurred in the 30% of the overall exposed population with established cardiovascular disease.
The meta‐analytic effect estimates for BKLE amputation in the subpopulation with established cardiovascular disease were consistent with findings in the overall population for new users of canagliflozin vs new users of all non‐SGLT2i in the on‐treatment analysis (HR [95% CI], 0.72 [0.34‐1.51]) and the intent‐to‐treat analysis (HR [95% CI], 1.14 [0.89‐1.46]) (Table S3). When comparing canagliflozin and other SGLT2i, there was no difference in either the meta‐analysis or source‐specific estimates in the on‐treatment analysis (meta‐analysis HR [95% CI], 1.08 [0.63‐1.82]) or the intent‐to‐treat analysis (meta‐analysis HR [95% CI], 0.99 [0.68‐1.46]).
3.3. Sensitivity analyses
Figure 2 highlights the range of effect estimates for the risk of BKLE amputation from all sensitivity analyses across databases and time‐at‐risk periods. Across all analyses, there is no consistent evidence to suggest any difference in risk of BKLE amputation between canagliflozin and empagliflozin or dapagliflozin. Additionally, the comparison between canagliflozin and all non‐SGLT2i did not reveal any consistent differences across databases. For both the canagliflozin vs non‐SGLT2i comparisons and the other SGLT2i vs non‐SGLT2i comparisons, point estimates from the MDCD database indicated the potential for increased risk of BKLE amputation, although most estimates were not statistically significant. Effect estimates in the overall population were consistent with those in the subpopulation with established cardiovascular disease.
Figure 2.
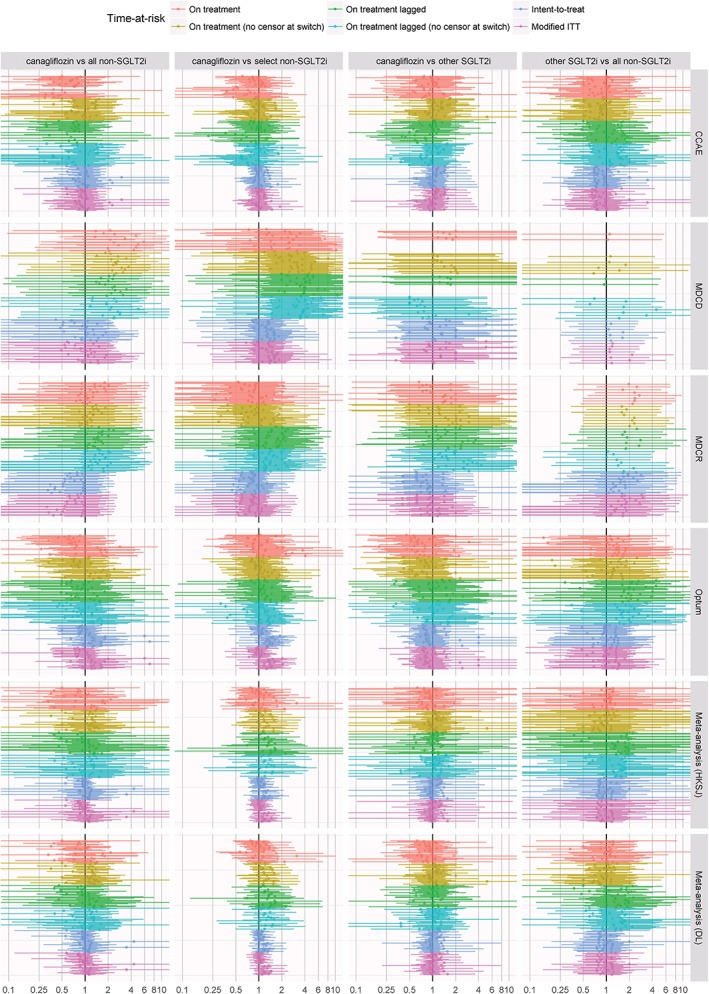
Forest plot of effect estimates for risk of amputation from all sensitivity analyses across databases and time‐at‐risk periods. Abbreviations: CCAE, Truven MarketScan Commercial Claims and Encounters; MDCD, Truven MarketScan Multi‐state Medicaid; MDCR, Truven MarketScan Medicare Supplemental Beneficiaries; ITT, intent‐to‐treat; SGLT2i, sodium glucose co‐transporter 2 inhibitors; HKSJ, Hartung‐Knapp‐Sidik‐Jonkman; DL, DerSimonian‐Laird
Across all analyses, there is no evidence suggesting any difference in risk of HHF between canagliflozin and empagliflozin or dapagliflozin (Figure S1). For both the canagliflozin vs non‐SGLT2i comparisons and the other SGLT2i vs non‐SGLT2i comparisons, SGLT2i showed a consistent decreased risk of HHF relative to non‐SGLT2i, with on‐treatment estimates showing a larger decrease in risk than that with intent‐to‐treat analyses. As with BKLE amputation, effect estimates for HHF in the overall population were consistent with those in the subpopulation with established cardiovascular disease. For all analyses where meta‐analytic estimates were produced, the relative contribution of each source to the composite summary can be evaluated by assessing the source‐specific estimates and variances in the interactive tool available at http://data.ohdsi.org/AhasHfBkleAmputation.
4. DISCUSSION
OBSERVE‐4D is a retrospective observational study representing the largest and most comprehensive evaluation of the comparative effects of canagliflozin and other SGLT2i to date. By comparing the real‐world experience of more than 140 000 patients initiating canagliflozin with that of more than 100 000 new users of empagliflozin or dapagliflozin and more than 460 000 new users of non‐SGLT2i, we can further characterize the potential benefits and harms of SGLT2i as observed in routine clinical practice, to complement evidence generated by randomized trials and prior observational studies. The use of 4 different administrative claims databases representing multiple segments of the US health care system, including privately‐insured populations, patients supported through state Medicaid programmes and patients qualifying for national Medicare coverage, and the consistency of results across these databases provide reassurance concerning the generalizability of these real‐world findings.
To our knowledge, this study represents the first analysis providing direct head‐to‐head comparative evidence for HHF or BKLE amputation among individual drugs within the SGLT2i class. The analyses revealed a consistent pattern that suggests a class effect of SGLT2i that reduces the risk of HHF relative to non‐SGLT2i, both overall and within the subpopulation with established cardiovascular disease. Compared with new users of a DPP‐4i or GLP‐1 receptor agonist, new users of canagliflozin had a lower risk of HHF in the on‐treatment and intent‐to‐treat analyses; the magnitude of the effect was similar to that observed when comparing new users of empagliflozin or dapagliflozin and new users of non‐SGLT2i. No difference in HHF was observed in the head‐to‐head comparison of canagliflozin and other SGLT2i within any database, subgroup or time‐at‐risk period.
Neither canagliflozin nor the other SGLT2i showed a consistent increased risk of BKLE amputation relative to non‐SGLT2i in either the overall population or within the subpopulation of patients with established cardiovascular disease, although none of the analyses was sufficiently powered to rule out the possibility of a modest effect. This study also provided the first real‐world comparison of the risk of BKLE amputation with the use of canagliflozin relative to the use of other SGLT2i, and found no statistically or clinically significant differences in any database in either the on‐treatment or intent‐to‐treat analyses.
HHF findings from this study are consistent with those from the CANVAS Program and EASEL study for canagliflozin, from the EMPA‐REG OUTCOME study for empagliflozin and from the CVD‐REAL analysis of SGLT2i more broadly.1, 3, 5, 8 Thus, the HHF result is a positive confirmatory finding; the consistency with clinical trial results supports the internal validity and gives us a level of confidence that a positive association could be successfully identified if present. Empirical calibration using 44 negative control outcomes provides support that our study design was unlikely to yield spurious associations with false positive findings as the result of systematic or random error. It is noteworthy that, in this study, the decreased risk of HHF was consistent among all new users, as well as within the subpopulation with established cardiovascular disease, even in light of the substantial increase in baseline risk for patients with established cardiovascular disease. It is also noteworthy that the effect estimates showed little heterogeneity across databases, and were robust in a wide array of sensitivity analyses. As expected and observed elsewhere, the magnitude of the effect is smaller in the intent‐to‐treat analyses than in the on‐treatment analyses, but it is nonetheless encouraging to see the decrease in risk of HHF persist for some period, even after treatment discontinuation or switching.
The comparative safety results for amputation are less concordant with prior studies and warrant further scrutiny. An increased risk of BKLE amputation with the use of canagliflozin was identified during the CANVAS Program, which included patients with established cardiovascular disease or high cardiovascular risk.1 In the CANVAS Program, the increased risk of amputation began to emerge after 6 to 12 months of exposure.1 Increased risk of BKLE amputation was not observed in any other studies across the phase 3/4 canagliflozin development programme, although there was limited power to evaluate risk in this population.7 In the CANVAS Program, the incidence rates for amputation were 6.3 and 3.4 participants per 1000 patient‐years with canagliflozin and placebo, respectively, over a median follow‐up period of 126 weeks, and the HR (95% CI) was 1.97 (1.41‐2.75).1 Despite differences in the observed HRs, the CIs for the CANVAS Program and this study overlap. Compared with the CANVAS Program, this study had a lower event rate (1‐5 events per 1000 person‐years, on‐treatment and in the overall population) and a shorter follow‐up time (median, 60‐100 days on‐treatment). Therefore, the current study had limited statistical power to detect differences in the 6 to 12‐month period, the time at which amputation risk began to emerge in the CANVAS Program, particularly in patients with established cardiovascular disease. This discrepancy may be a limitation, as a constant risk assumption may be violated and the potential effect may require additional observation time before being detectable in a manner that is in line with the trial. On the other hand, it may be revealing that real‐world utilization of these drugs suggests that the continuous exposure periods observed in clinical practice are often shorter than the point at which the purported risk may take effect. It is also possible that differences in the risk of BKLE amputation could be attributable to the composition of the patient population, as patients who opt to participate in clinical trials may not always reflect the general population. When attempting to reconcile these results with those of the EASEL study, it is worth highlighting that the EASEL population was older than that of CCAE, Optum and MDCD, and the EASEL study had a slightly longer median follow‐up time.8 Also, between the 2 cohorts, the EASEL study included only 17 events in the on‐treatment analysis and 35 events in the intent‐to‐treat analysis in the SGLT2i cohort,8 whereas this study included 33 on‐treatment and 163 intent‐to‐treat events among the cohort of new users of canagliflozin with established cardiovascular disease across the 4 databases. Relative to the EASEL study, this analysis also conducted a larger array of sensitivity analyses to assess the robustness of findings.
This study is subject to the limitations typical of observational database research, including the potential for unmeasured confounding and misclassification error that could bias the findings; however, the use of negative controls suggests little to no systematic error. Because the results were largely consistent across 4 databases, any such source of systematic error could be attributable to artifacts associated with the administrative claims process or consistent provider channeling behaviour that would persist independent of insurance coverage. No source record validation was performed to validate exposures, outcomes or baseline covariates, and it is possible that differential bias may have affected these attributes.
In this large observational study, treatment with canagliflozin was associated with lower risk of HHF than non‐SGLT2i, and the risk of HHF with canagliflozin was comparable to that with other SGLT2i. There were no observed differences in risk of BKLE amputation among canagliflozin, other SGLT2i or all non‐SGLT2i, in either the overall population or the subpopulation with established cardiovascular disease. Overall, these results suggest that canagliflozin has a profile similar to other SGLT2i as used in routine clinical practice. Patients and providers may find this information useful when weighing the comparative benefits against the potential risks in making treatment decisions to support diabetes care.
Supporting information
Table S1. Crude Incidence Rate (Per 1000 Patient‐years) of HHF and BKLE Amputation in the Subpopulation With Established Cardiovascular Disease for New Users of: (1) Canagliflozin, (2) Empagliflozin or Dapagliflozin (Other SGLT2i), (3) All Non‐SGLT2i, and (4) Select Non‐SGLT2i (DPP‐4i, GLP‐1 Receptor Agonist, or Other AHA) During the On‐treatment and Intent‐to‐treat Time‐at‐risk Periods.
Table S2. Risk of HHF in the Subpopulation with Established Cardiovascular Disease for Selected Comparisons During the On‐treatment and Intent‐to‐treat Time‐at‐risk Periods.†
Table S3. Risk of BKLE Amputation in the Subpopulation with Established Cardiovascular Disease for Selected Comparisons During the On‐treatment and Intent‐to‐treat Time‐at‐risk Periods†
Figure S1. Forest plot of effect estimates for the risk of heart failure from all sensitivity analyses across databases and time‐at‐risk periods.
ACKNOWLEDGMENTS
The authors thank Jeff Yang and Til Stürmer for their helpful discussions and feedback concerning these analyses.
Editorial support was provided by Dana Tabor, PhD and Kimberly Dittmar, PhD of MedErgy, which was funded by Janssen Global Services, LLC.
Conflict of interest
Canagliflozin was developed by Janssen Research & Development, LLC, in collaboration with Mitsubishi Tanabe Pharma Corporation.
P. B. R., M. J. S., F. D., Z. Y., P. E. S. and N. R. are full‐time employees of Janssen Research & Development, LLC. J. A. B. is a full‐time employee of Johnson & Johnson, LLC.
J. B. B. has received contracted consulting fees, paid to his institution, and travel support from Adocia, AstraZeneca, Dexcom, Elcelyx Therapeutics, Eli Lilly, Intarcia Therapeutics, Lexicon, Metavention, NovaTarg, Novo Nordisk, Sanofi, Senseonics and vTv Therapeutics; has received grant support from AstraZeneca, Boehringer Ingelheim, Johnson & Johnson, Lexicon, Novo Nordisk, Sanofi, Theracos and vTv Therapeutics; holds stock options in Mellitus Health and PhaseBio; has served on the board of the AstraZeneca HealthCare Foundation; and is supported by a grant from the National Institutes of Health (UL1TR002489).
Author contributions
P. B. R., M. J. S., F. D., Z. Y., P. E. S., J. A. B. and N. R. were involved in the design of the study, collection of data or analysis of data, and preparation of the final manuscript. J. B. B. was involved in the analysis and interpretation of data and the preparation of the final manuscript.
Ryan PB, Buse JB, Schuemie MJ, et al. Comparative effectiveness of canagliflozin, SGLT2 inhibitors and non‐SGLT2 inhibitors on the risk of hospitalization for heart failure and amputation in patients with type 2 diabetes mellitus: A real‐world meta‐analysis of 4 observational databases (OBSERVE‐4D). Diabetes Obes Metab. 2018;20:2585–2597. 10.1111/dom.13424
Funding information This study was supported by Janssen Research & Development, LLC.
REFERENCES
- 1. Neal B, Perkovic V, Mahaffey KW, et al. Canagliflozin and cardiovascular and renal events in type 2 diabetes. N Engl J Med. 2017;377:644‐657. [DOI] [PubMed] [Google Scholar]
- 2. Neal B, Perkovic V, Mahaffey KW, de Zeeuw D, Fulcher G, Matthews DR. The Integrated Results of the CANVAS Program. Presented at: The 77th Scientific Sessions of the American Diabetes Association (ADA); June 12, 2017; San Diego, CA. https://professional.diabetes.org/sites/professional.diabetes.org/files/media/2017_press_program_ppt_neal-final.pdf. Accessed December 5, 2017.
- 3. Zinman B, Wanner C, Lachin JM, et al. Empagliflozin, cardiovascular outcomes, and mortality in type 2 diabetes. N Engl J Med. 2015;373:2117‐2128. [DOI] [PubMed] [Google Scholar]
- 4. Inzucchi SE, Iliev H, Pfarr E, Zinman B. Empagliflozin and assessment of lower‐limb amputations in the EMPA‐REG OUTCOME trial. Diabetes Care. 2018;41:e4‐e5. [DOI] [PubMed] [Google Scholar]
- 5. Kosiborod M, Cavender MA, Fu AZ, et al. Lower risk of heart failure and death in patients initiated on SGLT‐2 inhibitors versus other glucose‐lowering drugs: the CVD‐REAL Study. Circulation. 2017;136:249‐259. [DOI] [PMC free article] [PubMed] [Google Scholar]
- 6. Patorno E, Goldfine AB, Schneeweiss S, et al. Cardiovascular outcomes associated with canagliflozin versus other non‐gliflozin antidiabetic drugs: population based cohort study. BMJ. 2018;360:k119. [DOI] [PMC free article] [PubMed] [Google Scholar]
- 7. Yuan Z, Defalco FJ, Ryan PB, et al. Risk of lower extremity amputations in patients with type 2 diabetes mellitus treated with SGLT2 inhibitors in the United States: a retrospective cohort study. Diabetes Obes Metab. 2018;20:582‐589. [DOI] [PMC free article] [PubMed] [Google Scholar]
- 8. Udell JA, Yuan Z, Rush T, Sicignano NM, Galitz M, Rosenthal N. Cardiovascular outcomes and risks after initiation of a sodium glucose co‐transporter 2 inhibitor: results from the EASEL population‐based cohort study. Circulation. 2017;137:1450‐1459. [DOI] [PMC free article] [PubMed] [Google Scholar]
- 9. Schuemie MJ, Ryan PB, DuMouchel W, Suchard MA, Madigan D. Interpreting observational studies: why empirical calibration is needed to correct p‐values. Stat Med. 2014;33:209‐218. [DOI] [PMC free article] [PubMed] [Google Scholar]
- 10. Ryan PB, Schuemie MJ, Welebob E, Duke J, Valentine S, Hartzema AG. Defining a reference set to support methodological research in drug safety. Drug Saf. 2013;36(suppl 1):S33‐S47. [DOI] [PubMed] [Google Scholar]
- 11. Suchard MA, Simpson SE, Zorych I, Ryan P, Madigan D. Massive parallelization of serial inference algorithms for a complex generalized linear model. ACM Trans Model Comput Simul. 2013;23:1‐17. 10.1145/2414416.2414791. [DOI] [PMC free article] [PubMed] [Google Scholar]
- 12. Mittal S, Madigan D, Burd RS, Suchard MA. High‐dimensional, massive sample‐size cox proportional hazards regression for survival analysis. Biostatistics. 2014;15:207‐221. [DOI] [PMC free article] [PubMed] [Google Scholar]
- 13. IntHout J, Ioannidis JP, Borm GF. The Hartung‐Knapp‐Sidik‐Jonkman method for random effects meta‐analysis is straightforward and considerably outperforms the standard DerSimonian‐Laird method. BMC Med Res Methodol. 2014;14:25. [DOI] [PMC free article] [PubMed] [Google Scholar]
- 14.Council for International Organizations for Medical Sciences (CIOMS)Evidence Synthesis and Meta‐Analysis for Drug Safety: Report of CIOMS Working Group X. Geneva, Switzerland: CIOMS; 2016. [Google Scholar]
- 15. Higgins JP, Thompson SG, Deeks JJ, Altman DG. Measuring inconsistency in meta‐analyses. BMJ. 2003;327:557‐560. [DOI] [PMC free article] [PubMed] [Google Scholar]
Associated Data
This section collects any data citations, data availability statements, or supplementary materials included in this article.
Supplementary Materials
Table S1. Crude Incidence Rate (Per 1000 Patient‐years) of HHF and BKLE Amputation in the Subpopulation With Established Cardiovascular Disease for New Users of: (1) Canagliflozin, (2) Empagliflozin or Dapagliflozin (Other SGLT2i), (3) All Non‐SGLT2i, and (4) Select Non‐SGLT2i (DPP‐4i, GLP‐1 Receptor Agonist, or Other AHA) During the On‐treatment and Intent‐to‐treat Time‐at‐risk Periods.
Table S2. Risk of HHF in the Subpopulation with Established Cardiovascular Disease for Selected Comparisons During the On‐treatment and Intent‐to‐treat Time‐at‐risk Periods.†
Table S3. Risk of BKLE Amputation in the Subpopulation with Established Cardiovascular Disease for Selected Comparisons During the On‐treatment and Intent‐to‐treat Time‐at‐risk Periods†
Figure S1. Forest plot of effect estimates for the risk of heart failure from all sensitivity analyses across databases and time‐at‐risk periods.