

Abstract
Background: Musician's dystonia critically impacts professional musicians' careers as they may lose musical skills, which have been acquired through long and intensive training. Yet the pathophysiology of musician's dystonia and its link to the neural mechanisms supporting musical skills is poorly understood. We tested if resting‐state functional connectivity might reflect an aspect of musical skill linked to the pathophysiology of musician's dystonia. We also tested a second hypothesis that the region with altered resting‐state functional connectivity might be correlated with a quantitative measure of musical skills.
Methods: We studied 21 patients with musician's dystonia affecting their hands and 34 healthy musicians, using resting‐state functional magnetic resonance imaging and behavioral assessment. We tested between‐group differences of resting‐state functional connectivity throughout the whole brain using independent component analysis.
Results: We found abnormal basal ganglia resting‐state functional connectivity in the putamina of patients with musician's dystonia compared with those of healthy musicians (P = 0.035 corrected for multiple comparisons). We also found that the temporal precision of keystrokes was correlated with basal ganglia functional connectivity in the putamina of healthy pianists (r = 0.72, P = 0.0005), but not in pianists with musician's dystonia (r = −0.11, P = 0.64).
Conclusions: We show that abnormalities of the putamen exist even at rest in musician's dystonia, whereas putaminal abnormality has previously been reported during a task. Moreover, basal ganglia resting‐state functional connectivity in the putamen represented training levels in healthy musicians, and its disruption was associated with musician's dystonia. This novel finding hints at the pathophysiological mechanisms by which musician's dystonia follows extensive musical training. © 2018 The Authors. Movement Disorders published by Wiley Periodicals, Inc. on behalf of International Parkinson and Movement Disorder Society.
Keywords: musician's dystonia, resting‐state fMRI, functional connectivity
Focal task‐specific dystonia (FTSD) is a movement disorder that compromises skilled movements.1, 2 Particularly, FTSD manifests as involuntary production of jerky movements along with muscular cramping, often occurring while performing a well‐trained motor action.3 FTSD includes musician's dystonia (MD), writer's cramp, athlete's dystonia, and other occupational dystonias. The cause of MD remains unclear, but it is likely associated with intense and repetitive engagement in precise motor actions along with predisposing factors such as genetic abnormality,4 mental traits,5 and biomechanical characteristics.6 The interaction among these various factors in FTSD is thought to eventually lead to dysfunctional or maladaptive brain plasticity.
Abnormal activities during motor tasks in MD have been demonstrated in functional magnetic resonance imaging (fMRI) and positron emission tomography (PET) studies.2 Hyperactivation of the motor cortex has been demonstrated in patients with MD involving the hand.7 The primary somatosensory cortex may also show maladaptive structural/functional changes,8, 9 including changes in representation of an affected body part.10 Moreover, putaminal hyperactivity during tactile sensation in patients with hand FTSD11 suggest abnormal connectivity between the putamen and somatosensory cortex. In summary, previous neuroimaging studies suggested that changes in the motor‐somatosensory cortices and basal ganglia comprise the mechanisms of FTSD. However, task fMRI/PET does not clearly show the extent to which the findings result from dystonic symptoms, which occur during measurement, and to what extent they result from the underlying mechanisms.
Functional connectivity is defined as the statistical association or dependence of a time‐series among 2 or more anatomically distinct areas and can be calculated from both resting‐state fMRI (rs‐fMRI) and task fMRI. Unlike conventional task fMRI, however, rs‐fMRI examines spontaneous fluctuations of blood oxygenation level‐dependent (BOLD) signals without specific task demands. If 2 regions show similar BOLD signals over time, they are regarded as functionally connected.12 For rs‐fMRI scans, participants were asked to lie quietly and think of nothing in particular. Thus, an advantage of rs‐fMRI is that the obtained results are not substantially affected by the participant's experience (eg, dystonic symptoms) in the scanner. Furthermore, rs‐fMRI allows us to compute a measure of resting‐state functional connectivity, which provides information about brain networks termed “resting‐state networks” (RSNs).13, 14 Task fMRI can detect brain activity associated with dystonic symptoms, whereas rs‐fMRI likely captures state/trait biomarkers of FTSD, which exist even in the absence of symptoms. In turn, it is commonly thought that FTSD is a task‐specific disorder and that dystonic symptoms occur during movement; thus, whether rs‐fMRI can reveal abnormality in patients with FTSD may initially sound questionable. However, rs‐fMRI has already been applied to patients with writer's cramp and embouchure dystonia, whereupon abnormal functional connectivity in subcortical and cortical areas was found.15, 16, 17, 18 To our knowledge, however, rs‐fMRI has not been previously used to study patients with MD involving the hand. Furthermore, the link of behavior with neural correlates is important, but few studies have made such connections: an rs‐fMRI study of FTSD had associated abnormality in RSNs with task‐specific behavioral abnormality.19
Here, we investigated the differences in resting‐state functional connectivity in the whole brain between patients with MD involving the right hand and matched control musicians. We employed an independent component analysis (ICA) approach, which is one of the common methods for rs‐fMRI analysis. FTSD may result from dysfunction of brain regions including the basal ganglia, cerebellum, and cortical sensorimotor areas or from aberrant communication among those areas (eg, cortico‐basal ganglia‐thalamo‐cortical loops and cortico‐cerebello‐thalamo‐cortical loops).20, 21, 22 In parallel, the relationship between (over)learning of a motor task and the development of FTSD is well known.2 The areas/networks implicated in FTSD pathophysiology are critical for acquisition and retention of motor skills.23 We included the RSN involving the insula because it plays a role in linking information from diverse functional systems, including the sensorimotor system,24 and its abnormal activity is reported in dystonia.25 Further, the default mode network (DMN) is of interest because this network is deactivated while performing demanding tasks.13 Therefore, we hypothesized that disruption of motor learning networks and the DMN would underlie the pathophysiology of FTSD.2 We also tested a second hypothesis that RSN disorganization, if any, would be correlated with behavioral abnormality in MD. Recently, Haslinger et al18 investigated for the first time the correlation between resting‐state functional connectivity and clinical scores in a type of musician's dystonia (embouchure dystonia affecting orolinguistic areas), but they failed to find any correlation. Instead of visual inspection, we obtained objective and quantitative data from both pianists with MD and healthy pianists, using musical instrument digital interface (MIDI), which can be used as an index of musician skill.26
Materials and Methods
Participants
Twenty‐one patients with MD (mean age, 38.7 ± 10.6 years; age range, 22‐59 years; 11 women, 3 left‐handed) and 34 age‐, sex‐, and instrument‐matched healthy musicians (mean age, 34.0 ± 11.9 years; age range, 18‐56 years; 25 women, 2 left‐handed) were recruited. We included patients with MD involving the right hand only while playing a musical instrument, regardless of their handedness. Hence, bilateral FTSD and generalized dystonia were not included. The exclusion criteria were epilepsy, a history of any neurological diseases other than MD, and a history of pharmacological intervention, including neuroleptic drugs or injections of botulinum‐toxin A within the past 3 months. The study included 50 pianists (19 with MD), 3 saxophone players (1 with MD), and 2 clarinet players (1 with MD). Patients with MD were diagnosed through neurological examination by a board‐certified movement disorder specialist (T.S.). No participants showed dystonic symptoms at rest. All healthy musicians also underwent a medical interview and neurological examination by a board‐certified neurologist (T.H.). The duration of the disorder ranged from 1 to 17 years (mean, 6.6 ± 4.1 years). This experiment was conducted according to the principles and guidelines of the Declaration of Helsinki. All participants gave written informed consent according to the study protocol, which was approved by the ethics committee of the National Center of Neurology and Psychiatry.
Data Acquisition
MRI Acquisition
Images were acquired using a 3‐T MRI scanner (MAGNETOM Verio, Siemens Medical Systems, Erlangen, Germany) with a 32‐channel phased array coil. Each participant underwent a 10‐minute rs‐fMRI along with a T1‐weighted, 3‐dimensional MRI and 2 gradient‐echo MRIs to obtain a field‐map image.
The rs‐fMRIs scans were acquired using gradient‐echo echo‐planar imaging (EPI): repetition time (TR), 2500 milliseconds; echo time (TE), 30 milliseconds; flip angle (FA), 80°; field of view (FOV), 212 × 212 mm; 64 × 64 matrix, 40 axial slices with slice thickness of 3.2 mm and gap of 0.8 mm, yielding 3.3 × 3.3 × 4.0 mm3 voxel size. We employed a standardized rs‐fMRI protocol recommended for Japanese neuroscience projects (Brain Mapping by Integrated Neurotechnologies for Disease Studies, Brain/MINDS) that is used by many Japanese MRI research groups. The participants were instructed to remain awake and think of nothing in particular with their eyes open while fixating on a crosshair projected onto the center of a screen in the scanner.
A whole‐brain high‐resolution 3‐dimensional T1‐weighted anatomical scan was acquired for registration purposes using a magnetization‐prepared rapid gradient‐echo sequence according to the following parameters: TR, 1900 milliseconds; TE, 2.52 milliseconds; TI, 900 milliseconds; FA, 90°; FOV, 250 × 250 mm2; acquisition matrix, 256 × 256; slice thickness, 1.0 mm; axial slice number, 192; voxel dimensions, 0.98 × 0.98 × 1.00 mm3. Two field‐map images were obtained in the same space with EPIs to generate a field‐map image: TR, 488 milliseconds; TE1, 4.92 milliseconds; TE2, 7.38 milliseconds; FOV, 212 mm; FA, 60°; 64 × 64 matrix; 40 axial slices with slice thickness of 3.2 mm and gap of 0.8 mm, yielding 3.3 × 3.3 × 4.0 mm3 voxel size.
Behavioral Data
To assess motor performance during instrumental playing, we obtained a MIDI score that represented piano‐playing skill level.26 The participants played an acoustic piano (U1, Yamaha Co., Shizuoka, Japan) with MIDI sensors installed beneath all piano keys. The participants were asked to strike 5 adjacent piano keys (C, D, E, F, G) 17 times as quickly and accurately as possible according to specified fingering (1‐2‐3‐4‐5‐4‐3‐2‐1‐2‐3‐4‐5‐4‐3‐2‐1, where 1, 2, 3, 4, and 5 represent the thumb, index, middle, ring, and little fingers, respectively). All participants performed this task 10 times. They were asked to strike the keys to produce mezzo forte (moderately loud) volume with legato touch (ie, each key was released after the next key was depressed). We recorded the MIDI data representing the individual keystrokes according to a custom‐made script. Behavioral and MR data were measured within 1 month of each other for each participant, although the interval between the 2 measurements varied according to each participant's schedule. There was no group difference in the measurement interval.
To assess resting‐state status during rs‐fMRI, we applied the Stanford sleepiness scale27 immediately after scanning (ranging from 1 = active, vital, alert, or wide awake to 7 = no longer fighting sleep).
Data Analysis
Behavioral Data Processing
We computed the intertrial variability of the interkeystroke interval (IKI) in the MIDI data for each participant; this represents skill level in piano playing,28, 29 which should be substantially influenced by the level of training.
We performed a Mann‐Whitney U test to assess group differences for the IKI and Stanford sleepiness scales. The 2‐tailed level of statistical significance was set at P < 0.05. This statistical analysis was carried out using the R 3.3.2 software package.
Imaging Data Preprocessing
Preprocessing of the structural MRI data included removal of nonbrain tissue and cerebrospinal fluid using the segmentation function of the SPM12 package (Wellcome Trust Centre for Neuroimaging, University College London). Data processing of the rs‐fMRI images employed FEAT version 6.00, which is a component of FSL (FMRIB's software library). Registration of rs‐fMRI data to the structural images was conducted using FMRIB's Linear Image Registration Tool (FLIRT). Meanwhile, registration to standard stereotaxic space (Montreal Neurological Institute atlas) was performed using the FMRIB's Nonlinear Image Registration Tool (FNIRT).
First, each participant's degree of head motion was quantified, and none of them were excluded according to the head motion criteria (translation was 0.07 ± 0.03 mm, and rotation was 0.03° ± 0.01°). Furthermore, no significant differences were found in translation (P = 0.78) or rotation (P = 0.42) between MD and control subjects. The initial preprocessing steps for each participant included motion correction, spatial smoothing using a 6‐mm full‐width‐at‐half‐maximum Gaussian kernel, and high‐pass temporal filtering with a cutoff frequency of 0.01 Hz. The functional images were coregistered to high‐resolution T1‐weighted images.
Single‐session ICA was performed by MELODIC version 3.14, which is a component of FSL, to decompose single participants' 4‐dimensional (4‐D) data sets into sets of spatial and temporal components. Subsequently the autoclassification of artifactual ICA spatial components was performed, to remove noise components from the 4‐D‐fMRI data using FMRIB's ICA‐based Xnoiseifier.30 The details are shown in Supplement 1. Next, the data were temporally concatenated across all participants to create a single 4‐D data set and fed into a group‐level ICA analysis, as explained below.
Component Identification and Statistics
To detect RSNs, group analysis was conducted using probabilistic ICA, as implemented in MELODIC. The concatenated fMRI volumes from all participants were decomposed into 30 spatial components. We identified whether the ICA components reflected signals or noise according to a previously published method.31 To identify ICA components of neural origin, we also used the Neurosynth Image Decoder, which enabled quantitative, interactive comparison of spatial maps with the database.32 Five of 30 components were identified as noise, and 25 were of neuronal origin. From a total of 25 neuronal components, we selected 8 RSN components (group ICA maps) deemed most relevant to our study according to previous literature: 2 DMNs17 (Fig. 1a,b), sensory‐motor RSN17, 33 (Fig. 1c), insula RSN25 (Fig. 1d), cerebellar RSN34 (Fig. 1e), and basal ganglia RSN35 (Fig. 1f). We also included RSNs composed of combined signals from the motor cortex36 and insula25 (Fig. 1g) and a combination of motor cortex, putamen,37 and insula (Fig. 1h). The group ICA maps in Figure 1 were thresholded to emphasize the core of the network structure; however, actual networks used for analysis were not thresholded and spanned all over the brain (Fig. S1 in Supplement 2).
Figure 1.
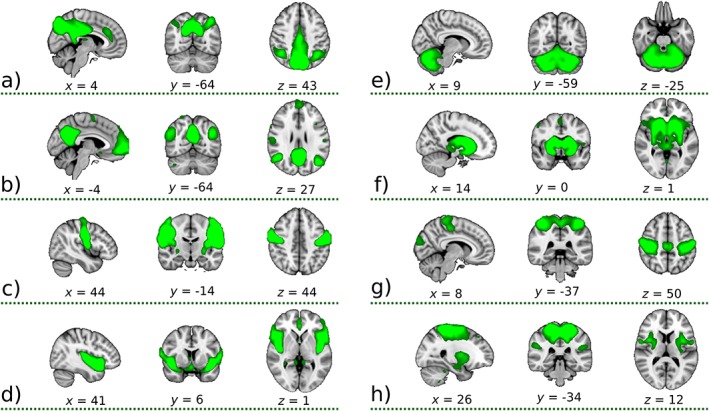
Eight‐group ICA maps selected for further dual‐regression analysis showing the 3 most informative orthogonal slices for each mask. These green masks were scaled and superimposed onto the 1‐mm Montreal Neurological Institute (MNI) coordinates 152‐standard‐space template image. The maps represent: (a) posterior default mode network (DMN) precuneus, (b) DMN, (c) sensory‐motor, (d) insula, (e) cerebellum, (f) basal ganglia network, (g) mix of signals from the motor cortex and insula, and (h) mix of signals from the motor cortex, putamen, and insula. All components were produced by the group‐independent component analysis decomposition of resting‐state functional magnetic resonance imaging data, converted to Z‐statistic images via a normalized mixture‐model fit with thresholded at the arbitrary threshold of Z = 3 for visualization purposes. Numbers below slices represent the MNI coordinates (mm) for each mask. In fact, the networks used for analysis were not thresholded and spanned all over the brain (Fig. S1 in Supplement 2). [Color figure can be viewed at http://wileyonlinelibrary.com]
The dual regression approach transferred these group ICA maps back to each participant. Each group ICA map was regressed onto the subject's 4‐D space‐time data set, yielding subject‐specific time series. The result is a set of time courses (one for each group ICA map) that describe the temporal structure of each component for that subject. These time series were regressed onto the same 4‐D data set, resulting in subject‐specific spatial maps sorted at the group ICA maps. Finally, the voxel‐wise test was performed across subjects, separately for each group ICA map. We used the Permutation Analysis of Linear Models (PALM) tool in FSL38 to perform family‐wise error (FWE) correction along multiple designs (contrasts) and modalities (networks) in addition to correction for multiple voxels. For statistical inference, we used the threshold P < 0.05 corrected for FWE for multiple voxels, 2 contrasts (healthy control > MD and MD > healthy control), and 8 group ICA maps using threshold‐free cluster enhancement39 considering both the voxel‐level peak and cluster‐level extent of connectivity. For a reference, we also showed the results with a threshold P < 0.05 FWE corrected only for multiple voxels to illustrate the spatial extension of striatal activity, as this is the most widely adopted corrected threshold in previous neuroimaging literature. Moreover, we used regressors to control for differences in age and musical instrument during the statistical analysis.
To test for relationships between the behavioral measurement and RSNs, we calculated Pearson's correlation coefficient between the variance of IKI and functional connectivity in a volume of interest (VOI) using the hmisc library from the R software package. We set the VOI as a cluster that showed the most significant differences between the MD and control groups and extracted the average functional connectivity value in the VOI from each subject‐specific spatial map calculated during the second stage of dual regression analysis. To consider the effects of outliers, we estimated the confidence intervals of the correlation coefficients using a bootstrapping procedure with 1000 resamplings. The details are shown in Supplement 2.
Results
No participants reported dystonic symptoms during the scan. We also checked the patients' motion during fMRI by visual observation and did not notice dystonic symptoms.
Between‐group dual regression analysis of rs‐fMRI data did not reveal significant between‐group differences in RSN organization, except for that of the basal ganglia RSN. The basal ganglia resting‐state functional connectivity in the anterior part of the right putamen was increased in patients with MD compared with healthy controls (P = 0.035, FWE corrected for multiple comparisons for the number of voxels, contrasts, and ICA maps; MNI coordinates: x = 26, y = 14, z = 0; size, 15 voxels; Fig. 2). Other clusters were identified in the left putamen (P = 0.007; x = −26, y = 2, z = 4; size,168 voxels) and right putamen (P = 0.004; cluster size, 315 voxels at this threshold) using a statistical significance threshold of P < 0.05 with FWE corrected only for multiple voxels. Decreased resting‐state functional connectivity for MD patients was not identified. The difference in the basal ganglia RSN was not explained by differences in sleepiness during rs‐fMRI because no group differences were evident (P = 0.82, Mann‐Whitney U test) in median sleepiness score: 3 (range, 1‐7) for MD and 3 (range, 2‐6) for controls.
Figure 2.

Results for the basal ganglia network. Top image shows the mask from Figure 1f shaded in green. Bottom image shows clusters of increased connectivity in patients with musician's dystonia. The colored area in each brain image indicates clusters after family‐wise error (FWE) correction for multiple voxels with a threshold of P < 0.05. The area outlined in black in each brain image represents results obtained after FWE correction for multiple voxels, 2 contrasts, and 8 independent component analysis maps with a threshold of P < 0.05. [Color figure can be viewed at http://wileyonlinelibrary.com]
Analysis of the MIDI score showed that the IKI, which represented motor timing consistency, was more variable in patients with MD relative to healthy musicians (P = 0.0007, Mann‐Whitney U test). The median and range of the IKI were 0.11 (0.08‐0.19) and 0.15 (0.10‐0.22) for patients with MD and control musicians, respectively. The largest group connectivity difference was found at the putamen in the basal ganglia RSN. Therefore, we set the VOI in the anterior right putamen (MNI coordinates: x = 26, y = 14, z = 0, the area outlined in black; Fig. 2 bottom). The relationship between IKI variability and connectivity values extracted from a VOI corresponding to the right putamen is shown in Figure 3. In contrast, in patients with MD, no correlation was found between MIDI score and connectivity values (r = −0.11, P = 0.64). The estimated 95% confidence intervals of the correlation coefficient were 0.3204–0.8996 and −0.5431–0.4626 for healthy controls and patients with MD, respectively. This confirmatory reanalysis supported the correlation in the healthy musicians, but not in the patients with MD.
Figure 3.

Dependence between average connectivity value and musical instrument digital interface (MIDI) score. Average functional connectivity value was calculated from all voxels in the cluster; this was obtained after family‐wise error correction for multiple voxels, contrasts, and independent component analysis maps (the area outlined in black at the bottom of Fig. 2). The most significant point of the cluster was located in the right putamen (MNI coordinates: x = 26, y = 14, z = 0). The MIDI scores were available for pianists only. Blue circles represent healthy control pianists (HC), whereas red crosses represent pianists with musician's dystonia (MD). The correlation coefficients between putaminal functional connectivity and MIDI score were r = 0.72, P = 0.0005 and r = −0.11, P = 0.64 in the healthy controls and patients with MD, respectively. [Color figure can be viewed at http://wileyonlinelibrary.com]
Discussion
We compared the connectivity of 8 RSNs, 6 of which were related to movement control and 2 of which were associated with DMN, between patients with MD and healthy musicians. Only the basal ganglia RSN showed significant differences between the 2 groups. The basal ganglia resting‐state functional connectivity in the anterior part of the right putamen was increased in patients with MD compared with healthy controls. All patients with MD in this study were asymptomatic at rest, and thus the reported results reflect fundamental RSN abnormalities rather than brain activity instantaneously resulting from dystonic movement during measurement.
In agreement with the present findings, abnormalities of the basal ganglia in FTSD during sensorimotor tasks have been shown in previous functional imaging studies. Hyperactivity in the basal ganglia has been documented in patients with writer's cramp during a tactile discrimination task.11 Hand FTSD, including both MD and writer's cramp, has been associated with abnormally increased connectivity between the basal ganglia and other subcortical and cortical areas.40 However, the quality/quantity of movement, including dystonic symptoms, can affect the results of tasks preformed in fMRI/PET studies. Thus, the rs‐fMRI method has one advantage over task fMRI in that rs‐fMRI is not influenced by task performance at the time of measurement.
Several rs‐fMRI studies in patients with writer's cramp provide important information to support the interpretation of the present findings. In a study of right‐hand‐affected patients with writer's cramp compared with controls, functional connectivity was reduced in the left thalamus, left/right pallidum, and left primary sensorimotor cortex when a seed VOI was placed in the left lateral premotor cortex.16 Another seed‐based study of writer's cramp found reduced connectivity between the superior parietal lobule and the dorsal precentral region, which controls writing movements.15 However, neither of those seed‐based analysis studies investigated connectivity changes in the basal ganglia network directly. The present study's results partly agree with the finding of Mohammadi et al, wherein an ICA‐based dual regression approach was used in patients with writer's cramp,17 revealing increased connectivity between the putamen and DMN in patients with writer's cramp. However, in our study, increased functional connectivity in the putamen in the basal ganglia RSN was found, suggesting hyperconnectivity within the basal ganglia network. This difference between our results and those of Mohammadi et al may be caused by the pathophysiological differences between writer's cramp and MD. Although writer's cramp and MD share pathophysiological mechanisms, they are not necessarily all identical. Furthermore, movement abnormalities differ between MD and writer's cramp: patients with writer's cramp often exhibit an abnormal flexor pattern in the dominant hand,41 whereas in MD, the middle, ring, and small fingers are the most frequently affected in both the dominant and nondominant hands.42, 43, 44 An ICA‐based rs‐fMRI analysis in musicians suffering from embouchure dystonia and in healthy musicians was performed by Haslinger and colleagues,18 with the finding of abnormal functional connectivity in the motor‐somatosensory and cerebellar RSNs, but not in the basal ganglia RSN. Haslinger's study did not include the basal ganglia RSN in its analysis, explaining the absence of a finding of abnormality in the basal ganglia RSN.
We found increased functional connectivity in the basal ganglia network in patients with MD. This finding is consistent with that of a previous task fMRI study.45 In that study, patients with writer's cramp and MD exhibited increasing basal ganglia activity during a “rest” period after completion of a finger‐tapping task. This activity might be because of hyperconnectivity in the putamen, which is an effect of faulty inhibitory control of the basal ganglia. Hyperconnectivity of the basal ganglia network in MD may be caused by pathological oscillations or abnormally synchronized neural discharges in the circuit.46, 47 Furthermore, patients with dystonia show increased local field potential in the pallidum, which interacts with the putamen in the basal ganglia circuits.48, 49, 50, 51 Therefore, we believe that the present finding of increased connectivity in the basal ganglia RSN at least partially reflects abnormal oscillations in the basal ganglia circuits in patients with MD. Further studies are warranted to test this hypothesis.
Abnormality in the basal ganglia network alone may not explain the pathophysiology of MD. The cortical motor and sensorimotor areas, basal ganglia, and cerebellum and the loops formed by these nodes, such as cortico‐basal ganglia‐thalamo‐cortical loops and cortico‐cerebello‐thalamo‐cortical loops,21, 22 are critical nodes and networks for the acquisition and retention of skilled motor behaviors.23 The abnormal basal ganglia RSN affects not only the functions of the basal ganglia but also the functions of those connected areas.
A particularly novel finding of the present study was the correlation between MIDI scores and connectivity values extracted from the right putamen. Although Haslinger and colleagues investigated the correlation between resting‐state functional connectivity and clinical scores in embouchure dystonia, the analysis revealed no relation between them.18 This negative finding could result from the difficulty in the visual inspection of orolinguistic movements with a coarse scale, which might not be sensitive enough to detect individual differences in dystonic symptoms. Instead of the visual inspection score, we quantitatively measured the timing of keystrokes during piano playing with MIDI, which has been proven to reflect the level of musical skills.26 To our knowledge, this is the first direct evidence indicating that resting‐state functional connectivity is related to musical skill, and its disruption indexes the presence of dystonia. This finding is consistent with structural MRI evidence that demonstrated how greater variability while playing scales was correlated with larger putamen volume.52 Furthermore, previous task fMRI studies have indicated that the relationship between basal ganglia function and musical skill: putaminal activity reflects prediction of beats,53 and discrimination of beat rhythms is impaired in Parkinson's disease.54 These findings support the association between musical skill and the putamen. This correlation was observed only in the control group, but not in MD. This analysis indicates that, in healthy participants, basal ganglia functional connectivity in the anterior right putamen represents an aspect of musical skill. More specifically, higher connectivity values were correlated with higher variability in temporal precision of keystrokes. This finding is reasonable, assuming that a link exists between rs‐fMRI hyperconnectivity and oscillations in the basal ganglia circuits, because temporal motor precision is regulated by oscillations in the putamen.55 It is possible that the pathophysiology of dystonia affects basal ganglia functional connectivity nonlinearly once dystonia emerges, and the relationship between motor‐timing precision and basal ganglia resting‐state functional connectivity in putamen connectivity is disorganized.
Task fMRI and rs‐fMRI are complementary to each other. Task fMRI can detect brain activity associated with dystonic symptoms, but activity should also reflect between‐group performance differences and miscellaneous factors, such as awareness of symptom occurrence, exaggerated afferents from cramping muscles, overflow of abnormal activity, or connectivity to secondary areas. In contrast, rs‐fMRI likely captures an underlying state biomarker of FTSD, which exists even in the absence of symptoms. It is difficult to identify from imaging methods whether abnormal basal ganglia connectivity causes dystonia (primary) or merely follows the primary pathophysiology responsible for dystonia (eg, compensatory mechanisms). A future study combining imaging and intervention experiments is warranted.
To summarize, the present study revealed 2 novel findings. First, we found increased basal ganglia resting‐state functional connectivity in the putamen in patients with MD compared with healthy musicians. This is the first demonstration of functional abnormality of the putamen at rest, although the abnormality in putamen was previously reported during a task. Second, we found that resting‐state basal ganglia connectivity in the putamen was correlated with the precision of keystrokes that should have been acquired through long training in healthy musicians but not in patients with MD. This novel finding hints at the pathophysiological mechanisms by which musician's dystonia follows extensive musical training.
Supporting information
Supporting Information 1
Supporting Information 2
Supporting Information 3
Supporting Information 4
Relevant conflicts of interest/financial disclosures: Nothing to report.
Funding agencies: This study was supported by 2 Grants‐in‐Aid for Young Scientists (15H05357 to K.K. and 15H05358 to S.F.) from JSPS; the Brain Mapping by Integrated Neurotechnologies for Disease Studies (Brain/MINDS, 16dm0207022h003), Health Labor Science Research Grants from the Japan Agency for Medical Research and Development (AMED), KAKENHI grants (26120008 and 16H03306) from MEXT, and the Intramural Research Grant for Neurological and Psychiatric Disorders of the National Center of Neurology and Psychiatry, Japan (to T.H.).
Contributor Information
Kahori Kita, Email: kahori.kita@gmail.com.
Takashi Hanakawa, Email: hanakawa@ncnp.go.jp.
References
- 1. Hallett M. Neurophysiology of dystonia: The role of inhibition. Neurobiol Dis 2011;42:177‐184. [DOI] [PMC free article] [PubMed] [Google Scholar]
- 2. Furuya S,Hanakawa T. The curse of motor expertise: Use‐dependent focal dystonia as a manifestation of maladaptive changes in body representation. Neurosci Res 2016;104:112‐119. [DOI] [PubMed] [Google Scholar]
- 3. Cohen LG,Hallett M. Hand cramps: clinical features and electromyographic patterns in a focal dystonia. Neurology 1988;38:1005‐1012. [DOI] [PubMed] [Google Scholar]
- 4. Schmidt A,Jabusch HC,Altenmüller E, et al. Etiology of musician's dystonia: familial or environmental? Neurology 2009;72:1248‐1254. [DOI] [PMC free article] [PubMed] [Google Scholar]
- 5. Ioannou CI,Altenmüller E. Psychological characteristics in musician's dystonia: a new diagnostic classification. Neuropsychologia 2014;61:80‐88. [DOI] [PubMed] [Google Scholar]
- 6. Leijnse JNAL,Hallett M,Sonneveld GJ. A multifactorial conceptual model of peripheral neuromusculoskeletal predisposing factors in task‐specific focal hand dystonia in musicians: etiologic and therapeutic implications. Biol Cybern 2015;109:109‐123. [DOI] [PMC free article] [PubMed] [Google Scholar]
- 7. Pujol J,Roset‐Llobet J,Rosinés‐Cubells D, et al. Brain cortical activation during guitar‐induced hand dystonia studied by functional MRI. Neuroimage 2000;12:257‐267. [DOI] [PubMed] [Google Scholar]
- 8. Rosenkranz K,Williamon A,Butler K, et al. Pathophysiological differences between musician's dystonia and writer's cramp. Brain 2005;128:918‐931. [DOI] [PubMed] [Google Scholar]
- 9. Garraux G,Bauer A,Hanakawa T, et al. Changes in brain anatomy in focal hand dystonia. Ann Neurol 2004;55:736‐79. [DOI] [PubMed] [Google Scholar]
- 10. Elbert T,Candia V,Altenmüller E, et al. Alteration of digital representations in somatosensory cortex in focal hand dystonia. Neuroreport 1998;9:3571‐3575. [DOI] [PubMed] [Google Scholar]
- 11. Peller M,Zeuner KE,Munchau A, et al. The basal ganglia are hyperactive during the discrimination of tactile stimuli in writer's cramp. Brain 2006;129:2697‐2708. [DOI] [PubMed] [Google Scholar]
- 12. Biswal B,FZ Y,VM H, et al. Functional connectivity in the motor cortex of resting human brain using echo‐planar MRI. Magn Reson Med 1995;34:537‐541. [DOI] [PubMed] [Google Scholar]
- 13. Fox MD,Snyder AZ,Vincent JL, et al. Intrinsic fluctuations within cortical systems account for intertrial variability in human behavior. Neuron 2007;56:171‐184. [DOI] [PubMed] [Google Scholar]
- 14. Smith SM,Fox PT,Miller KL, et al. Correspondence of the brain's functional architecture during activation and rest. Proc Natl Acad Sci U S A 2009;106:13040‐13045. [DOI] [PMC free article] [PubMed] [Google Scholar]
- 15. Delnooz CCS,Helmich RC,Toni I, et al. Reduced parietal connectivity with a premotor writing area in writer's cramp. Mov Disord 2012;27:1425‐1431. [DOI] [PubMed] [Google Scholar]
- 16. Dresel C,Li Y,Wilzeck V, et al. Multiple changes of functional connectivity between sensorimotor areas in focal hand dystonia. J Neurol Neurosurg Psychiatry 2014;85:1245‐1252. doi: 10.1136/jnnp-2013-307127 [DOI] [PubMed] [Google Scholar]
- 17. Mohammadi B,Kollewe K,Samii A, et al. Changes in resting‐state brain networks in writer's cramp. Hum Brain Mapp 2012;33:840‐848. [DOI] [PMC free article] [PubMed] [Google Scholar]
- 18. Haslinger B,Noé J,Altenmüller E, et al. Changes in resting‐state connectivity in musicians with embouchure dystonia. Mov Disord 2017;32:450‐458. [DOI] [PubMed] [Google Scholar]
- 19. Kita K,Rokicki J,Furuya S, et al. Resting state brain connectivity in musician's dystonia In: Neuroscience (SfN). Elsevier Inc.; 2016. [Google Scholar]
- 20. Neychev VK,Gross RE,Lehericy S, et al. The functional neuroanatomy of dystonia. Neurobiol Dis 2011;42:185‐201. [DOI] [PMC free article] [PubMed] [Google Scholar]
- 21. Tanji J. New concepts of the supplementary motor area. Curr Opin Neurobiol 1996;6:782‐787. [DOI] [PubMed] [Google Scholar]
- 22. Middleton FA,Strick PL. Cerebellar output channels. Int Rev Neurobiol 1997;41:61‐82. [DOI] [PubMed] [Google Scholar]
- 23. Shmuelof L,Krakauer JW. Are we ready for a natural history of motor learning? Neuron 2011;72:469‐476. [DOI] [PMC free article] [PubMed] [Google Scholar]
- 24. Kurth F,Zilles K,Fox PT, et al. A link between the systems: functional differentiation and integration within the human insula revealed by meta‐analysis. Brain Struct Funct 2010;214:519‐534. [DOI] [PMC free article] [PubMed] [Google Scholar]
- 25. Jankowski J,Paus S,Scheef L, et al. Abnormal movement preparation in task‐specific focal hand dystonia. PLoS One 2013;8:e78234. [DOI] [PMC free article] [PubMed] [Google Scholar]
- 26. Furuya S,Altenmüller E. Finger‐specific loss of independent control of movements in musicians with focal dystonia. Neuroscience 2013;247:152‐163. [DOI] [PubMed] [Google Scholar]
- 27. Hoddes E,Zarcone V,Smythe H, et al. Quantification of sleepiness: a new approach. Psychophysiology 1973;10:431‐436. [DOI] [PubMed] [Google Scholar]
- 28. Furuya S,Nakamura A,Nagata N. Transfer of piano practice in fast performance of skilled finger movements. BMC Neurosci 2013;14:133. [DOI] [PMC free article] [PubMed] [Google Scholar]
- 29. Hosoda M,Furuya S. Shared somatosensory and motor functions in musicians. Sci Rep 2016;6:1‐10. [DOI] [PMC free article] [PubMed] [Google Scholar]
- 30. Salimi‐Khorshidi G,Douaud G,Beckmann CF, et al. Automatic denoising of functional MRI data: combining independent component analysis and hierarchical fusion of classifiers. Neuroimage 2014;90:449‐468. [DOI] [PMC free article] [PubMed] [Google Scholar]
- 31. Beckmann CF,Smith SM. Probabilistic independent component analysis for functional magnetic resonance imaging. IEEE Trans Med Imaging 2004;23:137‐152. [DOI] [PubMed] [Google Scholar]
- 32. Yarkoni T,Poldrack RA,Nichols TE, et al. Large‐scale automated synthesis of human functional neuroimaging data. Nat Methods 2011;8:665‐670. [DOI] [PMC free article] [PubMed] [Google Scholar]
- 33. Wu CC,Fairhall SL,McNair NA, et al. Impaired sensorimotor integration in focal hand dystonia patients in the absence of symptoms. J Neurol Neurosurg Psychiatry 2010;81:659‐665. [DOI] [PubMed] [Google Scholar]
- 34. Preibisch C,Berg D,Hofmann E. Cerebral activation patterns in patients with writer's cramp: a functional magnetic resonance imaging study. J Neurol 2001;248(1):10‐17. [DOI] [PubMed] [Google Scholar]
- 35. Kadota H,Nakajima Y,Miyazaki M, et al. An fMRI study of musicians with focal dystonia during tapping tasks. J Neurol 2010;:1092‐1098. [DOI] [PubMed] [Google Scholar]
- 36. Nelson AJ,Blake DT,Chen R. Digit‐specific aberrations in the primary somatosensory cortex in writer's cramp. Ann Neurol 2009;66:146‐154. [DOI] [PubMed] [Google Scholar]
- 37. Ibanez V,Sadato N,Karp B, et al. Deficient activation of the motor cortical network in patients with writer's cramp. Neurology 1999;53:96‐105. [DOI] [PubMed] [Google Scholar]
- 38. Winkler AM,Ridgway GR,Webster MA, et al. Permutation inference for the general linear model. Neuroimage 2014;92:381‐397. [DOI] [PMC free article] [PubMed] [Google Scholar]
- 39. Smith SM,Nichols TE. Threshold‐free cluster enhancement: addressing problems of smoothing, threshold dependence and localisation in cluster inference. Neuroimage 2009;44:83‐98. [DOI] [PubMed] [Google Scholar]
- 40. Moore RD,Gallea C,Horovitz SG, et al. Individuated finger control in focal hand dystonia: An fMRI study. Neuroimage 2012;61:823‐831. [DOI] [PMC free article] [PubMed] [Google Scholar]
- 41. Sheehy MP,Marsden CD. Writers' cramp‐a focal dystonia. Brain 1982;105:461‐480. [DOI] [PubMed] [Google Scholar]
- 42. Altenmüller E,Jabusch HC. Focal dystonia in musicians: phenomenology, pathophysiology, triggering factors, and treatment. Med Probl Perform Art 2010;25:3‐9. [PubMed] [Google Scholar]
- 43. Conti AM,Pullman S,Frucht SJ. The hand that has forgotten its cunning‐‐lessons from musicians' hand dystonia. Mov Disord 2008;23:1398‐1406. [DOI] [PubMed] [Google Scholar]
- 44. Schmidt A,Jabusch H‐C,Altenmüller E, et al. Challenges of making music: what causes musician's dystonia? JAMA Neurol 2013;70:1456‐1459. [DOI] [PubMed] [Google Scholar]
- 45. Blood AJ,Flaherty AW,Choi JK, et al. Basal ganglia activity remains elevated after movement in focal hand dystonia. Ann Neurol 2004;55:744‐748. [DOI] [PubMed] [Google Scholar]
- 46. Gittis AH,Hang GB,LaDow ES, et al. Rapid target‐specific remodeling of fast‐spiking inhibitory circuits after loss of dopamine. Neuron 2011;71:858‐68. [DOI] [PMC free article] [PubMed] [Google Scholar]
- 47. Buzsáki G,Anastassiou CA,Koch C. The origin of extracellular fields and currents ‐‐ EEG, ECoG, LFP and spikes. Nat Rev Neurosci 2012;13:407‐420. [DOI] [PMC free article] [PubMed] [Google Scholar]
- 48. Liu X,Wang S,Yianni J, et al. The sensory and motor representation of synchronized oscillations in the globus pallidus in patients with primary dystonia. Brain 2008;131:1562‐1573. [DOI] [PubMed] [Google Scholar]
- 49. Silberstein P,Kühn AA,Kupsch A, et al. Patterning of globus pallidus local field potentials differs between Parkinson's disease and dystonia. Brain 2003;126:608. [DOI] [PubMed] [Google Scholar]
- 50. Trenado C,Hartmann CJ,Elben S, et al. Local field potential oscillations of the globus pallidus in cervical and tardive dystonia. J Neurol Sci 2016;366:68‐373. [DOI] [PubMed] [Google Scholar]
- 51. Alexander GE,Crutcher MD. Functional architecture of basal ganglia circuits: neural substrates of parallel processing. Trends Neurosci 1990;13:266‐271. [DOI] [PubMed] [Google Scholar]
- 52. Granert O,Peller M,Jabusch H‐CH, et al. Sensorimotor skills and focal dystonia are linked to putaminal grey‐matter volume in pianists. J Neurol Neurosurg Psychiatry 2011;i:1225‐1231. [DOI] [PubMed] [Google Scholar]
- 53. Grahn JA,Rowe JB. Finding and feeling the musical beat: striatal dissociations between detection and prediction of regularity. Cereb Cortex 2013;23:913‐921. [DOI] [PMC free article] [PubMed] [Google Scholar]
- 54. Grahn JA,Brett M. Impairment of beat‐based rhythm discrimination in Parkinson's disease. Cortex 2009;45:54‐61. [DOI] [PubMed] [Google Scholar]
- 55. Bartolo R,Merchant H. β oscillations are linked to the initiation of sensory‐cued movement sequences and the internal guidance of regular tapping in the monkey. J Neurosci 2015;35:4635‐4640. [DOI] [PMC free article] [PubMed] [Google Scholar]
Associated Data
This section collects any data citations, data availability statements, or supplementary materials included in this article.
Supplementary Materials
Supporting Information 1
Supporting Information 2
Supporting Information 3
Supporting Information 4