

Abstract
Ewing sarcoma (ES), an aggressive bone and soft‐tissue tumor, is treated with chemotherapy, radiotherapy, and surgery. Intra‐operative distinction between healthy and tumorous tissue is of paramount importance but challenging, especially after chemotherapy and at complex anatomical locations. Near infrared (NIR) fluorescence‐guided surgery (FGS) is able to facilitate the determination of tumor boundaries intra‐operatively, improving complete resection and therefore survival. This review evaluates potential ES‐specific proteins from the literature as targets for NIR FGS.
Keywords: CD99, cell surface targets, Ewing sarcoma (ES), CXCR4, LINGO‐1, Image guided surgery
Abbreviations
- ES
Ewing sarcoma
- FGS
fluorescence guided surgery
1. INTRODUCTION
Ewing sarcoma (ES) is a small, round cell sarcoma that shows pathognomonic molecular findings, and varying degrees of neural differentiation.1 ES is the second most common primary osseous malignancy in children and young adults after osteosarcoma, with a peak incidence in the second decade of life.2, 3, 4 Treatment generally consists of chemotherapy followed by surgery and/or radiotherapy. This multimodal approach drastically improved survival, from a 10‐year overall survival of approximately 10% up to 55% to 65% in patients with localized disease and 20% to 35% for patients with metastatic disease.5, 6, 7, 8, 9, 10 During the last few decades local treatment has changed from routinely amputation to limb‐salvage, in which preservation of a functioning limb is at the essence of achieving clear margins.7
ES arises from the diaphysis of long bones with early involvement of the surrounding soft tissue. The soft tissue mass is usually large, circumferential around the involved bone and might even exceed the intra‐osseous component in size.1 Neoadjuvant treatment causes shrinkage of both the bony and soft tissue component, but tumor boundaries can still consist of vital tumor cells. The infiltrative rather than pushing type of tumor outgrowth of ES impedes border definition, but achieving wide surgical resection is of paramount importance for survival in ES. Incomplete resection occurs in 20% to 30% of the cases.11, 12, 13 A large study of 244 patients registered in the Cooperative Ewing's Sarcoma Studies showed that the local recurrence rate in patients with or without systemic metastasis was significantly lower after wide resection compared to marginal or intralesional resection (5% vs 12%).13 Another large study of 512 ES patients showed that local control and 5‐year disease‐free survival are significantly better when adequate surgical margins are achieved (96.6% vs 71.7% and 69.6% vs 46.3% respectively).12
Developments in intra‐operative imaging, like computer tomography‐based systems, make accurate defining and localization of the osseous margins possible. Magnetic resonance imaging enables adequate pre‐operative visualization of soft tissue involvement and can show possible ingrowth in nearby neurovascular tissue, which is essential knowledge for surgical planning. However the intra‐operative definition of soft tissue margins remains challenging, especially after neoadjuvant treatment.7, 14, 15 During surgery the surgeon relies mostly on his eyes and hands when distinguishing tumor issue margins. Furthermore, about 50% of the Ewing sarcoma's arise in the axial skeleton with the pelvic and spine as common locations. Accurate surgery with clear margins is challenging in these complex anatomical locations.5 This emphasizes the need for tools to define surgical margins of soft tissue involvement during surgery.
Targeted imaging uses membrane proteins that are over‐expressed on tumor or tumor‐associated cells to visualize tumors. One of the most eye‐catching technologies in targeted imaging is near infrared (NIR) fluorescence imaging. It provides optical contrast between tumor and surrounding healthy tissue in a broad range of (pre)clinical tumor types and might have the potential to delineate soft tissue involvement of ES during surgery. NIR light is less absorbed than visible light and thus penetrates tissue much deeper. Furthermore, lower auto‐fluorescence is observed at NIR wavelengths which enables good contrast. Because NIR light is invisible for humans, the surgical field remains unstained, but a dedicated NIRF camera system and screen are needed for visualization.16, 17, 18, 19
Over the past 10 years, clinical research has focused mainly on non‐specific fluorescent agents like indocyanine green (ICG), which are primarily used for vascular imaging and sentinel lymph node procedures.20 Unfortunately these simple non‐targeted dyes are not useful to target malignant cells. Therefore, many oncologic targets have been explored and indeed sub‐millimeter sized tumor nodules could be detected in animal models.21 With the first tumor‐targeting clinical trial performed in 2011 by van Dam et al,22 fluorescence guided surgery (FGS) is at the doorstep of clinical translation to oncologic surgery, and many targets are being explored using numerous detection platforms like antibodies, peptides, and RNA aptamers.23
So far, NIR‐based FGS has not been used to define margins in ES. Finding a good target might be challenging because of its uniqueness and the limited similarities with other tumor types. Sand et al24 studied membranous CXCR4 expression on ES cell lines using a fluorescently labeled CXCR4 targeting peptide. They showed that the fluorescently tagged CXCR4 targeting peptide was able to detect CXCR4 on living ES cells. Nevertheless, data are not explored in vivo yet.
When defining a potential biomarker for targeting, the following characteristics are of utmost importance: extracellular biomarker localization, expression pattern, tumor‐to‐healthy tissue ratio, the percentage of positive tumors, reported successful use of the biomarker in in vivo imaging studies and internalization.23, 25
The aim of this study was to provide an overview of possible tumor‐specific biomarkers in ES. For this purpose, a systematic analysis of scientific literature was conducted, using the recently published ES surfaceome database, based on three ES cell lines (A673, TC‐32, and TTC‐466) as a reference.26
2. MATERIALS AND METHODS
This study was performed according to the Preferred Reporting Items for Systematic Reviews and Meta‐analyses guidelines.27 The review protocol for this study was prospectively registered at PROSPERO1 (registration number CRD42017080720).
2.1. Search strategy
A search strategy was developed, and searches were run in the following databases in October 2017: PubMed, Embase, Cochrane Library, Academic Search Premier and Web of Science. Search strategies for all databases were adapted from the PubMed strategy. The search strategy consisted of the keywords “Ewing sarcoma,” “biomarker,” “target” and abbreviations thereof. See Supporting Information file 1 for the complete search strategies for each database.
2.2. Eligibility criteria
Multiple study designs were considered for this review, including clinical trials (phase I, II, and III) and prospective or retrospective cohort studies. Animal studies, case reports, reviews, viewpoints, or conference reports were excluded. We searched for systematic reviews on this topic and only included original articles in our review. Studies were eligible for inclusion if they met the following criteria: (1) Report of cell surface protein expression in the primary ES tumor; (2) Cell surface protein expression was evaluated by flow cytometry, Western blot or immunohistochemistry; (3) Positive expression in 50% or more of the ES samples tested; (4) Study was published in the English language. The eligibility of the studies was assessed by two authors (SB and PD). Disagreements were resolved by discussion during a consensus meeting. Persistent disagreements were settled by consultation of a third reviewer (PH).
2.3. Data extraction
The following data were extracted from eligible studies: target characteristics, sample size, type of sample, percentage of positive ES samples and pattern of expression.
2.4. Target selection: scoring system
Considerations to select the optimal target for tumor imaging are: (1) The location and accessibility of the target on the cell membrane; (2) Upregulation on tumor cells compared to cells in adjacent normal tissue. Note that targets/biomarkers like FLI1 and NKX2.2, which are considered standards for ES in diagnostics and pathology, cannot be used for in vivo imaging, because of nuclear or cytoplasmic expression.28, 29, 30, 31, 32
To select the best biomarkers useful for NIR FGS in ES, we developed a scoring system based on the Target Selection Criteria (TASC) of van Oosten et al25 to classify the targets based on their characteristics and the evidence from the literature search (Table 1). The scoring system is based on five domains:
-
I)
Number of samples tested. This provides a measurement of the evidence from the literature search.
-
II)
Pattern of expression. This concerns the expression pattern evaluated in the single tissue samples tested. In the most ideal situation a target is expressed by all tumor cells, but, in reality, intra‐tumoral heterogeneity is more likely. When a target is equally distributed through the tumor tissue, resulting in a strong diffuse pattern of expression, the target is more applicable for imaging than when it shows a focal expression. The intensity of the expression pattern was defined as + for mild expression (5% to 20% of cells in one sample positive), ++ for moderate expression (25% to 50% of cells in one sample positive) and +++ for strong expression (>50% of cells in one sample positive).
-
III)
Upregulation in ES. To assess this we used the recently published ES surfaceome database of Town et al,33 based on three ES cell lines (A673, TC‐32, and TTC‐466). They used next‐generation RNA sequencing and coupled this to a database of known genes encoding for cell surface proteins (the surfaceome) to define a cell surface proteome of ES compared with mesenchymal stem cells (MSC). A large list of genes encoding for cell surface proteins was created ordered by differences in expression level between ES and MSC. The first 1000 genes on this list show a very high upregulation in ES compared to MSC. From place 5000 onwards genes show a small increase in ES compared to MSC or even higher levels in MSC than in ES. Obviously, enhanced RNA expression does not consequently mean protein upregulation.
-
IV)
Percentage of tested ES samples that showed expression. The percentage is presented as a mean together with the range.
-
V)
Previously imaged: if a target is previously used for in vivo targeted imaging (either pre‐clinical or in PET/SPECT studies) it indicates that a target is suitable for imaging purposes.
Table 1.
Targets scoring system
| Target scoring system | 0 | 1 | 2 | |
|---|---|---|---|---|
| I | Sample size | 0‐9 | 10‐50 | >50 |
| II | Pattern of expression | Focal | Diffuse, mild or heterogenic | Diffuse, moderate or strong (++/+++) |
| III | Upregulation (based on the surfaceome of Town et al) | ≥5000 | 1000‐5000 | <1000 |
| IV | Percentage expression | 50% to 69% | 70% to 85% | >85% |
| V | Previously imaged | No | Yes | |
Eligible biomarkers were granted points (0, 1, or 2) based on five domains: (I) sample size; (II) expression pattern, which comprises the intensity of the expression of the target; (III) upregulation compared to healthy tissue, using the recently published ES surfaceome database of Town et al33; (IV) percentage positive cells; (V) previously imaged. The maximum score is 10. Targets that score 7 or higher are potentially suitable for targeted imaging.
The maximum score for a target is 10 points. We chose 7 points as the cut‐off value for potentially suitable targets for targeted imaging in ES.
3. RESULTS
3.1. Study selection
The initial search strategy identified 4943 records (PubMed n = 2203; Embase n = 1585; Web of Science n = 1054; Cochrane Library n = 19; Academic Search Premier n = 82). After removal of 2128 duplicates, 2815 records were available for screening. After screening of the titles and abstracts, 197 full‐text articles were obtained, of which 111 eventually did not meet the eligibility criteria: 83 studies did not report cell surface expression, 12 studies reported expression levels <50%, 13 studies were not about cell surface expression in ES, two studies were not about expression in primary ES tumors and of one study no full text was available. In total 86 studies were included studying 47 biomarkers (Figure 1). The reviewers initially disagreed on 21 inclusions during the selection process, but eventually a consensus was reached for all studies.
Figure 1.
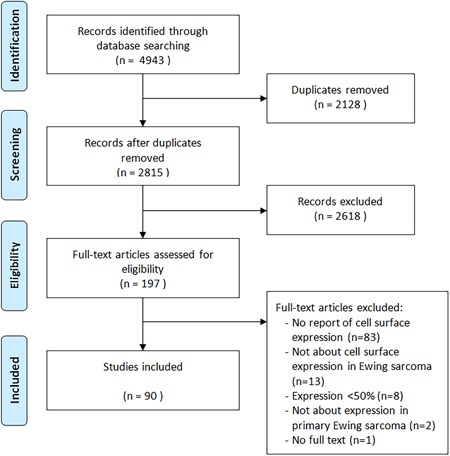
Flowchart study selection process
3.2. Study characteristics
The characteristics of the 47 included biomarkers are presented in Supporting Information file 2.
3.3. Candidate proteins for targeted imaging
The target scoring system (Table 1) was applied to the 47 targets listed in appendix II. Nine targets scored seven points or higher. Table 2 provides an overview of the nine targets that are candidates for near infra‐red fluorescence guided surgery (NIR FGS) in ES. Targets are subdivided into receptors and cell adhesion molecules (CAM) or anchoring proteins. The following nine targets are considered potentially suitable (Table 2): CD99, LINGO‐1, IGF‐1R, C‐kit, NOTCH receptor, CXCR4, NPY receptor Y1, Claudin‐1, Occludin, TEM‐1 (endosialin). These targets are discussed in more detail.
Table 2.
Potentially suitable targets for NIR FGS in Ewing sarcoma
| Target | Function | Score | |
|---|---|---|---|
| Receptors | |||
| CD99 (MIC2, O13 or T‐cell surface glycoprotein E2) | Cell surface glycoprotein involved in differentiation of primitive neuroectodermal cells, apoptosis of T cells, T cell adhesion, migration of leukocytes; may promote growth and migration of tumor cells. | 10 | |
| CXCR4 | Receptor for chemokine SDF‐1/CXCL12, which is involved in chemotaxis of hematopoietic cells and neuron generation. In cancer is plays a role in the tumor microenvironment, where it is associated with metastasis, angiogenesis and tumor growth. | 9 | |
| NPY‐R‐Y1 | Expressed in the central nerve system and periphery (heart, kidney, gastro‐intestinal tract); activation is associated with modulation of the MAPK pathway, which leads to increased or uncontrolled cell proliferation and resistance to apoptosis. | 8 | |
| LINGO‐1 | Functional component of Nogo receptor signaling complex. Important negative regulator of oligodendrocyte differentiation and axonal myelination. | 8 | |
| IGF‐1R | A tyrosine kinase receptor (TKR) that is activated by insulin‐like growth factor 1 (IGF‐1) and involved in hypertrophy of skeletal muscles and other tissues and cell survival; shows anti‐apoptotic effects that allow cancer cells to resist the cytotoxic properties of chemotherapeutic drugs or radiotherapy. | 8 | |
| C‐kit (CD117) | Stem cell factor receptor that is important for development and survival of mast cells, hematopoietic stem cells, melanocytes, germ cells and interstitial cells of Cajal; plays role in cancer cell survival, proliferation and differentiation. | 7 | |
| NOTCH‐R | Involved in cell signaling; shows oncogenetic (suppress apoptosis; promote neo‐angiogenesis, tumor cell growth and metastasis) and tumor‐suppressive (inhibit angiogenesis and induced cell differentiation or apoptosis) functions. | 7 | |
| CAM/anchoring proteins | |||
| Occludin | Integral plasma‐membrane protein that is required for cytokine‐induced regulation and formation of the tight junction paracellular permeability barrier; in cancer it attributes to increased invasion and reduced adhesion which promotes metastasis. | 9 | |
| Claudin‐1 | Tight junction protein that contributes in cell‐to‐cell adhesion by forming continuous seals around cells; dysregulation of claudins plays a role in tumorigenesis, the exact underlying mechanism remains unclear. | 8 | |
Abbreviations: CAM, cell adhesion molecules; FGS, fluorescence guided surgery; NIR, near infrared.
3.3.1. Receptors
3.3.1.1. CD99
CD99 (also called MIC2, O13 or T‐cell surface glycoprotein E2) is a transmembrane glycoprotein encoded by the CD99/MIC2X gene. CD99 is involved in the differentiation of primitive neuroectodermal cells, migration of leukocytes, and apoptosis of T cells. It may promote growth and migration of tumor cells by downregulation of the potassium channel modulatory factor, KCMF1, which is thought to be a metastasis suppressor gene.34 Overexpression of CD99 has been found in lymphoblastic lymphoma, rhabdomyosarcoma, synovial sarcoma, mesenchymal chondrosarcoma, and the blastemal component of Wilms tumor. CD99 expression in ES is strong to moderate, diffuse and membranous and present in approximately 96% of ES tumors. 30, 34‐60 The expression level is much higher in ES compared with MSC.33 A preclinical study using 64Cu labeled mouse monoclonal antibody against CD99 detected primary ES tumors and metastases with higher sensitivity than conventional FDG‐PET in vitro as well as in xenograft mouse models.35 Based on this study CD99‐targeted FGS seems feasible, preferably using human or humanized antibodies to avoid human anti‐mouse induced complications. Human CD99 antibody scFv‐fragments have recently been developed using a synthetic phage antibody library.36 Although intended for therapy, the specificity of these anti‐CD99 scFv fragments for ES, in combination with the small size of these fragments in comparison with full‐size antibodies (27 vs 150 kDa), might offer an excellent agent for FGS of ES.
3.3.1.2. CXCR4
CXCR4 (CD184) is the receptor for chemokine SDF‐1/CXCL12. CXCR4/SDF‐1 signaling plays a role in chemotaxis of hematopoietic cells and in neuron generation during embryogenesis and adult life. It is absent in most healthy tissues but upregulated in the tumor microenvironment of many tumor types, where it is associated with metastasis, angiogenesis, and tumor growth.24 Also in ES CXCR4 is associated with tumor progression and metastasis.37, 38, 39 Overall 82% of ES tumors are positive for CXCR4 (range 64% to 100%), with cytoplasmic and membranous staining varying from weak to strong.24, 38 A surfaceome study of ES by Town et al33 showed no expression of CXCR4 in MSC, which makes CXCR4 an attractive target for targeted imaging. Sand et al24 studied membranous CXCR4 expression in ES cell lines using a fluorescently labeled CXCR4 targeting peptide (MSAP‐Ac‐TZ14011), indicating the feasibility of this agent for FGS. The first in human experience with a radiolabeled version of a similar peptide (Pentixafor) in a small and heterogeneous patient cohort did not completely fulfill the expectations in comparison with standard (18)F‐FDG PET.40
3.3.1.3. NPY receptor Y1
Neuropeptide Y (NPY) receptors are members of the G‐protein coupled receptor superfamily. The NPY receptor Y1 is expressed in the central nervous system and periphery including heart, kidney, and gastro‐intestinal tract. It mediates the function of a neurotransmitter NPY, and a gastrointestinal hormone peptide YY (PYY). Activation is associated with modulation of the MAPK pathway, which leads to increased or uncontrolled cell proliferation and resistance to apoptosis.41 NPY receptor Y1 is highly expressed in human cancers, for instance, breast cancer. Körner et al42 studied NPY expression in several sarcomas, including ES. ES samples showed a strikingly high NPY receptor Y1 expression. 84% of the tumors tested positive with high receptor density. Recently Li et al43 developed fluorescent nanobubbles (NBs) for specific targeting of Y1 receptors overexpressed in breast cancer. The fluorescent NBs were used as ultrasound contrast agents for targeted molecular imaging with contrast‐enhanced ultrasound and fluorescent imaging using the Lumina XRMS system. The NBs showed high affinity and specificity for NPY receptor Y1, providing evidence that specific targeted imaging might also be applicable in ES.
3.3.1.4. LINGO1
Leucine‐rich repeat and immunoglobulin domain containing protein 1 (LINGO1) is a functional component of the Nogo receptor. It plays a key role in the central nervous system where it is an important negative regulator of oligodendrocyte differentiation and axonal myelination.44, 45 It is characterized by a large and well defined extracellular domain.46 Town et al33 explored the cell surface proteome of ES and found that LINGO1 is highly expressed in 91% of ES and not in any other somatic tissue apart from the brain, suggesting it as an appropriate candidate for imaging. The human monoclonal antibody Opicinumab (Li81, BIIB033), has recently been developed to block LINGO1 as a treatment of multiple sclerosis. Li81 was isolated using Fab phage display technology and engineered into a human IgG1 mono‐clonal lonal antibody with high affinity and specificity to LINGO1.47, 48 Initial clinical trials showed disappointing results, but regardless of its therapeutic efficiency this monoclonal antibody could in principle be applied for use of FGS in ES.
3.3.1.5. IGF‐1R
Insulin‐like growth factor 1 receptor (IGF‐1R), a tyrosine kinase receptor, is found on the surface of many human cells. It is activated by IGF‐1 or IGF‐2, playing a role in transformation events like hypertrophy of skeletal muscles and other tissues. IGF‐1R is upregulated in various types of tumors, including bladder, breast, prostate and lung cancer. IGF‐1R signaling is thought to be play a role in survival and cell growth of cancer cells. It induces an anti‐apoptotic effect, allowing cancer cells to resist the cytotoxic properties of chemotherapeutic drugs or radiotherapy.49, 50, 51, 52, 53 IGF‐1R is expressed in 78% of the ESs, but it shows to be very variable (range 33% and 100%). The pattern of expression is often diffuse, varying from weak to strong.49, 50, 51, 52, 53 Several pre‐clinical studies evaluated the use of IGF‐1R antibody‐conjugated fluorophores to identify tumor cells in animal models of various cancer types. Zhang et al54 used the humanized monoclonal antibody AVE‐1642 conjugated to Alexa 680 to target xenograft tumor and was able to detect IGF1R down regulation, with little nonspecific targeting of other tissues or organs in mice. Park et al55 used IGF‐1R antibodies conjugated with PEG‐ylated 650 nm fluorophores to selectively highlight liver metastases in a liver metastasis model of colon cancer in nude mice. The IGF‐1R targeted fluorophore‐antibody conjugation enabled clear imaging of liver metastases compared to normal liver tissue, despite the relatively high expression level in normal liver tissue. Humanized anti‐IGF‐1R monoclonal antibodies, like AVE1642 and R1507, have been developed for therapy. These antibodies have been evaluated for radiolabel‐based SPECT/PET as well, but only in pre‐clinical settings.56, 57
3.3.1.6. C‐kit (CD117)
C‐kit is a tyrosine kinase receptor important for development and survival of mast cells, hematopoietic stem cells, melanocytes, germ cells and interstitial cells of Cajal. It plays a role in tumor growth and progression.58 C‐kit is expressed by the KIT gene which is highly upregulated in ES cell‐lines.33 The intensity of the expression varies however and only 60% of ES show a strong membranous expression (range 31% to 100%). Staining intensity varies from weak to strong and is diffuse membranous and/or cytoplasmic.59 Metildi et al60 used fluorescently labeled (AlexaFluor 488) rat‐derived anti‐KIT antibodies to label KIT‐expressing Gastrointestinal Stromal Tumors (GISTs) in vivo and laparoscopically. They provided proof of concept and confirmed that KIT could be accurately labeled in GISTs for detection of primary tumors, as well as for detection of small metastatic deposits that might be missed at the time of surgical resection. The recently developed humanized monoclonal antibody KTN0158 is being evaluated in dogs for therapeutic purposes and might eventually have potential for imaging.61
3.3.1.7. NOTCH receptor
NOTCH receptors 1‐4 are membranous proteins that play a role in the development of numerous cells and tissue types. Their role in cancer is ambiguous: They can act oncogenic or tumor‐suppressive, dysregulating apoptosis, angiogenesis, tumor cell growth and metastasis.62, 63 Bennani‐Baiti et al64 investigated the expression of NOTCH receptors in ES and found that NOTCH receptors are highly expressed but do not appear to be active. 97% of the samples showed positive staining for at least one NOTCH receptor and 75% of the ESFT expressed two or more NOTCH receptors. The stainings showed to be diffuse and only moderate membranous. The genes encoding for the 4 different types of NOTCH receptors are expressed slightly higher in ES compared to healthy tissue.33 Although potential therapeutic antibodies like bronctictuzumab against activated NOTCH1 are being evaluated for therapy in patient‐derived xenografts. Direct imaging of NOTCH has not been described yet.
3.3.2. CAMs or anchoring proteins
CAMs are membrane‐bound proteins that affect cellular processes. Generally they are transmembrane receptors that consist of three parts: an intracellular domain interacting with the cytoskeleton, a transmembrane domain and an extracellular domain that interact with either other CAMs or with the extracellular matrix. CAMs form a large and diverse group of proteins, and most of the members belong to either the immunoglobulin superfamily, or to the families of integrins, cadherins or selectins.23, 65
3.3.2.1. Claudin‐1
Claudin‐1, encoded by the CLDN1 gene, is a tight junction protein and contributes to cell‐to‐cell adhesion by forming continuous seals around cells, serving as a physical barrier to prevent solutes and water from passing freely through the para‐cellular space.66, 67 Abberant claudin expression has been reported in several cancer types, including lung, prostate and gastro‐intestinal tumors. Reduced claudin expression results in loss of cell‐to‐cell adhesion and enhances cell motility, invasion and metastasis. Abnormally high levels are also associated with neoplastic growth. Schuetz et al66 studied the expression of claudin‐1 in 30 ES tissue samples and found expression in 63% of the samples. Positive cases showed expression in more than 50% of the cells. In a similar study Machado et al67 found a strong positive staining of claudin‐1 in 285 of 415 tissue samples (76%). Rabinsky et al68 performed a study on real‐time NIR fluorescence endoscopic imaging of mice bearing human colonic adenomas. They used a phage display‐derived peptide CLDN‐1(53‐80) labeled with near‐infrared dye Cy5.5 at the C‐terminus. After intra‐rectal administration they found a significantly higher signal‐to‐background ratio for human colonic adenomas compared to the signal‐to‐background ratio of normal in vivo images. Alternatively, humanized monoclonal antibodies against claudin‐1 are currently being evaluated for therapy, that could also be explored for imaging purposes.69
3.3.2.2. Occludin
Occludin is an integral plasma‐membrane protein that is required for cytokine‐induced regulation and formation of the tight junction para‐cellular permeability barrier. Occludin is able to induce adhesion when cells lack tight junctions.67 Although OCLN, the gene encoding occludin is often downregulated in cancers. It is highly upregulated in ES.33 Machado et al67 studied the expression of several epithelial CAMs in ES, including occludin. Occludin showed a moderate to strong, diffuse membranous staining in 287 out of 415 ES tissue samples (76%). Because occludin is actually downregulated in many tumors, there are currently no occludin targeting agents developed for therapy or imaging.
4. DISCUSSION
In this systematic review, we provide an overview of tumor‐specific biomarkers that could be used for NIR fluorescence guided surgery in ES. Based on a scoring system, nine potentially suitable biomarkers for targeted imaging were identified.
This study has several limitations. The studies evaluated in this systematic review are heterogenic in the evaluation of cell surface expression. Flow cytometry, Western blot analysis, immunohistochemistry or a combination of these techniques are used. Furthermore, some targets like C‐kit and IGF‐1R show a wide range in expression levels among studies whereas several other targets are only investigated in a single study. Also the expression of a target may depend on tumor stage. CXCR4, for example, is associated with more advanced disease.38 The results of the studies evaluated might therefore be less comparable. Finally, we used the recently published surfaceome database in our scoring system to evaluate the upregulation of a potential target in ES. This surfaceome is based on three ES cell lines (A673, TC‐32, and TTC‐466).33 Serial passage of cell lines can cause genotypic and phenotypic variation over an extended period of time. Cell lines might therefor not adequately reflect the true ES surfaceome.
The scoring system used in this review is a guidance tool that helped in selecting potential targets. We chose a score of 7 as the cut‐off point to identify potential targets. Other factors play a role in selecting the most optimal candidate, such as toxicity of an antibody, the availability of a humanized antibody and results from previous studies.
Following this study, immunohistochemical analysis and cell line‐based validation of the potential biomarkers should be performed. Next, imaging of a peptide or an antibody (derivative) conjugated to a fluorophore should be assessed in vitro. Finally, if a target still shows potential, in vivo testing with a specific binding ligand in a tumor mouse model is needed.
5. CONCLUSION
In ES a large number of tumor‐specific biomarkers is upregulated. With the use of a scoring system, we identified CD99, LINGO‐1, C‐kit, NOTCH receptor, CxCR4, NPY receptor Y1, Claudin‐1 and Occludin as the most interesting ES specific biomarkers for the use in NIR fluorescence guided surgery. Further immunohistochemical and cell line‐based research of these potential targets should be performed to elucidate the most optimal candidate. With this study, the first steps are made to explore this promising technique that is on the doorstep of optimizing orthopedic oncologic surgery.
SYNOPSIS
Near infrared fluorescence guided surgery has the potential to improve complete resection of the soft‐tissue component in Ewing sarcoma (ES) and thereby improve survival. It allows for determination of tumor boundaries intra‐operatively. Here we make the first steps to implement this promising technique in ES treatment.
Supporting information
Supplementary file 1– Search strategy
Supplementary file 2– Overview all Ewing sarcoma specific cell surface targets
Supporting information
ACKNOWLEDGMENT
This study was supported by the Team Westland foundation.
Bosma SE, van Driel PB, Hogendoorn PC, Dijkstra PS, Sier CF. Introducing fluorescence guided surgery into orthopedic oncology: A systematic review of candidate protein targets for Ewing sarcoma. J Surg Oncol. 2018;118:906‐914. 10.1002/jso.25224
Footnotes
References
REFERENCES
- 1. Fletcher CDM, Bridge JA, Hogendoorn PCW, Mertens F. WHO Classification of Tumours of Soft Tissue and Bone. 4th ed Lyon, France: IARC Press; 2013. [Google Scholar]
- 2. Damron TA, Ward WG, Stewart A. Osteosarcoma, chondrosarcoma, and Ewing's sarcoma: National Cancer Data Base Report. Clin Orthop Relat Res. 2007;459:40‐47. [DOI] [PubMed] [Google Scholar]
- 3. Esiashvili N, Goodman M, Marcus RB, Jr . Changes in incidence and survival of Ewing sarcoma patients over the past 3 decades: Surveillance Epidemiology and End Results data. J Pediatr Hematol Oncol. 2008;30(6):425‐430. [DOI] [PubMed] [Google Scholar]
- 4. van den Berg H, Kroon HM, Slaar A, Hogendoorn P. Incidence of biopsy‐proven bone tumors in children: a report based on the Dutch pathology registration “PALGA”. J Pediatr Orthop. 2008;28(1):29‐35. [DOI] [PubMed] [Google Scholar]
- 5. Cotterill SJ, Ahrens S, Paulussen M, et al. Prognostic factors in Ewing's tumor of bone: analysis of 975 patients from the European Intergroup Cooperative Ewing's Sarcoma Study Group. J Clin Oncol. 2000;18(17):3108‐3114. [DOI] [PubMed] [Google Scholar]
- 6. Biswas B, Rastogi S, Khan SA, et al. Hypoalbuminaemia is an independent predictor of poor outcome in metastatic Ewing's sarcoma family of tumours: a single institutional experience of 150 cases treated with uniform chemotherapy protocol. Clin Oncol (R Coll Radiol). 2014;26(11):722‐729. [DOI] [PubMed] [Google Scholar]
- 7. Abed R, Grimer R. Surgical modalities in the treatment of bone sarcoma in children. Cancer Treat Rev. 2010;36(4):342‐347. [DOI] [PubMed] [Google Scholar]
- 8. Ahrens S, Hoffmann C, Jabar S, et al. Evaluation of prognostic factors in a tumor volume‐adapted treatment strategy for localized Ewing sarcoma of bone: the CESS 86 experience. Cooperative Ewing Sarcoma Study. Med Pediatr Oncol. 1999;32(3):186‐195. [DOI] [PubMed] [Google Scholar]
- 9. Gaspar N, Hawkins DS, Dirksen U, et al. Ewing sarcoma: current management and future approaches through collaboration. J Clin Oncol. 2015;33(27):3036‐3046. [DOI] [PubMed] [Google Scholar]
- 10. Werier J, Yao X, Caudrelier JM, et al. A systematic review of optimal treatment strategies for localized Ewing's sarcoma of bone after neo‐adjuvant chemotherapy. Surg Oncol. 2016;25(1):16‐23. [DOI] [PubMed] [Google Scholar]
- 11. Foulon S, Brennan B, Gaspar N, et al. Can postoperative radiotherapy be omitted in localised standard‐risk Ewing sarcoma? An observational study of the Euro‐E.W.I.N.G group. Eur J Cancer. 2016;61:128‐136. [DOI] [PubMed] [Google Scholar]
- 12. Bacci G, Longhi A, Briccoli A, Bertoni F, Versari M, Picci P. The role of surgical margins in treatment of Ewing's sarcoma family tumors: experience of a single institution with 512 patients treated with adjuvant and neoadjuvant chemotherapy. Int J Radiat Oncol Biol Phys. 2006;65(3):766‐772. [DOI] [PubMed] [Google Scholar]
- 13. Ozaki T, Hillmann A, Hoffmann C, et al. Significance of surgical margin on the prognosis of patients with Ewing's sarcoma. A report from the Cooperative Ewing's Sarcoma Study. Cancer. 1996;78(4):892‐900. [DOI] [PubMed] [Google Scholar]
- 14. Bölling T, Hardes J, Dirksen U. Management of bone tumours in paediatric oncology. Clin Oncol (R Coll Radiol). 2013;25(1):19‐26. [DOI] [PubMed] [Google Scholar]
- 15. Biswas B, Bakhshi S. Management of Ewing sarcoma family of tumors: current scenario and unmet need. World J Orthop. 2016;7(9):527‐538. [DOI] [PMC free article] [PubMed] [Google Scholar]
- 16. Keereweer S, van Driel PBAA, Snoeks TJA, et al. Optical image‐guided cancer surgery: challenges and limitations. Clin Cancer Res. 2013;19(14):3745‐3754. [DOI] [PubMed] [Google Scholar]
- 17. Nguyen QT, Tsien RY. Fluorescence‐guided surgery with live molecular navigation‐a new cutting edge. Nat Rev Cancer. 2013;13(9):653‐662. [DOI] [PMC free article] [PubMed] [Google Scholar]
- 18. Bu L, Shen B, Cheng Z. Fluorescent imaging of cancerous tissues for targeted surgery. Adv Drug Deliv Rev. 2014;76:21‐38. [DOI] [PMC free article] [PubMed] [Google Scholar]
- 19. Vahrmeijer AL, Hutteman M, van der Vorst JR, van de Velde CJH, Frangioni JV. Image‐guided cancer surgery using near‐infrared fluorescence. Nat Rev Clin Oncol. 2013;10(9):507‐518. [DOI] [PMC free article] [PubMed] [Google Scholar]
- 20. Alander JT, Kaartinen I, Laakso A, et al. A review of indocyanine green fluorescent imaging in surgery. Int J Biomed Imaging. 2012;2012:940585‐26. [DOI] [PMC free article] [PubMed] [Google Scholar]
- 21. Warram JM, de Boer E, Moore LS, et al. A ratiometric threshold for determining presence of cancer during fluorescence‐guided surgery. J Surg Oncol. 2015;112(1):2‐8. [DOI] [PMC free article] [PubMed] [Google Scholar]
- 22. van Dam GM, Themelis G, Crane LMA, et al. Intraoperative tumor‐specific fluorescence imaging in ovarian cancer by folate receptor‐alpha targeting: first in‐human results. Nat Med. 2011;17(10):1315‐1319. [DOI] [PubMed] [Google Scholar]
- 23. Boonstra MC, de Geus SWL, Prevoo HAJM, et al. Selecting targets for tumor imaging: an overview of cancer‐associated membrane proteins. Biomark Cancer. 2016;8:119‐133. [DOI] [PMC free article] [PubMed] [Google Scholar]
- 24. Sand LGL, Buckle T, van Leeuwen FWB, et al. Fluorescent CXCR4 targeting peptide as alternative for antibody staining in Ewing sarcoma. BMC Cancer. 2017;17(1):383. [DOI] [PMC free article] [PubMed] [Google Scholar]
- 25. van Oosten M, Crane LMA, Bart J, van Leeuwen FW, van Dam GM. Selecting potential targetable biomarkers for imaging purposes in colorectal cancer using TArget Selection Criteria (TASC): a novel target identification tool. Transl Oncol. 2011;4(2):71‐82. [DOI] [PMC free article] [PubMed] [Google Scholar]
- 26. Town J, Pais H, Harrison S, et al. Exploring the surfaceome of Ewing sarcoma identifies a new and unique therapeutic target. Proc Natl Acad Sci U S A. 2016;113(13):3603‐3608. [DOI] [PMC free article] [PubMed] [Google Scholar]
- 27. Moher D, Liberati A, Tetzlaff J, Altman DG. Preferred reporting items for systematic reviews and meta‐analyses: the PRISMA statement. J Clin Epidemiol. 2009;62(10):1006‐1012. [DOI] [PubMed] [Google Scholar]
- 28. Tawbi HA, Burgess M, Bolejack V, et al. Pembrolizumab in advanced soft‐tissue sarcoma and bone sarcoma (SARC028): a multicentre, two‐cohort, single‐arm, open‐label, phase 2 trial. Lancet Oncol. 2017;18(11):1493‐1501. [DOI] [PMC free article] [PubMed] [Google Scholar]
- 29. Hung YP, Fletcher CDM, Hornick JL. Evaluation of NKX2‐2 expression in round cell sarcomas and other tumors with EWSR1 rearrangement: imperfect specificity for Ewing sarcoma. Mod Pathol. 2016;29(4):370‐380. [DOI] [PubMed] [Google Scholar]
- 30. McCuiston A, Bishop JA. Usefulness of NKX2.2 immunohistochemistry for distinguishing Ewing sarcoma from other sinonasal small round blue cell tumors. Head Neck Pathol. 2017;12:89‐94. [DOI] [PMC free article] [PubMed] [Google Scholar]
- 31. Shibuya R, Matsuyama A, Nakamoto M, Shiba E, Kasai T, Hisaoka M. The combination of CD99 and NKX2.2, a transcriptional target of EWSR1‐FLI1, is highly specific for the diagnosis of Ewing sarcoma. Virchows Arch. 2014;465(5):599‐605. [DOI] [PubMed] [Google Scholar]
- 32. Yoshida A, Sekine S, Tsuta K, Fukayama M, Furuta K, Tsuda H. NKX2.2 is a useful immunohistochemical marker for Ewing sarcoma. Am J Surg Pathol. 2012;36(7):993‐999. [DOI] [PubMed] [Google Scholar]
- 33. Town J, Pais H, Harrison S, et al. Exploring the surfaceome of Ewing sarcoma identifies a new and unique therapeutic target. Proc Natl Acad Sci U S A. 2016;113(13):3603‐3608. [DOI] [PMC free article] [PubMed] [Google Scholar]
- 34. Kreppel M, Aryee DNT, Schaefer K, et al. Suppression of KCMF1 by constitutive high CD99 expression is involved in the migratory ability of Ewing's sarcoma cells. Oncogene. 2006;25(19):2795‐2800. [DOI] [PubMed] [Google Scholar]
- 35. O'Neill AF, Dearling JLJ, Wang Y, et al. Targeted imaging of Ewing sarcoma in preclinical models using a 64Cu‐labeled anti‐CD99 antibody. Clin Cancer Res. 2014;20(3):678‐687. [DOI] [PMC free article] [PubMed] [Google Scholar]
- 36. Gellini M, Ascione A, Flego M, et al. Generation of human single‐chain antibody to the CD99 cell surface determinant specifically recognizing Ewing's sarcoma tumor cells. Curr Pharm Biotechnol. 2013;14(4):449‐463. [DOI] [PubMed] [Google Scholar]
- 37. Bennani‐Baiti IM, Cooper A, Lawlor ER, et al. Intercohort gene expression co‐analysis reveals chemokine receptors as prognostic indicators in Ewing's sarcoma. Clin Cancer Res. 2010;16(14):3769‐3778. [DOI] [PMC free article] [PubMed] [Google Scholar]
- 38. Berghuis D, Schilham MW, Santos SJ, et al. The CXCR4‐CXCL12 axis in Ewing sarcoma: promotion of tumor growth rather than metastatic disease. Clin Sarcoma Res. 2012;2(1):24. [DOI] [PMC free article] [PubMed] [Google Scholar]
- 39. Sand L, Szuhai K, Hogendoorn P. Sequencing overview of Ewing sarcoma: a journey across genomic, epigenomic and transcriptomic landscapes. Int J Mol Sci. 2015;16(7):16176‐16215. [DOI] [PMC free article] [PubMed] [Google Scholar]
- 40. Vag T, Gerngross C, Herhaus P, et al. First experience with chemokine receptor CXCR4‐targeted PET imaging of patients with solid cancers. J Nucl Med. 2016;57(5):741‐746. [DOI] [PubMed] [Google Scholar]
- 41. Körner M, Reubi JC. NPY receptors in human cancer: a review of current knowledge. Peptides. 2007;28(2):419‐425. [DOI] [PubMed] [Google Scholar]
- 42. Korner M, Waser B, Reubi JC. High expression of neuropeptide Y1 receptors in ewing sarcoma tumors. Clin Cancer Res. 2008;14(16):5043‐5049. [DOI] [PubMed] [Google Scholar]
- 43. Li J, Tian Y, Shan D, et al. Neuropeptide Y Y1 receptor‐mediated biodegradable photoluminescent nanobubbles as ultrasound contrast agents for targeted breast cancer imaging. Biomaterials. 2017;116:106‐117. [DOI] [PubMed] [Google Scholar]
- 44. Mi S, Miller RH, Lee X, et al. LINGO‐1 negatively regulates myelination by oligodendrocytes. Nat Neurosci. 2005;8(6):745‐751. [DOI] [PubMed] [Google Scholar]
- 45. Mi S, Lee X, Shao Z, et al. LINGO‐1 is a component of the Nogo‐66 receptor/p75 signaling complex. Nat Neurosci. 2004;7(3):221‐228. [DOI] [PubMed] [Google Scholar]
- 46. Mosyak L, Wood A, Dwyer B, et al. The structure of the Lingo‐1 ectodomain, a module implicated in central nervous system repair inhibition. J Biol Chem. 2006;281(47):36378‐36390. [DOI] [PubMed] [Google Scholar]
- 47. Pepinsky RB, Arndt JW, Quan C, et al. Structure of the LINGO‐1‐anti‐LINGO‐1 Li81 antibody complex provides insights into the biology of LINGO‐1 and the mechanism of action of the antibody therapy. J Pharmacol Exp Ther. 2014;350(1):110‐123. [DOI] [PubMed] [Google Scholar]
- 48. Mi S, Blake Pepinsky R, Cadavid D. Blocking LINGO‐1 as a therapy to promote CNS repair: from concept to the clinic. CNS Drugs. 2013;27(7):493‐503. [DOI] [PubMed] [Google Scholar]
- 49. Scotlandi K, Benini S, Sarti M, et al. Insulin‐like growth factor I receptor‐mediated circuit in Ewing's sarcoma/peripheral neuroectodermal tumor: a possible therapeutic target. Cancer Res. 1996;56(20):4570‐4574. [PubMed] [Google Scholar]
- 50. Garofalo C, Manara MC, Nicoletti G, et al. Efficacy of and resistance to anti‐IGF‐1R therapies in Ewing's sarcoma is dependent on insulin receptor signaling. Oncogene. 2011;30(24):2730‐2740. [DOI] [PubMed] [Google Scholar]
- 51. Mora J, Rodríguez E, de torres C, et al. Activated growth signaling pathway expression in Ewing sarcoma and clinical outcome. Pediatr Blood Cancer. 2012;58(4):532‐538. [DOI] [PubMed] [Google Scholar]
- 52. Lin F, Shen Z, Xu X, et al. Evaluation of the expression and role of IGF pathway biomarkers in human sarcomas. Int J Immunopathol Pharmacol. 2013;26(1):169‐177. [DOI] [PubMed] [Google Scholar]
- 53. van de Luijtgaarden ACM, Versleijen‐Jonkers YMH, Roeffen MHS, Schreuder HWB, Flucke UE, van der Graaf WTA. Prognostic and therapeutic relevance of the IGF pathway in Ewing's sarcoma patients. Target Oncol. 2013;8(4):253‐260. [DOI] [PubMed] [Google Scholar]
- 54. Zhang H, Zeng X, Li Q, Gaillard‐Kelly M, Wagner CR, Yee D. Fluorescent tumour imaging of type I IGF receptor in vivo: comparison of antibody‐conjugated quantum dots and small‐molecule fluorophore. Br J Cancer. 2009;101(1):71‐79. [DOI] [PMC free article] [PubMed] [Google Scholar]
- 55. Park JY, Murakami T, Lee JY, Zhang Y, Hoffman RM, Bouvet M. Fluorescent‐antibody targeting of insulin‐like growth factor‐1 receptor visualizes metastatic human colon cancer in orthotopic mouse models. PLoS One. 2016;11(1):e0146504. [DOI] [PMC free article] [PubMed] [Google Scholar]
- 56. Macaulay VM, Middleton MR, Protheroe AS, et al. Phase I study of humanized monoclonal antibody AVE1642 directed against the type 1 insulin‐like growth factor receptor (IGF‐1R), administered in combination with anticancer therapies to patients with advanced solid tumors. Ann Oncol. 2013;24(3):784‐791. [DOI] [PMC free article] [PubMed] [Google Scholar]
- 57. Sun Y, Sun X, Shen B. Molecular Imaging of IGF‐1R in Cancer. Mol Imaging. 2017;16:1536012117736648. [DOI] [PMC free article] [PubMed] [Google Scholar]
- 58. Smithey BE, Pappo AS, Hill DA. C‐kit expression in pediatric solid tumors: a comparative immunohistochemical study. Am J Surg Pathol. 2002;26(4):486‐492. [DOI] [PubMed] [Google Scholar]
- 59. Kara IO, Gonlusen G, Sahin B, Ergin M, Erdogan S. A general aspect on soft‐tissue sarcoma and c‐kit expression in primitive neuroectodermal tumor and Ewing's sarcoma. Is there any role in disease process? Saudi Med J. 2005;26(8):1190‐1196. [PubMed] [Google Scholar]
- 60. Metildi CA, Tang CM, Kaushal S, et al. In vivo fluorescence imaging of gastrointestinal stromal tumors using fluorophore‐conjugated anti‐KIT antibody. Ann Surg Oncol. 2013;20(Suppl 3):S693‐S700. [DOI] [PMC free article] [PubMed] [Google Scholar]
- 61. London CA, Gardner HL, Rippy S, et al. KTN0158, a humanized anti‐KIT monoclonal antibody, demonstrates biologic activity against both normal and malignant canine mast cells. Clin Cancer Res. 2017;23(10):2565‐2574. [DOI] [PMC free article] [PubMed] [Google Scholar]
- 62. Leong KG, Karsan A. Recent insights into the role of Notch signaling in tumorigenesis. Blood. 2006;107(6):2223‐2233. [DOI] [PubMed] [Google Scholar]
- 63. Wang Z, Li Y, Kong D, H. sarkar F. The role of Notch signaling pathway in epithelial‐mesenchymal transition (EMT) during development and tumor aggressiveness. Curr Drug Targets. 2010;11(6):745‐751. [DOI] [PMC free article] [PubMed] [Google Scholar]
- 64. Bennani‐Baiti IM, Aryee DN, Ban J, et al. Notch signalling is off and is uncoupled from HES1 expression in Ewing's sarcoma. J Pathol. 2011;225(3):353‐363. [DOI] [PubMed] [Google Scholar]
- 65. Petruzzelli L, Takami M, Humes HD. Structure and function of cell adhesion molecules. Am J Med. 1999;106(4):467‐476. [DOI] [PubMed] [Google Scholar]
- 66. Schuetz AN, Rubin BP, Goldblum JR, et al. Intercellular junctions in Ewing sarcoma/primitive neuroectodermal tumor: additional evidence of epithelial differentiation. Mod Pathol. 2005;18(11):1403‐1410. [DOI] [PubMed] [Google Scholar]
- 67. Machado I, López‐Guerrero JA, Navarro S, et al. Epithelial cell adhesion molecules and epithelial mesenchymal transition (EMT) markers in Ewing's sarcoma family of tumors (ESFTs). Do they offer any prognostic significance? Virchows Arch. 2012;461(3):333‐337. [DOI] [PubMed] [Google Scholar]
- 68. Rabinsky EF, Joshi BP, Pant A, et al. Overexpressed claudin‐1 can be visualized endoscopically in colonic adenomas in vivo. Cell Mol Gastroenterol Hepatol. 2016;2(2):222‐237. [DOI] [PMC free article] [PubMed] [Google Scholar]
- 69. Colpitts CC, Tawar RG, Mailly L, et al. Humanisation of a claudin‐1‐specific monoclonal antibody for clinical prevention and cure of HCV infection without escape. Gut. 2018;67(4):736‐745. [DOI] [PMC free article] [PubMed] [Google Scholar]
Associated Data
This section collects any data citations, data availability statements, or supplementary materials included in this article.
Supplementary Materials
Supplementary file 1– Search strategy
Supplementary file 2– Overview all Ewing sarcoma specific cell surface targets
Supporting information