

ABSTRACT
Osteoclast differentiation is a dynamic differentiation process, which is accompanied by dramatic changes in metabolic status as well as in gene expression. Recent findings have revealed an essential connection between metabolic reprogramming and dynamic gene expression changes during osteoclast differentiation. However, the upstream regulatory mechanisms that drive these metabolic changes in osteoclastogenesis remain to be elucidated. Here, we demonstrate that induced deletion of a tumor suppressor gene, Folliculin (Flcn), in mouse osteoclast precursors causes severe osteoporosis in 3 weeks through excess osteoclastogenesis. Flcn‐deficient osteoclast precursors reveal cell autonomous accelerated osteoclastogenesis with increased sensitivity to receptor activator of NF‐κB ligand (RANKL). We demonstrate that Flcn regulates oxidative phosphorylation and purine metabolism through suppression of nuclear localization of the transcription factor Tfe3, thereby inhibiting expression of its target gene Pgc1. Metabolome studies revealed that Flcn‐deficient osteoclast precursors exhibit significant augmentation of oxidative phosphorylation and nucleotide production, resulting in an enhanced purinergic signaling loop that is composed of controlled ATP release and autocrine/paracrine purinergic receptor stimulation. Inhibition of this purinergic signaling loop efficiently blocks accelerated osteoclastogenesis in Flcn‐deficient osteoclast precursors. Here, we demonstrate an essential and novel role of the Flcn‐Tfe3‐Pgc1 axis in osteoclastogenesis through the metabolic reprogramming of oxidative phosphorylation and purine metabolism. © 2018 The Authors Journal of Bone and Mineral Research published by Wiley Periodicals, Inc. on behalf of American Society for Bone and Mineral Research (ASBMR).
Keywords: OSTEOCLAST, FOLLICULIN (FLCN), METABOLISM, OSTEOPOROSIS, TRANSCRIPTION FACTORS
Introduction
Cellular metabolism regulates cell proliferation and differentiation. Recent emerging developments in the research field of metabolism are defining many novel molecular mechanisms involved in cell differentiation. Osteoclastogenesis is one of the most dramatic cell differentiation events, which is accompanied by dynamic changes in cellular metabolism and gene expression. Thus, the osteoclast differentiation process is one of the best physiological conditions in which to investigate novel mechanisms of metabolic regulation that drive cell differentiation. It is known that glucose metabolism shifts toward a more oxidative state when osteoclast precursors differentiate to pre‐osteoclasts and osteoclasts upon receptor activator of NF‐κB ligand (RANKL) stimulation. Induction of Pgc1β expression by RANKL stimulation causes the aforementioned metabolic reprogramming of osteoclast precursors, resulting in a dramatic change in cellular metabolite profiling, which in turn regulates gene expression that facilitates osteoclastogenesis.1, 2, 3
Folliculin (FLCN) was originally identified as a tumor suppressor gene that is responsible for a hereditary kidney cancer syndrome, Birt‐Hogg‐Dubé (BHD) syndrome. Folliculin (FLCN) was a novel protein without any known functional domain when it was first identified in 2002.4 Subsequent research mainly in Flcn‐deficient mouse models has uncovered multiple functions of Flcn in metabolic regulation and a fundamental role in many physiological processes in vivo.5, 6, 7, 8, 9, 10, 11, 12, 13, 14 We have previously shown that Flcn regulates oxidative metabolism through the expression control of Pgc1α in murine skeletal muscle and cardiomyocytes. Loss of Flcn causes increased mitochondrial biogenesis, resulting in elevated levels of cellular ATP.15, 16
Here, we found that bone marrow targeted Flcn KO mice showed a severe osteoporotic phenotype with increased osteoclast number and bone absorption. We hypothesized that Flcn might have an essential role in osteoclast differentiation through metabolic regulation and aimed to clarify the role of FLCN in osteoclastogenesis from the aspect of metabolism. We found that Flcn deficiency enhanced a metabolic shift toward oxidative phosphorylation and increased nucleotide production, which resulted in a dramatic elevation of purinergic metabolites in Flcn‐deficient osteoclast precursors. Purinergic metabolites themselves can stimulate purinergic receptors, thereby establishing a purinergic signaling loop. Moreover, we showed that the intervention of a purinergic signaling loop could block the accerelated osteoclastogenesis of Flcn‐deficient cells. Our novel findings will provide new insights into the metabolic regulation of osteoclast differentiation by Flcn and the basis for understanding the role and upstream regulation mechanism of metabolic reprogramming and purinergic signaling in osteoclastogenesis.
Materials and Methods
Mice and bone analysis
Flcn conditional knockout mice were generated as previously described.5 An Mx1‐Cre 17 transgene was introduced into Flcnf/f mice. Flcnf/f;Mx1‐Cre+ mice and Flcnf/f littermates mice were injected intraperitoneally at 11 weeks of age with 300 μg of polyinosinic–polycytidylic acid solution (pIpC) (tlrl‐pic, Invivogen) 2 times every other day. Three‐dimensional microcomputed tomography (µCT) analyses were performed as described previously.2 Bone morphometric analyses were performed by KUREHA Special Laboratory. The nomenclature, symbol, and units of bone histomorphometry and bone morphometry were used according to Bouxsein and colleagues and Dempster and colleagues.18, 19 All animal experiments were approved by Kumamoto University Animal Care and Use Committee and performed in accordance with the legal requirements of the Association for Assessment and Accreditation of the Laboratory Animal Care International and the guidelines of Kumamoto University for Animal Care and Use Committee. All mice were housed in an accredited animal facility of Kumamoto University under a 12‐hour light/dark cycle with access to regular food and water ad libitum.
Cell culture
Raw264.7 cells were cultured with RPMI‐1640 supplemented with 10% FCS (HyClone, GE Healthcare, Piscataway, NJ, USA), 100 U/mL penicillin, 100 µg/mL streptomycin. Raw 264.7 cells were transfected with the expression construct (pCAG‐Tfe3.GR‐IRES‐Puro) by using Lipofectamine 2000 (Thermo Fisher Scientific, Waltham, MA, USA), followed by clonal selection with 3.0 µg/mL of puromycin. Raw 264.7 cell clones stably expressing a scrambled or a Flcn‐specific shRNA were established by utilizing lentiviruses produced by the modified pLVX‐shRNA2‐ZsGreen system. The single clones of ZsGreen‐positive cells were isolated by FACSAriaII (Becton Dickinson, Franklin Lakes, NJ, USA). The shRNA for mouse Flcn (target sequence: CTTCAAGTCTCTTCGACACAT) was selected according to a previous report.20 For siRNA‐mediated gene knockdown, 30 pmol of siRNA was transfected using Screen Fect siRNA (Wako, Richmond, VA, USA) into 2 × 10⁵ cells per well in a 12‐well plate. To collect conditioned culture media, 450 pmol of siRNA was transfected into 3 × 10⁶ cells per 10 cm culture dish. The following siRNAs were utilized: Flcn: Stealth siRNA for Flcn, MSS278133; UUCAAACGCUGAAUGGACCAGGUUC (Life Technologies, Carlsbad, CA, USA) and Stealth siRNA negative control med GC, 12935‐300 (Life Technologies). For double knockdown experiments, the Flcn‐targeting shRNA lentivirus vector with a Puromycin‐resistance gene (pLV[shRNA]‐Puro‐U6>mFlcn[shRNA#6]) and the Tfe3‐targeting shRNA lentivirus vector with a Blasticidin‐resistance gene (pLV[shRNA]‐Bsd‐U6>mTfe3[shRNA#11]) were purchased from VectorBuilder (Santa Clara, CA, USA). Chemicals used for cell culture experiments were as follows: CV1808 (#1710, Tocris Bioscience, Bristol, UK), FCCP (#C2920, Sigma, St. Louis, MO, USA), oATP (#A6779, Sigma), Mefloquin (#SC‐211784, Santa Cruz Biotechnology, Dallas, TX, USA), and ADA (#52544, Sigma).
In vitro osteoclast differentiation assay
An amount of 1.5 × 10⁴ Raw264.7 cells/well in a 24‐well plate were transfected with scramble siRNA or Flcn‐targeted siRNA. After 24 hours, the medium was changed to differentiation medium: MEMα containing 10% FCS (HyClone) without or with 40 ng/mL of RANKL (Oriental Yeast, Tokyo, Japan). Medium was changed every other day. Then, cells were fixed and subjected to TRAP staining using Acid Phosphatase, Leukocyte (TRAP) Kit (Sigma‐Aldrich). TRAP‐positive multinucleated (3 or more nuclei) and large (diameter ≥ 200 μm) cells were counted as osteoclasts. Images of each well were obtained by BZ‐X700 microscope (Keyence, Itasca, IL, USA). Areas of TRAP‐positive multinucleated osteoclasts were measured by BZ‐X Analyzer software (Keyence).
Tetramethylrhodamine, ethyl ester (TMRE)‐mitochondrial membrane potential assay by flow cytometry
BM mononuclear cells were treated with tetramethylrhodamine, ethyl ester (TMRE) (Enzo, Farmingdale, NY, USA) at a final concentration of 25 μM for 30 minutes at 37°. Subsequently, the cells were washed, incubated with Fc block (BD Biosciences, San Jose, CA, USA) and stained with anti‐Mac‐1 (M1/70, BD Biosciences) on ice and subjected to flow cytometry analysis.
cAMP measurement
RAW264.7 cells were transfected with scramble siRNA or Flcn‐targeted siRNA. After 24 hours, the medium was changed to differentiation medium with RANKL, followed by 48‐hour culture and harvest for cAMP measurement. Intracellular cAMP was measured by competitive enzyme immunoassay (EIA) according to the manufacturer's instructions (Cayman Chemical, Ann Arbor, MI, USA).
Quantitative RT‐PCR (qRT‐PCR)
Total RNA was isolated using TRIzol Reagent (Thermo Fisher Scientific) and reverse transcribed to cDNA using ReverTra Ace qPCR RT Master Mix (Toyobo, Osaka, Japan). qPCR assays were performed with the Roche Lightcycler 96 system (Roche, Mannheim, Germany) and the Thunderbird Sybr qPCR Mix (Toyobo). Primer sequences are given in Supplemental Table S1. Each value was normalized using the value of Rps18 as an internal control.
DNA microarray analysis
Raw264.7 cells were transfected with scramble or Flcn targeting siRNA, followed by a medium change at 24 hours after transfection. Cells were cultured after an additional 48 hours and total RNA was collected and purified using the RNeasy Micro Kit (Qiagen, Hilden, Germany). cDNA preparation and hybridization of the probe arrays were performed according to the manufacturer's instructions (Affymetrix, Santa Clara, CA, USA). Affymetrix GeneChip Mouse Genome 430 2.0 arrays were applied. Data were processed using the Affymetrix GeneChip Operating Software (GCOS) Version 1.0. Data are available at the NCBI GEO database under accession number GSE115084.
Immunocytochemistry (ICC)
Tfe3 staining with anti TFE3 antibody (Sigma, #HPA023881) was performed as previously described.21 Fluorescence images were obtained using a confocal laser‐scanning microscope (Nikon, A1R). Scanning was performed in sequential laser emission mode to avoid scanning at other wavelengths.
Chromatin immunoprecipitation (ChIP)‐qPCR
RAW264.7 cells expressing Tfe3‐GR were cultured for 48 hours with or without 100 nM of Dexamethasone. SimpleChIP Plus Enzymatic Chromatin IP Kit (Magnetic Beads) (#9005, Cell Signaling, Danvers, MA, USA) was utilized for ChIP. Cell cross‐linking, chromatin preparation, and chromatin immunoprecipitation by anti TFE3 antibody (Sigma, #HPA023881) was performed according to the manufacturer's instructions. Primer sequences for qPCR assays are given in Supplemental Table S2.
Metabolome analysis
Raw264.7 cells were transfected with scramble or Flcn‐targeted siRNA, followed by a medium change to MEMα containing 10% FCS (HyClone) and 40 ng/mL of RANKL at 24 hours after transfection. After 48‐hour culture, the cells were washed twice with 5% (w/v) aqueous mannitol solution. Then, 1 mL of methanol containing the internal standards (25 µmol/L each of methionine sulfone and D‐camphor‐10‐sulfonic acid) was added. After 10‐minute incubation, the 400 µL of dissolved solution was mixed with 200 μL of Milli‐Q water and 400 μL of chloroform. After centrifugation, the separated methanol‐water layer was ultrafiltered using a 5‐kDa cut‐off filter (Human Metabolome Technologies, Tsuruoka, Japan) to remove proteins. The filtrate was dried using an vacuum centrifuge and dissolved in 50 µL of Milli‐Q water containing 200 µmol/L reference compounds (3‐aminopyrrolidine and trimesic acid) before CE‐MS analysis. CE‐MS‐based metabolomic profiling and data analysis were performed essentially as described.22, 23, 24, 25, 26
Statistical analysis
Experimental data are summarized as the mean values with standard deviation SD. Statistical analyses were performed using a two‐tailed unpaired t test with or without Welch's correction. For multiple comparisons, one‐way ANOVA Dunnett's multiple comparisons test was utilized (GraphPad Prism 6, GraphPad, La Jolla, CA, USA). Differences were considered to be statistically significant at a value of p < 0.05.
Results
Severe osteoporosis in bone marrow targeted Flcn knockout mice caused by enhanced osteoclastogenesis
To investigate the significance of metabolic reprogramming in osteoclast differentiation, we conditionally deleted Flcn by utilizing Mx1 promoter‐driven Cre transgenic mice.17 Flcn knockout mice (Flcnf/f, Mx1‐cre) demonstrated severe osteoporosis with acute progression in 3 weeks after Flcn deletion induced by pIpC injection. 3D reconstruction of femora by micro‐CT analysis revealed severe osteoporosis of Flcn knockout mice. As shown in Fig. 1 A, trabecular bone in Flcn knockout mice was dramatically reduced. Furthermore, the inner surface of the cortical bone in Flcn knockout mice was irregular with many dents or holes (Fig. 1 A). Quantified bone volume fraction and trabecular numbers in Flcn knockout mice were reduced more than 50% compared with control Flcnf/f mice (Fig. 1 B, C). Bone histomorphometric analysis also revealed severe osteoporosis in Flcn knockout mice with reduced bone volume, trabecular number, and increased trabecular separation (Fig. 1 D–G). The eroded surface generated by osteoclasts was significantly greater in Flcn knockout mice (Fig. 1 H). In support of these data, osteoclast number (Fig. 1 I) and osteoclast surface (Fig. 1 J) were significantly greater in Flcn knockout mice compared with controls. These observations of static bone resorption parameters strongly support enhanced osteoclastogenesis in Flcn knockout mice. On the other hand, there were no significant differences in static bone formation parameters, including osteoblast surface, osteoid volume, osteoid surface, and osteoid thickness (Fig. 1 K–N). Dynamic bone formation parameters including mineral apposition rate, mineralizing surface, and bone formation rate demonstrated no statistically significant differences between Flcn knockout mice and control mice (Fig. 1 O–Q). These data demonstrate that severe osteoporosis in Flcn knockout mice is caused by enhanced osteoclastogenesis.
Figure 1.

Severe osteoporosis with increased osteoclast number and accelerated bone absorption in bone marrow targeted Flcn KO mice. (A) Representative images showing μCT of femora from Flcn f/f;Mx1‐Cre− (C: Flcn WT) mice (upper panel) and Flcn f/f;Mx1‐Cre+(KO: Flcn KO) mice (lower panel). Mice were treated with pIpC at 11 weeks of age and dissected 3 weeks after pIpC treatment. Flcn KO mice demonstrate dramatically reduced trabecular bone and thinner cortical bone with many abnormal dents. Scale bars = 2 mm. (B, C) Bone morphological parameters calculated from μCT scans demonstrate severe osteoporosis in Flcn KO mice. Data are presented as mean with SD (n = 5 mice for each group, unpaired t test: *p < 0.05). Bone volume fraction (BV/TV) and trabecular number (Tb.N) were significantly lower in Flcn KO mice. (D) Representative images of the Toluidine blue staining of femora from Flcn WT (C) (n = 5) and Flcn KO (KO) (n = 4) mice at 3 weeks after pIpC injection. Osteoclasts are indicated by arrowheads. Scale bars = 500 μm (left panel), 50 μm (right panel). (E–Q) Histomorphometric analysis on Toluidine blue–stained femora demonstrates osteoporosis and accelerated bone absorption. Data are presented as mean with SD (n = 5 for Flcn WT; n = 4 for Flcn KO, unpaired t test: n.s. = not significant, *p < 0.05, **p < 0.01, ***p < 0.001, ****p < 0.0001). (E–G) Bone volume (BV/TV), trabecular number (Tb.N), and trabecular separation (Tb.Sp) were significantly lower in Flcn KO mice. (H, I) Eroded surface (ES/BS) and osteoclast number (Oc.N/B.Pm) were significantly higher in Flcn KO mice. (J) Osteoclast surface (Oc.S/BS) was significantly higher in Flcn KO mice. (K–N) Osteoblast surface (Ob.S/BS), osteoid volume (OV/BV), and osteoid surface (OS/BS) did not show statistical significance between Flcn WT and Flcn KO mice. (O–Q) Dynamic bone histomorphometric analysis with calcein labeling demonstrated no significant difference in dynamic bone formation parameters, including mineral apposition rate (MAR), mineralizing surface (MS/BS), and bone formation rate (BFR/BS) between Flcn WT and Flcn KO mice.
Cell autonomous enhancement of osteoclastogenesis in Flcn‐deficient osteoclast precursors
To investigate if enhancement of osteoclastogenesis in Flcn knockout mice is caused by a cell autonomous mechanism or microenvironment‐dependent mechanism, we performed an in vitro osteoclast differentiation assay. Osteoclast precursors from bone marrow of Flcn knockout mice and control mice were cultured with M‐CSF and RANKL for 4 days and stained for TRAP activity. TRAP‐positive multinucleated osteoclast numbers and areas were quantified. Flcn knockout osteoclast precursors have greater differentiation ability than wild‐type control cells (Fig. 2 A–C). The cell autonomous role of Flcn in osteoclastogenesis was also evaluated in the RAW264.7 osteoclast precursor cell line. siRNA mediated Flcn knockdown in RAW264.7 cells dramatically enhanced osteoclastogenesis with a low dose of RANKL (40 ng/mL) in 120 hours (Fig. 2 D–F). Flcn knockdown RAW264.7 cells did not proliferate faster than control cells, which indicates that accelerated osteoclastogenesis of Flcn‐deficient osteoclast precursors is not caused by increased cell proliferation (Fig. 2 G). Flcn knockdown efficacy was confirmed by quantifying gene expression of Gpnmb, whose elevation is a specific readout for Flcn deficiency21 (Fig. 2 H, I). Expression of readout genes for osteoclast differentiation, including Integrin β3, Cathepsin K, Trap, and Oscar, was measured by qRT‐PCR in RAW264.7 cells transfected with Flcn‐targeted siRNA or scramble siRNA (Fig. 2 J–M). Flcn knockdown made RAW264.7 cells sensitive to RANKL stimulation, thereby promoting osteoclast differentiation, which was demonstrated by greater induction of readout gene expression. Nfatc1 is known as a master transcription factor for osteoclastogenesis and its expression is induced upon RANKL stimulation.27 Intriguingly, Nfatc1 expression was increased in Flcn knockdown cells even without RANKL stimulation and was dramatically elevated upon RANKL stimulation for 48 hours (Fig. 2 N). Taken together, these data demonstrate the cell autonomous enhancement of osteoclastogenesis by loss of Flcn in osteoclast precursors.
Figure 2.
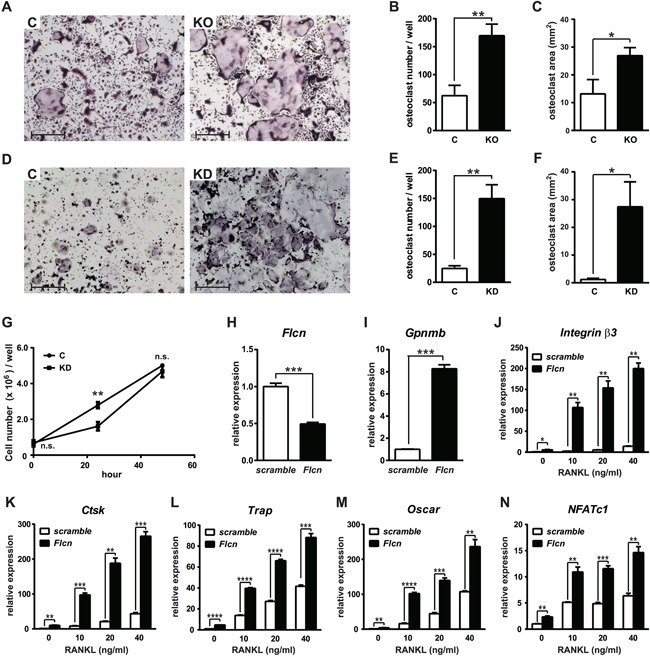
Enhanced osteoclastogenesis in Flcn‐deficient osteoclast precursor cells. (A) Osteoclast precursors from Flcn f/f;Mx1‐Cre− (C) mice and Flcn f/f;Mx1‐Cre+(KO) mice were cultured with M‐CSF (100 ng/mL) and RANKL (100 ng/mL) for 96 hours, followed by TRAP staining. More multinucleated TRAP‐positive osteoclasts were differentiated from Flcn‐deficient osteoclast precursor cells. Scale bars = 400 μm. (B) The number of multinucleated (3 or more nuclei) TRAP‐positive osteoclasts in 24‐well plates. (C) The area of multinucleated TRAP‐positive osteoclasts in 24‐well plates. There were significantly more osteoclasts differentiated from Flcn‐deficient osteoclast precursors. Data represent means ± SD (triplicate, unpaired t test: *p < 0.05, **p < 0.01). (D) Mouse osteoclast precursor cell line RAW264.7 cells were transfected with scramble siRNA (C) or Flcn siRNA (KD). At 24 hours after transfection, culture medium was changed to MEMα containing 40 ng/mL of RANKL and cultured for additional 120 hours for osteoclastic differentiation, followed by TRAP staining. Scale bars = 1 mm (E) The number of multinucleated (3 or more nuclei) TRAP‐positive osteoclasts in 24‐well plates. (F) The area of multinucleated TRAP‐positive osteoclasts in 24‐well plates. Data represent means ± SD (triplicate, unpaired t test: *p < 0.05, **p < 0.01). (G) RAW264.7 cells were transfected with scramble siRNA (C) or Flcn siRNA (KD) in 6‐well plates. At 24 hours after transfection, culture medium was changed to MEMα containing 40 ng/mL of RANKL and the number of Trypan blue–negative viable cells were counted at 0 hour, 24 hours, and 48 hours after the medium change. Data represent means ± SD (triplicate, unpaired t test: **p < 0.01). (H) Flcn knockdown was confirmed by qRT‐PCR on siRNA transfected RAW264.7 cells. (I) Elevated Gpnmb expression, a readout for Flcn deficiency, was observed in Flcn knockdown RAW264.7 cells. (J–N) RAW264.7 cells were transfected with scramble siRNA or Flcn siRNA. At 24 hours after transfection, culture medium was changed to differentiation medium containing different concentrations of RANKL. After additional 48 hours of culture with RANKL/MEMα, mRNA expression was measured by qRT‐PCR to evaluate osteoclastic differentiation. Readout genes for osteoclastogenesis including Integrin β3 (J), Cathepsin K (K), Trap (L), and Oscar (M) were expressed at significantly higher levels in Flcn knockdown cells. (N) The expression of Nfatc1 was elevated in Flcn knockdown cells even in the absence of RANKL stimulation. Data represent means ± SD (triplicate, unpaired t test: *p < 0.05, **p < 0.01, ***p < 0.001, ****p < 0.0001). Representative data from at least three independent experiments are shown.
Involvement of Flcn‐Tfe3‐Pgc1 axis in osteoclastogenesis
We and others have previously shown that FLCN negatively regulates transcriptional activity of TFE3 transcription factor by regulating its nuclear localization.20, 21, 28 We confirmed that Tfe3 localized predominantly in the nucleus of Flcn‐deficient RAW264.7 cells, whereas Tfe3 localized in the cytoplasm of control cells (Fig. 3 A). Increased transcriptional activity of Tfe3 in Flcn knockdown cells was confirmed by elevated Gpnmb expression, which is a known Tfe3 transcriptional target gene (Fig. 3 C). To see the contribution of Tfe3 activation for enhanced osteoclastogenesis in Flcn‐deficient osteoclast precursors, we performed shRNA‐mediated knockdown of Tfe3 in Flcn knockdown RAW264.7 cells (Fig. 3 D). As shown in Fig. 3 E, increased Integrin β3 expression by Flcn knockdown was greatly suppressed by additional Tfe3 knockdown. To see the importance of Tfe3 nuclear localization for enhanced osteoclastogenesis in Flcn‐deficient osteoclast precursors, we have generated a RAW264.7 cell line stably expressing Tfe3‐GR fusion protein. Tfe3‐GR is an artificial fusion protein, in which glucocorticoid receptor ligand binding domain (GR) is fused to Tfe3. Thus, Tfe3‐GR nuclear translocation can be induced in Flcn intact cells by addition of dexamethasone to the culture medium (Fig. 3 F). The dramatic induction of Gpnmb expression by dexamethasone treatment confirmed an efficient activation of Tfe3 (Fig. 3 G). Pgc1β is known to have an essential role in osteoclastogenesis.1 We observed a significant increase in Pgc1β expression caused by forced nuclear localization of Tfe3‐GR, suggesting possible transcriptional regulation of Pgc1β by Tfe3, as has been demonstrated for Pgc1α (Fig. 3 L, M).29 Then, we confirmed the direct binding of Tfe3 to the M‐box motifs in Pgc1β gene as well as Pgc1α gene by ChIP‐qPCR, which was specifically observed in Tfe3 activated cells (Fig. 3 J, K). Indeed, the expression of Cytochrome c, a target gene of Pgc1, was induced upon Tfe3 activation (Fig. 3 L). In addition, readout genes for osteoclast differentiation, Integrin β3, Cathepsin K, and Oscar, were significantly induced by forced nuclear localization of Tfe3 in Flcn intact cells even without RANKL stimulation (Fig. 3 M–O). Previously, we have shown an essential role of Impdh2, the rate‐limiting enzyme for purine metabolism, whose expression is regulated by MITF transcription factor, for HSC proliferation.30 Activation of Tfe3, an MITF family transcription factor, also induced Impdh2 expression significantly (Fig. 3 P). These data demonstrate that the nuclear translocation of Tfe3 induced by Flcn loss contributes to the enhancement of osteoclastogenesis presumably through the activation of its target genes, including Pgc1.
Figure 3.

Flcn regulates osteoclastogenesis partly through Tfe3‐Pgc1 axis. (A) Immunofluorescent staining of endogenous Tfe3 demonstrated nuclear localization of Tfe3 in shRNA mediated Flcn knockdown RAW264.7 cells, whereas control RAW264.7 cells revealed cytoplasmic localization of Tfe3. Blue: DAPI; red: Tfe3. Scale bars = 20 μm. (B, C) qRT‐PCR on RAW264.7 cell lines stably transfected with control‐shRNA vector and Flcn‐shRNA vector. Efficient Flcn knockdown was confirmed by lower Flcn mRNA expression (B) and elevated Gpnmb mRNA expression (C) by qRT‐PCR. (D) Flcn targeted or control shRNA encoding lentiviral vectors with puromycin resistance cassette were co‐infected with Tfe3 targeted or control shRNA encoding lentiviral vectors with Blasticidin resistance cassette into RAW264.7 cells in a 12‐well plate. At 24 hours after infection, medium was changed to selection medium containing 10 μg/mL of Puromycin and 6 μg/mL of Blasticidin. After the 48‐hour culture with selection medium, cells were reseeded with MEMα medium and cultured for an additional 72 hours, followed by harvest and qRT‐PCR. Efficient shRNA‐mediated Tfe3 knockdown was confirmed by qRT‐PCR. (E) Integrin β3 gene expression was quantified on the same samples in Fig. 3 D. Additional Tfe3 knockdown on Flcn knockdown RAW264.7 cells significantly suppressed Integrin β3 expression. (F) Immunofluorescent staining with anti‐TFE3 antibody on RAW264.7 cells expressing Tfe3‐GR (Tfe3‐GR#1), which were cultured without dexamethasone or with 100 nM of dexamethasone. Dexamethasone‐dependent forced nuclear translocation of Tfe3‐GR was observed. Blue: DAPI, red: Tfe3. Scale bars = 10 μm. (G–L) Tfe3‐GR cells were cultured for 48 hours with or without dexamethasone, followed by gene expression quantification by qRT‐PCR. (G) Gpnmb, a known transcriptional target gene of Tfe3, was significantly elevated by forced nuclear translocation of Tfe3. (H, I) Pgc1α and Pgc1β master transcriptional regulators of mitochondrial biogenesis were significantly elevated by Tfe3 nuclear localization. (J, K) Tfe3‐GR#1 cells were cultured with or without 100 nM of dexamethasone, followed by chromatin immunoprecipitation (ChIP) with control IgG and anti‐TFE3 antibody. Tfe3 binding to M‐box consensus sequences in the Pgc1α gene (J) and the Pgc1β gene (K) were quantified by qPCR on ChIP samples and the fold enrichments relative to the input chromatins were calculated. (L) The expression of Cytochrome c, a target gene of Pgc1, was quantified by qRT‐PCR. (M–O) qRT‐PCR results indicate that the expression of readout genes for osteoclast differentiation was dramatically induced by forced nuclear translocation of Tfe3 even without RANKL stimulation. (P) qRT‐PCR of Impdh2, which is a known target of MITF. Data represent means ± SD (triplicate, unpaired t test: *p < 0.05, **p < 0.01, ***p < 0.001, ****p < 0.0001). Representative data from at least three independent experiments are shown.
Flcn regulates mitochondrial biogenesis and purine metabolism
For the purpose of elucidating the molecular mechanism of accelerated osteoclastogenesis in Flcn‐deficient cells, we performed comprehensive gene expression profiling. A gene set enrichment analysis (GSEA)31 demonstrated a highly significant gene enrichment for an oxidative phosphorylation signature in Flcn knockdown cells (Fig. 4 A, Supplemental Fig. S1A). As shown in Fig. 4 A, most genes involved in the oxidative phosphorylation gene set were upregulated in Flcn‐deficient cells compared with control cells. Gene expression of representative genes was confirmed by qRT‐PCR (Fig. 4 B–G). These results are consistent with our previous report that Flcn deficiency caused upregulation of Pgc1α, a master regulator for mitochondrial biogenesis, resulting in increased mitochondria mass, oxidative phosphorylation, and ATP production in striated muscle, heart, and kidney cancer cell lines.15, 16 As we have shown in Fig. 3 H–K, Pgc1α and Pgc1β expression is regulated by Tfe3. Indeed, Pgc1β expression was significantly higher in Flcn knockdown cells, suggesting that it has an important role in the dramatic shift of gene expression toward oxidative phosphorylation (Fig. 4 H). To see the physiological outcome of this characteristic gene expression profile, we measured mitochondrial membrane potential by TMRE staining on bone marrow–derived Mac1‐positive cells from Flcnf/f control mice and Flcnf/f, Mx1‐Cre mice at 2 weeks after pIpC injection. Indeed, the mitochondrial membrane potential was significantly higher in Flcn KO Mac1+ cells. (Fig. 4 I–K). In addition to oxidative phosphorylation, GSEA demonstrated significant gene enrichment for purine metabolism in Flcn knockdown RAW264.7 cells (Fig. 4 L, Supplemental Fig. S1B). Many genes listed in the purine metabolism gene set, including Rrm2, Ak2, and Impdh2, were upregulated in Flcn‐deficient cells (Fig. 4 M–O). These results strongly suggest the importance of metabolic regulation directed by Flcn in osteoclastogenesis.
Figure 4.

Significant metabolic changes in Flcn‐deficient osteoclast precursors. (A) Enrichment plots of gene set enrichment analysis (GSEA) (HALLMARK_OXIDATIVE_PHOSPHORYLATION: normalized enrichment score [NES] = 1.97, normalized p value [NOM p‐val] = 0.000, false discovery rate q value [FDR q‐val] = 0.000) Affymetrix GeneChip mediated comprehensive gene expression profiling was performed on RAW264.7 cells transfected with scramble siRNA or Flcn targeted siRNA. GSEA demonstrated that upregulated genes in Flcn‐deficient cells were significantly enriched in the oxidative phosphorylation gene set signature. (B–G) qRT‐PCR analysis of representative genes from the oxidative phosphorylation signature on RAW264.7 cells transfected with scramble siRNA (C) or Flcn targeted siRNA (KD). (H) The expression of Pgc1β, a master regulator for mitochondrial biogenesis in osteoclastogenesis, was significantly elevated in Flcn knockdown cells. Data represent means ± SD (triplicate, unpaired t test: *p < 0.05, **p < 0.01, ***p < 0.001, ****p < 0.0001). Representative data from three independent experiments are shown. (I–K) Mitochondrial membrane potential was measured by tetramethylrhodamine methyl ester (TMRM) staining of bone marrow cells from Flcn WT and KO mice at 14 days after pIpC injection. (I) Representative flow cytometry of Mac1 × TMRE. (J, K) Mean fluorescence intensity of TMRE in Mac1+ cells was measured and shown in a bar graph. Data are presented as mean with SD (n = 4 for WT and KO, unpaired t test: **p < 0.01). (L) Another significant enrichment plot by GSEA revealed significant positive correlation between upregulated genes in Flcn‐deficient RAW264.7 cells and the purine metabolism signature gene set. (KEGG_PURINE_METABOLISM: NES = 0.63, NOM p‐val = 0.002, FDR q‐val = 0.033). (M–O) qRT‐PCR analysis of representative genes from the purine metabolism signature on RAW264.7 cells transfected with scramble siRNA (C) or Flcn targeted siRNA (KD). (M) Rrm2, (N) Ak2, (O) Impdh2. Data represent means ± SD (triplicate, unpaired t test: *p < 0.05, **p < 0.01). Representative data from three independent experiments are shown.
Regulation of nucleotide production and purinergic signaling loop by Flcn
To clarify the significance of this Flcn‐mediated metabolic regulation, we performed a metabolomics analysis on RAW264.7 cells by CE‐TOF MS.25 We compared quantitative metabolome profiling of Flcn knockdown and control RAW264.7 cells stimulated with RANKL at a concentration of 40 ng/mL for 48 hours. As we previously observed in skeletal muscle,15 loss of Flcn caused significant elevation of metabolites in the oxidative phosphorylation and the pentose phosphate pathways, which is represented by Ru5P and PRPP (Fig. 5). This metabolic change was accompanied by increased nucleotide production as observed by dramatic elevation of inosine monophosphate (IMP), from which adenine and guanine nucleotides are subsequently formed (Fig. 5). Among these purine metabolites, adenosine was prominently elevated in Flcn knockdown RANKL‐stimulated RAW264.7 cells (Fig. 5). Because adenosine, ADP, and ATP could work as signaling molecules to stimulate purinergic receptors (Fig. 6 A) and activate intracellular signaling pathways including cyclic AMP production, PI3K pathway, MAP kinase pathway, and calcium signaling,32, 33, 34, 35 we hypothesized that increased purinergic signaling had an essential role in enhanced osteoclastogenesis of Flcn‐deficient osteoclast precursors. The purinergic receptor P2rx7 is involved in controlled ATP release to the extracellular space and has an important role in physiological osteoclast differentiation.36, 37, 38, 39 P2rx7 mRNA expression was significantly higher in RANKL‐stimulated Flcn‐deficient cells (Fig. 6 B). The hemichannel Pannexin1 (Panx1) is known to be responsible for P2rx7‐mediated controlled ATP release.40 Panx1 mRNA expression was also significantly higher in Flcn‐deficient cells (Fig. 6 C). Released ATP is sequentially dephosphorylated by cell surface ectonucleotidases CD39 and CD73 and can stimulate adenosine receptors, which are G‐protein‐coupled receptors.41, 42, 43 Adenosine is transported across the plasma membrane through the nucleoside transporter ENT1 and utilized for nucleotide production (Fig. 6 A). Importantly, all of these players in the purinergic molecule–mediated signaling loop were expressed at significantly higher levels in Flcn‐deficient cells (Fig. 6 B–F). In addition, the expression of adenosine receptor Adora2a was also higher in Flcn‐deficient cells (Fig. 6 G). These results suggest a novel mechanism for regulation of the purinergic signaling loop by Flcn through increased nucleotide production and purine metabolism. Significant elevation of cAMP level in Flcn‐deficient RAW264.7 cells supports this idea (Fig. 6 H). To further investigate the role of a purinergic signaling loop for accelerated osteoclastogenesis in Flcn‐deficient cells, we cultured Flcn knockdown and control RAW264.7 cells with the conditioned medium collected from Flcn knockdown and control RAW264.7 cell culture (Fig. 6 I). As shown in Fig. 6 J–M, the conditioned medium from Flcn‐deficient cells enhanced osteoclastogenesis in Flcn‐intact cells. Furthermore, the enhancement of osteoclastogenesis by the conditioned medium from Flcn‐deficient cells was more significant in Flcn knockdown cells, (Fig. 6 J–M), which is consistent with the increased gene expression of purinergic signaling molecules in Flcn‐deficient cells (Fig. 6 A–H). Next, we stimulated Flcn knockdown and control RAW264.7 cells with an adenosine analog CV1808 and quantified the expression of readout genes for osteoclastogenesis. Consistent with the conditioned medium experiment, CV1808 increased the expression of osteoclastogenesis markers in Flcn‐intact cells as well as Flcn‐deficient cells (Fig. 6 N–Q). Importantly, Flcn‐deficient cells showed higher sensitivity to CV1808, which is also consistent with the increased gene expression of purinergic signaling molecules in Flcn‐deficient cells (Fig. 6 A–H).
Figure 5.

Upregulated nucleotide production and oxidative phosphorylation in Flcn‐deficient osteoclast precursors. Comprehensive metabolome analysis was performed on siRNA transfected Raw264.7 cells by CE‐TOF/MS. Cells were transfected with siRNA followed by RANKL stimulation (40 ng/mL) after 24 hours of transfection and harvested after an additional 48 hours of culture. Amount of each metabolite was adjusted by cell number. Open bars indicate data of scramble siRNA transfected cells and closed bars indicate Flcn targeted siRNA transfected cells. Y axis indicates amol/cell. Data represent means ± SD (n = 3, unpaired t test: *p < 0.05, **p < 0.01, ***p < 0.001, ****p < 0.0001). Metabolites, including PRPP, which are produced by pentose phosphate pathway, were elevated in Flcn‐deficient cells. Purine nucleotides and adenosine were dramatically elevated in Flcn‐deficient cells.
Figure 6.

Regulation of nucleotide production and purinergic signaling loop by Flcn. (A) A scheme showing the purinergic signaling loop, which consists of controlled ATP release, extracellular metabolism of purine nucleotides by ectonucleotidases (CD39, CD73), stimulation of purinergic receptors by ATP and adenosine, and import of adenosine by ENT. (B–G) Gene expression was quantified by qRT‐PCR on siRNA transfected RAW264.7 cells cultured under the same condition as the metabolomics analysis in Fig. 5. The molecules involved in this purinergic signaling loop were expressed at significantly higher levels in Flcn knockdown cells. (H) The cellular cAMP level was quantified in siRNA transfected RAW264.7 cells, which were cultured under the same condition as B–G. (I) A scheme showing the conditioned medium experiment. (J–M) Conditioned medium from RAW264.7 cells transfected with scramble siRNA or Flcn targeted siRNA was collected. Then experimental RAW264.7 cells transfected with scramble siRNA or Flcn targeted siRNA were cultured with these conditioned medium for 48 hours, followed by qRT‐PCR analysis to quantify expression levels of osteoclastogenesis marker genes. (N–Q) RAW264.7 cells transfected with scramble siRNA or Flcn siRNA followed by 24‐hour incubation and additional 48‐hour incubation with 40 ng/mL of RANKL and DMSO or 50 μM of CV1808 (an Adora2 agonist). The expression levels of readout genes for osteoclastogenesis were quantified by qRT‐PCR. Data represent means ± SD (triplicate, unpaired t test: *p < 0.05, **p < 0.01, ***p < 0.001, ****p < 0.0001). Representative data from at least three independent experiments are shown.
Flcn regulates osteoclastogenesis through a purinergic signaling loop
To further evaluate the role of this ATP‐mediated purinergic signaling loop in accelerated osteoclastogenesis under Flcn deficiency, we treated RANKL‐stimulated RAW264.7 cells with specific inhibitors for each of these molecules to block this purinergic signaling loop. Inhibition of ATP production by the mitochondrial uncoupler FCCP significantly suppressed Integrin β3 and Oscar expression in Flcn knockdown cells (Fig. 7 A, B). The physiological significance of elevated intracellular ATP levels and increased P2rx7 expression for osteoclastogenesis in Flcn‐deficient cells was evaluated by the P2rx7‐specific inhibitor oATP. Importantly, oATP treatment specifically suppressed expression of readout genes for osteoclast differentiation in Flcn‐deficient cells (Fig. 7 C, D). Panx1 is known to interact with P2rx7 and has a role in controlled ATP release to the extracellular space. Importantly, the Panx1 inhibitor Mefloquine significantly suppressed Integrin β3 and Oscar expression in RANKL‐stimulated Flcn‐deficient cells (Fig. 7 E, F). Exported ATP is eventually converted to adenosine by Cd39 and Cd73 and can stimulate adenosine receptors.41, 42, 43 Addition of adenosine deaminase (ADA) to culture media catalyzes conversion of adenosine to inosine and reduces extracellular adenosine levels. In fact, ADA treatment significantly suppressed Integrin β3 and Oscar expression in RANKL‐stimulated Flcn‐deficient cells (Fig. 7 G, H). Furthermore, we tested the effect of these drugs in an in vitro osteoclast differentiation assay. Flcn knockdown RAW264.7 cells differentiated into osteoclasts more effectively compared with control siRNA transfected cells (Fig. 7 I, J). However, osteoclast differentiation of Flcn‐deficient cells was significantly suppressed by treatment with FCCP, oATP, Mefloquine, and ADA (Fig. 7 K–O). These results strongly support the idea that Flcn modulates osteoclast differentiation through regulation of the purinergic signaling loop in osteoclast precursor cells.
Figure 7.

Flcn regulates osteoclastogenesis through a purinergic signaling loop. (A‐H) RAW264.7 cells transfected with scramble siRNA or Flcn siRNA followed by 24hr incubation and additional 48 hr incubation with RANKL stimulation at 40 ng/ml were treated with specific inhibitors for each molecule to block the purinergic signaling loop. The gene expression of readout genes for osteoclastogenesis, Integrin β3 and Oscar, was quantified by qRT‐PCR to see the effect of purinergic signaling inhibitors on osteoclastogenesis. Cells were treated as follows. (A, B) FCCP to block mitochondrial ATP production; (C, D) oATP to inhibit P2rx7; (E, F) Mefloquine to block controlled ATP release by Panx1, which cooperates with P2rx7; (G, H) adenosine deaminase (ADA) to reduce extracellular adenosine. Data represent means ± SD (triplicate, *p < 0.05, **p < 0.01, ***p < 0.001, ****p < 0.0001). Representative data from at least three independent experiments are shown. (I–N) TRAP staining of RAW264.7 cells transfected with Flcn siRNA or scrambled siRNA followed by RANKL stimulation at 40 ng/mL for 96 hours with inhibitors of purinergic signaling loop. Osteoclastogenesis in Flcn knockdown RAW264.7 cells was significantly enhanced relative to controls (I, J, Fig. 2 C), and was inhibited by 3 μM of FCCP (K), 100 μM of oATP (L), 5 μM of Mefloquine (M), or 0.02 U/mL of ADA (N). Scale bars = 2 mm. (O) The area of multinucleated TRAP‐positive osteoclasts for each treatment is shown. Significant reduction of osteoclast area by the inhibitors for purinergic signaling loop was observed. Data represent means ± SD (triplicate, ***p < 0.001, ****p < 0.0001). Representative data from at least three independent experiments are shown. Scale bars = 2 mm. (P) A proposed model for metabolism‐mediated regulation of osteoclastogenesis by Flcn.
Discussion
In this work, we have demonstrated that Flcn has an essential role in the regulation of osteoclastogenesis. The induction of Flcn knockout in mouse bone marrow caused accelerated osteoclastogenesis, resulting in excess bone absorption and severe osteoporosis within 3 weeks. Omics analysis revealed dramatic metabolic changes in Flcn‐deficient pre‐osteoclasts with the activation of a purinergic signaling loop, which is responsible for accelerated osteoclastogenesis in Flcn‐deficient osteoclast precursors.
We and others have previously reported that Flcn regulates transcriptional activity of Tfe3 by controlling its subcellular localization.20, 21, 28 The elevated expression of Integrin β3 in Flcn‐deficient osteoclast precursors was restored to near normal levels by additional Tfe3 knockdown. Moreover, forced nuclear localization of Tfe3 itself induced Pgc1α and Pgc1β expression in Flcn‐intact cells. Furthermore, we confirmed that Tfe3 directly bound to the M‐box consensus sequences in promoter region of Pgc1α and Pgc1β by ChIP‐qPCR. These data underscore the importance of the Flcn‐Tfe3‐Pgc1 axis in the regulation of osteoclastogenesis through controlling metabolism. Indeed, comprehensive gene expression profiling revealed highly significant enrichment of oxidative phosphorylation genes in Flcn‐deficient osteoclast precursors. Osteoclasts are energy‐demanding cells and contain abundant mitochondria to produce ATP. During osteoclastogenesis, the metabolic state shifts toward a more oxidative state, accompanied by induction of Pgc1β expression and increased mitochondrial biogenesis.1, 2 Here, we have discovered an upstream regulatory signaling pathway for metabolic reprogramming that underscores the importance of the Flcn‐Tfe3‐Pgc1 axis for osteoclastogenesis.
Moreover, we found that genes involved in purine metabolism are significantly upregulated in Flcn‐deficient pre‐osteoclasts. qRT‐PCR showed upregulation of genes involved in nucleic acid metabolism, including Rrm2, Ak2, and Impdh2. Specifically, Impdh2 is the rate‐limiting enzyme for purine metabolism and has an essential role for HSC proliferation under stress conditions as a downstream effector of the p38‐MITF axis.30 Because Tfe3 belongs to the MITF family, it is reasonable that Impdh2 is upregulated in Flcn‐deficient cells through the activation of Tfe3. In fact, we confirmed Impdh2 induction by forced Tfe3 nuclear localization (Fig. 3 P). These data further support the idea that the Flcn‐Tfe3 axis regulates purine metabolism toward osteoclastogenesis. The detailed mechanism of TFE3‐mediated regulation of purine metabolism awaits future investigation.
The unique alterations in gene expression profiling found in Flcn‐deficient cells were significantly reflected in the metabolome profiling. Dramatic elevation of purinergic metabolites including ATP, ADP, and adenosine was observed in Flcn‐deficient RANKL‐stimulated pre‐osteoclasts. This unique metabolome profile can be caused by the simultaneous activation of the pentose phosphate pathway and oxidative phosphorylation. These purinergic metabolites are continuously recycled by phosphorylation and dephosphorylation intracellularly and extracellularly. Controlled ATP release is mediated by the ATP receptor P2RX7 and a hemichannel PANX1.44 The released ATP can stimulate ATP receptors or is dephosphorylated to adenosine by cell surface ectonucleotidases, CD39 and CD73. Then, extracellular adenosine can stimulate adenosine receptors or be imported through transporters, ENTs, and CNTs.36, 41, 42, 43 This purinergic signaling loop can activate intracellular signaling pathways, including the PI3K pathway, MAPK pathway, and Ca2+ signaling. Indeed, the players involved in this purinergic signaling loop, Panx1, P2rx7, Cd39, Cd73, Ent1, and Adora2a, were all upregulated in Flcn‐deficient pre‐osteoclasts (Fig. 6 B–G). The blockage of this purinergic signaling loop by a variety of drugs targeting each molecule could efficiently inhibit accelerated osteoclastogenesis in Flcn‐deficient osteoclast precursors (Fig. 7 A–O). Taken together, loss of Flcn function alters the gene expression signatures of purine metabolism and oxidative phosphorylation through the Flcn‐Tfe3‐Pgc1 axis, leading to an accelerated purinergic signaling loop and enhanced osteoclastogenesis (Fig. 6 P).
In this study, we have shown that Flcn regulates osteoclastogenesis through a purinergic signaling loop. Many purinergic receptors may converge downstream through mutual signaling interactions.34, 41, 43 Identification of the critical purinergic receptors involved in the accelerated osteoclastogenesis under Flcn deficiency should be addressed in the future to characterize this newly identified Flcn role in purinergic regulation.
Although a critical role for purinergic signaling itself in osteoclastogenesis has been suggested,45, 46, 47 the upstream regulation mechanism for purinergic signaling in osteoclastogenesis has not been clarified. In this study, we have demonstrated a role for the Flcn‐Tfe3 axis in the upstream regulation of purinergic signaling in osteoclastogenesis. We have uncovered a novel molecular mechanism to control osteoclastogenesis through the metabolic reprogramming of oxidative phosphorylation and purine metabolism in the mouse system that could form the basis for development of innovative therapeutics for human diseases of abnormal bone metabolism. In addition, our new findings present a new paradigm of purinergic signaling in broader physiological events. Identification and clarification of the upstream signaling that regulates FLCN function and development of drugs to control FLCN function could be the next step toward the translational application of our findings.
Disclosures
All authors state that they have no conflicts of interest.
Supporting information
Supporting Data S1.
Supporting Figure S1.
Acknowledgments
We greatly appreciate critical reading of the manuscript by Laura S Schmidt, PhD. We thank Tatsuya Yoshizawa, PhD, for helpful discussion and valuable suggestions. TS and MB were supported in part by a JSPS KAKENHI Grant‐in‐Aid for Scientific Research (S) (#26221309). MB was supported by JSPS KAKENHI Grant‐in‐Aid for Scientific Research (B) (# 15H04975), Grant‐in‐Aid for Challenging Exploratory Research (#15K14370), and Grant for Basic Science Research Projects (# 161378) from The Sumitomo Foundation. TS was supported by the National Medical Research Council grant of Singapore Translational Research Investigator Award (NMRC/STaR/0019/2014). ME was supported by JSPS KAKENHI Grant‐in‐Aid for Scientific Research (C) (#16K07372). TK was supported by JSPS KAKENHI Grant‐in‐Aid for Scientific Research (B) (#15H04973).
Authors’ roles: Conceptualization: MB and TS. Methodology: MB, ME, and AH. Investigation: MB, ME, WM, HT, AH, KN, KT, TU, MH, HH, NI, CE, MK, HH, TM, and MI. Resources: NN, TS, TM, and MI. Writing—original draft: MB and TS. Writing—review and editing: MB, ME, and TS. Supervision and responsibility for the integrity of the data analysis: MB and TS. Funding acquisition: MB, ME, MY, TK, and TS.
Contributor Information
Masaya Baba, Email: babam@kumamoto-u.ac.jp.
Toshio Suda, Email: csits@nus.edu.sg.
References
- 1. Ishii KA, Fumoto T, Iwai K, et al. Coordination of PGC‐1beta and iron uptake in mitochondrial biogenesis and osteoclast activation. Nat Med. 2009;15(3):259–66. [DOI] [PubMed] [Google Scholar]
- 2. Nishikawa K, Iwamoto Y, Kobayashi Y, et al. DNA methyltransferase 3a regulates osteoclast differentiation by coupling to an S‐adenosylmethionine‐producing metabolic pathway. Nat Med. 2015;21(3):281–7. [DOI] [PubMed] [Google Scholar]
- 3. Lemma S, Sboarina M, Porporato PE, et al. Energy metabolism in osteoclast formation and activity. Int J Biochem Cell Biol. 2016;79:168–80. [DOI] [PubMed] [Google Scholar]
- 4. Nickerson ML, Warren MB, Toro JR, et al. Mutations in a novel gene lead to kidney tumors, lung wall defects, and benign tumors of the hair follicle in patients with the Birt‐Hogg‐Dube syndrome. Cancer Cell. 2002;2(2):157–64. [DOI] [PubMed] [Google Scholar]
- 5. Baba M, Furihata M, Hong SB, et al. Kidney‐targeted Birt‐Hogg‐Dube gene inactivation in a mouse model: Erk1/2 and Akt‐mTOR activation, cell hyperproliferation, and polycystic kidneys. J Natl Cancer Inst. 2008;100(2):140–54. [DOI] [PMC free article] [PubMed] [Google Scholar]
- 6. Hasumi Y, Baba M, Ajima R, et al. Homozygous loss of BHD causes early embryonic lethality and kidney tumor development with activation of mTORC1 and mTORC2. Proc Natl Acad Sci U S A. 2009;106(44):18722–7. [DOI] [PMC free article] [PubMed] [Google Scholar]
- 7. Baba M, Keller JR, Sun HW, et al. The folliculin‐FNIP1 pathway deleted in human Birt‐Hogg‐Dube syndrome is required for murine B‐cell development. Blood. 2012;120(6):1254–61. [DOI] [PMC free article] [PubMed] [Google Scholar]
- 8. Park H, Staehling K, Tsang M, et al. Disruption of Fnip1 reveals a metabolic checkpoint controlling B lymphocyte development. Immunity. 2012;36(5):769–81. [DOI] [PMC free article] [PubMed] [Google Scholar]
- 9. Yan M, Gingras MC, Dunlop EA, et al. The tumor suppressor folliculin regulates AMPK‐dependent metabolic transformation. J Clin Invest. 2014;124(6):2640–50. [DOI] [PMC free article] [PubMed] [Google Scholar]
- 10. Medvetz DA, Khabibullin D, Hariharan V, et al. Folliculin, the product of the Birt‐Hogg‐Dube tumor suppressor gene, interacts with the adherens junction protein p0071 to regulate cell‐cell adhesion. PLoS One. 2012;7(11):e47842. [DOI] [PMC free article] [PubMed] [Google Scholar]
- 11. Chen J, Futami K, Petillo D, et al. Deficiency of FLCN in mouse kidney led to development of polycystic kidneys and renal neoplasia. PLoS One. 2008;3(10):e3581. [DOI] [PMC free article] [PubMed] [Google Scholar]
- 12. Yan M, Audet‐Walsh E, Manteghi S, et al. Chronic AMPK activation via loss of FLCN induces functional beige adipose tissue through PGC‐1alpha/ERRalpha. Genes Dev. 2016;30(9):1034–46. [DOI] [PMC free article] [PubMed] [Google Scholar]
- 13. Hartman TR, Nicolas E, Klein‐Szanto A, et al. The role of the Birt‐Hogg‐Dube protein in mTOR activation and renal tumorigenesis. Oncogene. 2009;28(13):1594–604. [DOI] [PMC free article] [PubMed] [Google Scholar]
- 14. Hudon V, Sabourin S, Dydensborg AB, et al. Renal tumour suppressor function of the Birt‐Hogg‐Dube syndrome gene product folliculin. J Med Genet. 2010;47(3):182–9. [DOI] [PubMed] [Google Scholar]
- 15. Hasumi H, Baba M, Hasumi Y, et al. Regulation of mitochondrial oxidative metabolism by tumor suppressor FLCN. J Natl Cancer Inst. 2012;104(22):1750–64. [DOI] [PMC free article] [PubMed] [Google Scholar]
- 16. Hasumi Y, Baba M, Hasumi H, et al. Folliculin (Flcn) inactivation leads to murine cardiac hypertrophy through mTORC1 deregulation. Hum Mol Genet. 2014;23(21):5706–19. [DOI] [PMC free article] [PubMed] [Google Scholar]
- 17. Kühn R, Schwenk F, Aguet M, Rajewsky K. Inducible gene targeting in mice. Science. 1995;269(5229):1427–9. [DOI] [PubMed] [Google Scholar]
- 18. Bouxsein ML, Boyd SK, Christiansen BA, Guldberg RE, Jepsen KJ, Muller R. Guidelines for assessment of bone microstructure in rodents using micro‐computed tomography. J Bone Miner Res. 2010;25(7):1468–86. [DOI] [PubMed] [Google Scholar]
- 19. Dempster DW, Compston JE, Drezner MK, et al. Standardized nomenclature, symbols, and units for bone histomorphometry: a 2012 update of the report of the ASBMR Histomorphometry Nomenclature Committee. J Bone Miner Res. 2013;28(1):2–17. [DOI] [PMC free article] [PubMed] [Google Scholar]
- 20. Betschinger J, Nichols J, Dietmann S, Corrin PD, Paddison PJ, Smith A. Exit from pluripotency is gated by intracellular redistribution of the bHLH transcription factor Tfe3. Cell. 2013;153(2):335–47. [DOI] [PMC free article] [PubMed] [Google Scholar]
- 21. Hong SB, Oh H, Valera VA, Baba M, Schmidt LS, Linehan WM. Inactivation of the FLCN tumor suppressor gene induces TFE3 transcriptional activity by increasing its nuclear localization. PLoS One. 2010;5(12):e15793. [DOI] [PMC free article] [PubMed] [Google Scholar]
- 22. Soga T, Igarashi K, Ito C, Mizobuchi K, Zimmermann H, Tomita M. Metabolomic profiling of anionic metabolites by capillary electrophoresis mass spectrometry. Anal Chem. 2009;81(15):6165–74. [DOI] [PubMed] [Google Scholar]
- 23. Soga T, Heiger DN. Amino acid analysis by capillary electrophoresis electrospray ionization mass spectrometry. Anal Chem. 2000;72(6):1236–41. [DOI] [PubMed] [Google Scholar]
- 24. Klampfl CW, Buchberger W. Determination of carbohydrates by capillary electrophoresis with electrospray‐mass spectrometric detection. Electrophoresis. 2001;13:2737–42. [DOI] [PubMed] [Google Scholar]
- 25. Hirayama A, Kami K, Sugimoto M, et al. Quantitative metabolome profiling of colon and stomach cancer microenvironment by capillary electrophoresis time‐of‐flight mass spectrometry. Cancer Res. 2009;69(11):49185–4925. [DOI] [PubMed] [Google Scholar]
- 26. Sugimoto M, Wong D, Hirayama A, Soga T, Tomita M. Capillary electrophoresis mass spectrometry‐based saliva metabolomics identified oral, breast and pancreatic cancer‐specific profiles. Metabolomics. 2010;6:78–95. [DOI] [PMC free article] [PubMed] [Google Scholar]
- 27. Takayanagi H, Kim S, Koga T, et al. Induction and activation of the transcription factor NFATc1 (NFAT2) integrate RANKL signaling in terminal differentiation of osteoclasts. Dev Cell. 2002;3(6):889–901. [DOI] [PubMed] [Google Scholar]
- 28. Baba M, Toyama H, Sun L, et al. Loss of Folliculin disrupts hematopoietic stem cell quiescence and homeostasis resulting in bone marrow failure. Stem Cells. 2016;34(4):1068–82. [DOI] [PMC free article] [PubMed] [Google Scholar]
- 29. Salma N, Song JS, Arany Z, Fisher DE. Transcription factor Tfe3 directly regulates Pgc‐1alpha in muscle. J Cell Physiol. 2015;230(10):2330–6. [DOI] [PMC free article] [PubMed] [Google Scholar]
- 30. Karigane D, Kobayashi H, Morikawa T, et al. p38alpha activates purine metabolism to initiate hematopoietic stem/progenitor cell cycling in response to stress. Cell Stem Cell. 2016;19(2):192–204. [DOI] [PubMed] [Google Scholar]
- 31. Subramanian A, Tamayo P, Mootha V, et al. Gene set enrichment analysis: a knowledge‐based approach for interpreting genome‐wide expression profiles. Proc Natl Acad Sci U S A. 2005;102(43):15545–50. [DOI] [PMC free article] [PubMed] [Google Scholar]
- 32. Layland J, Carrick D, Lee M, Oldroyd K, Berry C. Adenosine: physiology, pharmacology, and clinical applications. JACC Cardiovasc Interv. 2014;7(6):581–91. [DOI] [PubMed] [Google Scholar]
- 33. Jacobson KA, Muller CE. Medicinal chemistry of adenosine, P2Y and P2X receptors. Neuropharmacology. 2016;104:31–49. [DOI] [PMC free article] [PubMed] [Google Scholar]
- 34. Cekic C, Linden J. Purinergic regulation of the immune system. Nat Rev Immunol. 2016;16(3):177–92. [DOI] [PubMed] [Google Scholar]
- 35. Kaebisch C, Schipper D, Babczyk P, Tobiasch E. The role of purinergic receptors in stem cell differentiation. Comput Struct Biotechnol J. 2015;13:75–84. [DOI] [PMC free article] [PubMed] [Google Scholar]
- 36. Pellegatti P, Falzoni S, Donvito G, Lemaire I, Di Virgilio F. P2X7 receptor drives osteoclast fusion by increasing the extracellular adenosine concentration. FASEB J. 2011;25(4):1264–74. [DOI] [PubMed] [Google Scholar]
- 37. Agrawal A, Gartland A. P2X7 receptors: role in bone cell formation and function. J Mol Endocrinol. 2015;54(2):R75–88. [DOI] [PubMed] [Google Scholar]
- 38. Lenertz LY, Baughman CJ, Waldschmidt NV, Thaler R, van Wijnen AJ. Control of bone development by P2X and P2Y receptors expressed in mesenchymal and hematopoietic cells. Gene. 2015;570(1):1–7. [DOI] [PMC free article] [PubMed] [Google Scholar]
- 39. Iglesias R, Locovei S, Roque A, et al. P2X7 receptor‐Pannexin1 complex: pharmacology and signaling. Am J Physiol Cell Physiol. 2008;295(3):C752–60. [DOI] [PMC free article] [PubMed] [Google Scholar]
- 40. Poornima V, Madhupriya M, Kootar S, Sujatha G, Kumar A, Bera AK. P2X7 receptor‐pannexin 1 hemichannel association: effect of extracellular calcium on membrane permeabilization. J Mol Neurosci. 2012;46(3):585–94. [DOI] [PubMed] [Google Scholar]
- 41. Mediero A, Cronstein BN. Adenosine and bone metabolism. Trends Endocrinol Metab. 2013;24(6):290–300. [DOI] [PMC free article] [PubMed] [Google Scholar]
- 42. Strazzulla LC, Cronstein BN. Regulation of bone and cartilage by adenosine signaling. Purinergic Signal. 2016;12(4):583–93. [DOI] [PMC free article] [PubMed] [Google Scholar]
- 43. Borea PA, Gessi S, Merighi S, Varani K. Adenosine as a multi‐signalling guardian angel in human diseases: when, where and how does it exert its protective effects? Trends Pharmacol Sci. 2016;37(6);419–34. [DOI] [PubMed] [Google Scholar]
- 44. Brandao‐Burch A, Key ML, Patel JJ, Arnett TR, Orriss IR. The P2X7 receptor is an important regulator of extracellular ATP levels. Front Endocrinol (Lausanne). 2012;3:41. [DOI] [PMC free article] [PubMed] [Google Scholar]
- 45. Korcok J, Raimundo LN, Ke HZ, Sims SM, Dixon SJ. Extracellular nucleotides act through P2X7 receptors to activate NF‐kappaB in osteoclasts. J Bone Miner Res. 2004;19(4):642–51. [DOI] [PubMed] [Google Scholar]
- 46. Gartland A. P2X receptors in bone. Wiley Interdiscip Rev Membrane Transp Signal. 2012;1(2):221–7. [DOI] [PMC free article] [PubMed] [Google Scholar]
- 47. Wang N, Gartland A. Targeting P2 receptors—current progress in treating musculoskeletal diseases. Curr Opin Pharmacol. 2014;16:122–6. [DOI] [PubMed] [Google Scholar]
Associated Data
This section collects any data citations, data availability statements, or supplementary materials included in this article.
Supplementary Materials
Supporting Data S1.
Supporting Figure S1.