

Abstract
Objective
To determine the number and function of follicular helper T (Tfh) cell subsets in IgG4‐related disease (IgG4‐RD).
Methods
Mononuclear cells from the peripheral blood and involved tissue of patients with IgG4‐RD were assessed for Tfh cells and their subsets, and levels of B cell lymphoma 6 (Bcl‐6), B lymphocyte–induced maturation protein 1 (BLIMP‐1), and interleukin‐21 (IL‐21) messenger RNA (mRNA). Immunohistochemical and immunofluorescence techniques were used to assess the involved tissue of patients to determine the location of IL‐21, Bcl‐6, and CD4+CXCR5+ Tfh cells. Furthermore, the ability of circulating Tfh (cTfh) cell subsets to induce B cell proliferation, apoptosis, and differentiation and to produce IgG4 was explored in cell cocultures in vitro.
Results
Frequencies of cTfh cells were significantly increased in the peripheral blood of patients with IgG4‐RD, and even higher frequencies were observed in the involved tissue. Percentages of programmed cell death protein 1 in CD4+CXCR5+ICOS+ cTfh cells were positively correlated with the serum levels of IgG and IgG4, IgG4:IgG ratio, number of involved organs, and frequency of CD19+CD24−CD38high plasmablasts/plasma cells. Levels of BLIMP‐1 and IL‐21 mRNA in peripheral CD4+ T cells were increased in patients with IgG4‐RD compared to healthy controls, and this was correlated with the levels of serum IgG4. Moreover, in the involved tissue, Bcl‐6, IL‐21, and Tfh cells were highly expressed. Compared to cTfh cells from healthy controls, cTfh cells from patients with IgG4‐RD could facilitate B cell proliferation and inhibit B cell apoptosis more efficiently, and enhanced the differentiation of naive B cells into switched memory B cells and plasmablasts/plasma cells, with a resultant increase in the secretion of IgG4. Notably, the cTfh1 and cTfh2 cell subsets were the most effective at providing B cell help.
Conclusion
Tfh cell subsets are expanded in IgG4‐RD and may play pivotal roles in the pathogenesis of the disease.
Follicular helper T (Tfh) cells are a specialized CD4+ T cell subset that mainly reside in the germinal center (GC) and initiate and promote humoral immunity 1. Tfh cells provide critical “helper” functions in the processes of inducing activation and differentiation of B cells and in promoting B cell activation, clonal expansion, Ig heavy chain isotype switching, and somatic hypermutation 1. A specific phenotypic profile, which includes high expression levels of CXCR5, inducible T cell costimulator (ICOS), and programmed cell death protein 1 (PD‐1) and a concomitant down‐regulated expression of CCR7 and CD127 (interleukin‐7 receptor [IL‐7R]), can be used to identify Tfh cells and to distinguish Tfh cells from other T cell subsets 2.
Normally, the expression of CXCR5 on Tfh cells and the concomitant loss of CCR7 allows Tfh cells to migrate into CXCL13‐rich follicular areas of secondary lymphoid organs. Interaction of Tfh cells with B cells at the T cell–B cell border results in activation of B cells and differentiation into short‐lived plasmablasts or long‐lived plasma cells and memory B cells in the GC 1. ICOS, a member of the CD28 family of costimulatory molecules, is important for the maintenance and function of Tfh cells through cognate interactions with ICOSL on the B cell surface 3. PD‐1, which is also expressed by Tfh cells, regulates GC B cell survival and selection, and also induces GC B cell differentiation into high‐affinity long‐lived plasma cells by interacting with PD‐L1 and/or PD‐L2–expressing B cells 4. Tfh cells themselves contribute to B cell activation and differentiation through the secretion of cytokines, such as IL‐4, IL‐10, and IL‐21. Among these, IL‐21 serves as the pivotal regulatory cytokine, since it directly regulates Tfh cell formation and differentiation and induces GC B cell proliferation and differentiation into plasma cells 5.
Similar to other T helper cell lineages, multiple specific gene transcriptional regulatory factors are involved in the differentiation of Tfh cells. B cell lymphoma 6 (Bcl‐6), a nuclear phosphoprotein belonging to the BTB/POZ zinc‐finger family, is considered to be the most critical transcription factor in the functioning of Tfh cells, and is necessary for the differentiation of Tfh cells and for promoting the capacity of these cells to provide help for B cell differentiation. In contrast, B lymphocyte–induced maturation protein 1 (BLIMP‐1), which is encoded by the PRDM1 gene, is an antagonist of Bcl‐6 expression, and inhibits the differentiation of Tfh cells and disturbs their capacity to provide B cell help 6.
The presence of Tfh cells is not limited to secondary lymphoid organs, as human blood contains CD4+CXCR5+ T cell populations that share some functional properties with Tfh cells, termed circulating (or blood) Tfh (cTfh) cells 7, 8. These cTfh cells can be divided into subsets based on the expression of CCR6 and CXCR3, with 3 cTfh populations identified, each having different functional capabilities. CXCR3+CCR6− cells resemble Th1 cells (termed cTfh1 cells), while CXCR3−CCR6− cells resemble Th2 cells (termed cTfh2 cells), and CXCR3−CCR6+ cells resemble Th17 cells (termed cTfh17 cells). Of these cTfh subsets, only cTfh2 and cTfh17 could induce naive B cells to proliferate and differentiate into plasmablasts/plasma cells via the secretion of IL‐21 7.
Abnormal expression and/or dysfunction of Tfh cells can be involved in the development of autoimmune disease, with the resultant production of increased concentrations of autoantibodies 9, 10, 11. IgG4‐related disease (IgG4‐RD) is a newly recognized immune‐mediated fibroinflammatory disease that is characterized by enlargement of tissues or organs, abundant IgG4+ plasma cell infiltration in damaged organs, and elevated serum IgG4 levels 12, 13. Because of its relative novelty, the exact mechanism involved in the pathogenesis of IgG4‐RD remains unclear. Results of previous studies have suggested that aberrant formation of GCs and perturbation of B cell subsets contribute to the development of IgG4‐RD 14, 15, 16. Notably, we found a population of CD19+CD24−CD38high plasmablasts/plasma cells whose levels were abnormally increased in patients with IgG4‐RD, showing a positive correlation with the serum levels of IgG4, number of organs with disease involvement, and levels of disease activity. After treatment with glucocorticoids and immunosuppressants, these levels of plasmablasts/plasma cells were significantly reduced 15, 16.
The unresolved question is whether the increase in circulating IgG4‐secreting plasmablasts/plasma cells represents a primary B cell abnormality or reflects increased function of Tfh cell subsets. To explore whether abnormal expansion of Tfh cell subsets could contribute to the characteristic increase in plasmablast/plasma cell differentiation in IgG4‐RD, we carried out a detailed analysis of the pool size and function of these cells in the blood and involved tissue of patients with this disease.
Patients and methods
Patients and controls. Newly diagnosed and untreated patients with IgG4‐RD (n = 46) who fulfilled the 2011 comprehensive IgG4‐RD diagnostic criteria 17 were enrolled in this study. Patients with recurrent infections, cancer, lymphoma, or other autoimmune diseases were excluded. Details on the patients’ demographic, clinical, and laboratory characteristics at the time of analysis are shown in Supplementary Table 1 (available on the Arthritis & Rheumatology web site at http://onlinelibrary.wiley.com/doi/10.1002/art.40556/abstract). Age‐ and sex‐matched healthy volunteers (n = 33) were studied in parallel as healthy controls, and 7 patients with IgG4‐RD who had been receiving stable treatment for the disease were also used as a control group. In addition to the blood samples from patients with IgG4‐RD, 4 fresh submandibular gland tissue samples and 5 paraffin‐embedded tissue samples (2 from the submandibular gland, 1 from the lacrimal gland, 1 from the sinus tissue, and 1 from the parotid gland) were obtained from patients with IgG4‐RD. As controls, 4 fresh submandibular gland tissue samples from patients without IgG4‐RD (non–IgG4‐RD controls; most having pathology‐confirmed chronic submandibular sialadenitis) and 5 paraffin‐embedded labial gland tissue samples from patients with Sjögren's syndrome (SS) were examined.
The study was approved by the Medical Ethics Committee of Peking Union Medical College Hospital (Peking, China). Informed consent was obtained from all patients and controls.
Flow cytometry. Using standard Ficoll‐Hypaque procedures, mononuclear cells were isolated from fresh peripheral blood mononuclear cells (PBMCs) or from tissue cell suspensions purified from fresh submandibular gland tissue. Samples were preincubated with Fc block (BioLegend) and stained with the following monoclonal antibodies (mAb): PerCP‐Cy5.5–conjugated anti‐CXCR5, phycoerythrin (PE)–Cy7–conjugated anti‐CD19, fluorescein isothiocyanate (FITC)–conjugated anti‐CD24, allophycocyanin (APC)–conjugated anti‐CD38, PE–Cy7–conjugated anti‐CD19, PE‐conjugated anti‐IgD (all from BD PharMingen), PE–Cy7–conjugated anti‐ICOS, APC‐conjugated anti‐CXCR3, PE‐conjugated anti‐CCR6 (all from BioLegend), and FITC‐conjugated anti‐CD4 (eBioscience) or isotype‐matched controls (BD PharMingen). The stained cells were analyzed with a BD Bioscience LSRII flow cytometer immediately after sample preparation. Data were analyzed using FlowJo software (version 7.6.4; Tree Star).
Cell isolation. PBMCs were stained with antibodies against CD4, CXCR5, CCR6, and CXCR3, and then a MoFlo high‐performance cell sorter (Cytomation) was used to sort the cells into cTfh cells (CD4+CXCR5+) and into subsets of cTfh cells, including cTfh1 cells (CXCR3+CCR6−), cTh2 cells (CXCR3−CCR6−), and cTfh17 cells (CXCR3−CCR6+). CD4+ T cells were enriched by positive selection and B cells by negative selection with magnetic beads using Miltenyi MACS kits, according to the manufacturer's instructions. Among the sorted cells, >94% purity was achieved.
Quantitative real‐time polymerase chain reaction (qPCR). Total RNA was extracted from peripheral CD4+ T cells using TRIzol solution (Invitrogen), according to the manufacturer's instructions. Reverse transcription (RT) was carried out using a PrimeScript RT reagent kit. With a total volume of 20 μl, containing 10 μl SYBR Premix Ex Taq 2× TMII (Takara), 1.6 μl forward and reverse primers, and 2 μl complementary DNA templates, qPCR reactions were performed on an ABI Prism 7900HT Fast Real‐Time PCR system (Applied Biosystems) using the following amplification conditions: predenaturation at 95°C for 30 seconds, followed by 40 cycles of amplification, denaturation at 95°C for 5 seconds, and annealing at 60°C for 30 seconds. Melting curves were used for controlling the specificity of the amplification products.
Expression values for each gene were normalized to those for β‐actin. The gene‐specific primers for qPCR were designed according to GenBank sequences and synthesized at Shanghai Sangon Biological Engineering Technology and Service Company. The sequences of the primers used are as follows: for IL‐21, forward 5′‐GGAGAAGACAGAAACACAGAC‐3′ and reverse 5′‐GTCCAACTGCAAGTTAGATCC‐3′; for Bcl‐6, forward 5′‐AACCTGAAAACCCACACTCG‐3′ and reverse 5′‐TTCGCATTTGTAGGGCTTCT‐3′; for BLIMP‐1, forward 5′‐GTGTCAGAACGGGATGAACA‐3′ and reverse 5′‐GCTCGGTTGCTTTAGACTGC‐3′; and for β‐actin, forward 5′‐CCTGGGCATGGAGTCCTGTGG‐3′ and reverse 5′‐CTGTGTTGGCGTACAGGTCTT‐3′. Relative differences between the groups were analyzed using the 2–ΔΔCt method, with results assessed relative to the values in healthy controls.
Immunohistochemical analysis and immunofluorescence staining. Formalin‐fixed, paraffin‐embedded samples of disease‐involved tissue from patients with IgG4‐RD were cut into consecutive 3‐μm–thick sections. Slides were stained with rabbit anti‐human IL‐21, followed by rabbit anti‐human Bcl‐6 and rabbit anti‐human IgG4 (Abcam), and then sequentially incubated with biotinylated goat anti‐rabbit IgG secondary antibodies and streptavidin‐conjugated horseradish peroxidase, in accordance with conventional immunohistochemical methods. As a negative control, we used phosphate buffered saline instead of the primary antibody to assess submandibular gland tissue from IgG4‐RD patients, while positive controls for Bcl‐6 were performed using tonsil tissue (details shown in Supplementary Figure 1A, available on the Arthritis & Rheumatology web site at http://onlinelibrary.wiley.com/doi/10.1002/art.40556/abstract).
For immunofluorescence staining, the slides were also incubated with primary mouse anti‐human CD4 (Abcam) in combination with rabbit anti‐human CXCR5, and then incubated with mixed Alexa Fluor 488–conjugated donkey anti‐mouse IgG antibody and Alexa Fluor 594–conjugated donkey anti‐rabbit IgG antibody. DAPI was used as the nuclear counterstain. Immunofluorescence images were acquired, processed to reduce background, and merged using ZEN Lite microscope software (Zeiss Microscopy).
Cell coculture. B cells (2 × 10⁴ cells/well) were cocultured with sorted Tfh cells (2 × 10⁴ cells/well) and cTfh cell subsets (1 × 10⁴ cells/well) in the presence of 1 μg/ml purified plate‐bound anti‐CD3 mAb, 2 μg/ml purified anti‐CD28 mAb, 100 ng/ml recombinant human CD40L (Abcam), and 0.1 μg/ml CpG‐containing oligonucleotide 2006 (Invivogen) in complete RPMI 1640 medium supplemented with 10% heat‐inactivated fetal bovine serum, respectively.
Assessment of the proliferation, apoptosis, and differentiation of cocultured B cells. The apoptosis and proliferation of cocultured B cells were tested by flow cytometry on day 3 of the cocultures, using a BD Biosciences Apoptosis, DNA Damage, and Cell Proliferation kit according to the procedure recommended by the manufacturer. The remaining cells were collected on day 7 and assessed by flow cytometry to determine the differentiation of sorted B cells into plasmablasts/plasma cells.
Enzyme‐linked immunoassay (ELISA). Supernatants of cocultured cells were collected on day 7 and stored at −80°C until used. The concentrations of IgG4 were measured by ELISA (eBioscience), according to the procedure recommended by the manufacturer.
Statistical analysis. All statistical analyses were performed using SPSS software (version 20.0; SPSS Inc.). Data are presented as the mean ± SD and analyzed using the Student's t‐test (for normally distributed data) or Mann‐Whitney U test (for non–normally distributed data). Comparison of mean values between the groups was done using one‐way analysis of variance. Correlations between variables were determined using Pearson's rank correlation test (for normally distributed data) or Spearman's rank correlation test (for non–normally distributed data). P values less than 0.05 were considered significant.
Results
Expansion of cTfh cells in patients with IgG4‐RD. Blood samples from 46 untreated patients with IgG4‐RD and 33 healthy controls were collected. As shown in Figures 1A and B, the percentage of total CD4+ T cells in the peripheral blood of patients with IgG4‐RD was not significantly different from that in healthy controls, whereas the percentage of CD4+CXCR5+ cTfh‐like cells in total lymphocytes was significantly increased in patients with IgG4‐RD compared to healthy controls (mean ± SD 5.92 ± 0.47% versus 3.85 ± 0.29%; P < 0.005). In addition, the frequencies of the following subsets were also significantly increased in CD4+ T cells from patients with IgG4‐RD compared to healthy controls: CD4+CXCR5+ICOS+ in CD4+ T cells, 19.21 ± 1.13% versus 12.95 ± 0.73% (P < 0.0001); CD4+CXCR5+PD‐1+ in CD4+ T cells, 4.02 ±0.52% versus 1.12 ± 0.10%(P < 0.0001); PD‐1 in CD4+CXCR5+ICOS+ T cells, 16.56 ± 1.59% versus 8.33 ± 0.61% (P < 0.0001); and CD4+CXCR5+ICOS+PD‐1+ in CD4+ T cells, 2.45 ± 0.32% versus 0.69 ± 0.06% (P < 0.0001) (Figures 1A and B).
Figure 1.
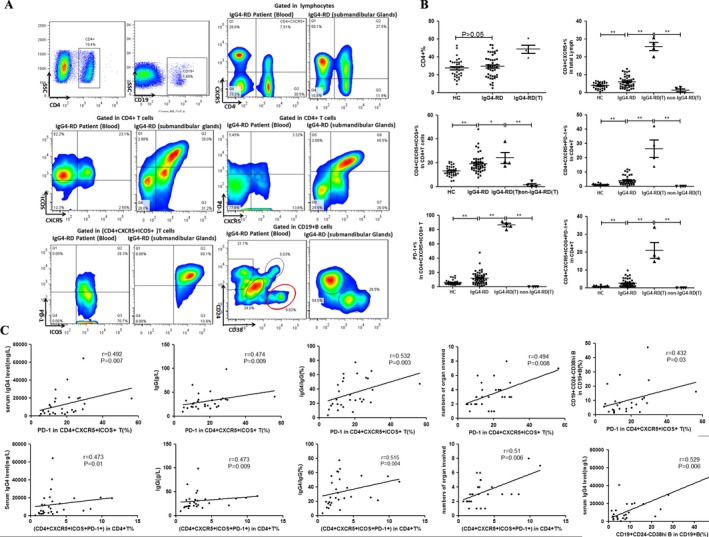
Expression of follicular helper T (Tfh) cells and plasmablasts in patients with IgG4‐related disease (IgG4‐RD) compared to healthy controls (HC). A and B, Flow cytometric detection (A) and quantification (B) of total CD4+ T cells, CD4+CXR5+ T cells, CD4+CXCR5+ICOS+ T cells, CD4+CXCR5+PD‐1+ T cells, programmed cell death protein 1 (PD‐1) in CD4+CXCR5+ICOS+ T cells, and CD19+CD24−CD38high plasmablasts in peripheral blood and submandibular gland tissue (T) from patients with IgG4‐RD and healthy controls. Symbols represent individual subjects; horizontal lines with bars show the mean ± SD. * = P < 0.05; ** = P < 0.001. C, Correlations between the percentages of PD‐1 in CD4+CXCR5+ICOS+ T cells and CD4+CXCR5+ICOS+PD‐1+ T cells and serum levels of IgG4, serum levels of IgG, IgG4:IgG ratio, numbers of involved organs, and percentage of CD19+CD24−CD38high plasmablasts. ICOS = inducible T cell costimulator.
We further examined the presence of these cTfh cells in suspensions of mononuclear cells from fresh submandibular gland tissue obtained from 4 patients with IgG4‐RD and 4 non–IgG4‐RD control patients. Notably, the percentages of cTfh cells were significantly higher in the submandibular gland tissue than in the peripheral blood of patients with IgG4‐RD, and were also dramatically increased in the submandibular glands from patients with IgG4‐RD compared to the same tissue from non–IgG4‐RD control subjects with an inflammatory condition (Figure 1B). Interestingly, PD‐1 was expressed by the majority of CD4+CXCR5+ICOS+ Tfh cells in the involved gland tissue from IgG4‐RD patients (Figures 1A and B). However, the number of lymphocytes was rather small in the submandibular gland tissue from non–IgG4‐RD control patients, and CXCR5 was barely expressed.
Correlation of the frequencies of cTfh cells with clinical parameters. Although there were no significant correlations between the frequencies of CD4+CXCR5+, CD4+CXCR5+ICOS+, and CD4+CXCR5+PD‐1+ cTfh cells and the serum levels of IgG, serum levels of IgG4, IgG4:IgG ratio, numbers of involved organs, or percentages of CD19+CD24−CD38high plasmablasts/plasma cells (data not shown), the percentage of CD4+CXCR5+ICOS+PD‐1+ cTfh cells and the percentage of PD‐1 expression in CD4+CXCR5+ICOS+ T cells did show significant positive correlations with the serum levels of IgG, serum levels of IgG4, serum IgG4:IgG ratio, and numbers of involved organs (Figure 1C). Notably, the percentage of PD‐1 in CD4+CXCR5+ICOS+ T cells was also positively associated with the percentage of CD19+CD24−CD38high plasmablasts/plasma cells (Figure 1C).
Expression of Bcl‐6, BLIMP‐1, and IL‐21 mRNA in patients with IgG4‐RD. After the cells were sorted using positive selection with magnetic beads, we found that CD4+ T cells were enriched both in patients with IgG4‐RD and in healthy controls. To understand the status of Tfh cells in greater detail, the levels of Bcl‐6 and BLIMP‐1 (PRDM1) mRNA in CD4+ T cells were tested by real‐time qPCR. Our results showed that levels of BLIMP‐1 (PRDM1) mRNA, but not Bcl‐6 mRNA, were up‐regulated in untreated patients with IgG4‐RD compared to healthy controls (for PRDM1 mRNA [F = 2–ΔΔCt], mean ± SD 3.28 ± 0.77 versus 1.33 ± 0.21 [P < 0.0001]; for Bcl6 mRNA [F = 2–ΔΔCt], 1.36 ± 0.21 versus 1.14 ± 0.29 [P > 0.05]) (Figure 2A).
Figure 2.
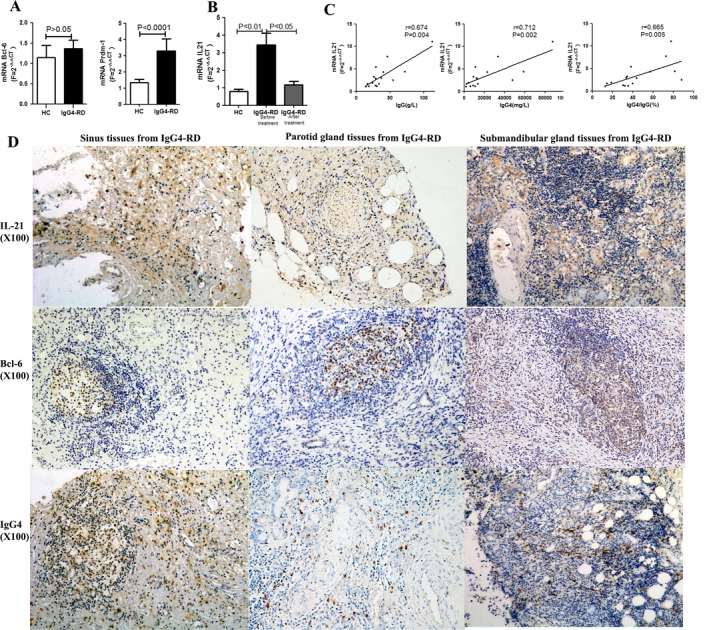
Transcriptional levels of B cell lymphoma 6 (Bcl‐6), B lymphocyte–induced maturation protein 1 (BLIMP‐1; PRDM1), and interleukin‐21 (IL‐21) in peripheral CD4+ T cells from patients with IgG4‐RD compared to healthy controls, and results of immunohistochemical staining of the involved tissue from patients. A and B, Levels of Bcl‐6 and BLIMP‐1 (PRDM1) mRNA in peripheral CD4+ T cells from patients with IgG4‐RD (A) and IL‐21 mRNA in peripheral CD4+ T cells from IgG4‐RD patients before and after treatment (B), compared to healthy controls. Results are the mean ± SD, calculated using the 2–ΔΔCt method. C, Correlations between levels of IL‐21 mRNA and IgG4‐RD clinical indices. D, Specific staining of IL‐21, Bcl‐6, and IgG4 in the involved tissue from patients with IgG4‐RD. Original magnification × 100. See Figure 1 for other definitions.
Because of the critical role of IL‐21 in the functions of Tfh cells, we also confirmed that the levels of IL‐21 mRNA were much higher in CD4+ T cells from untreated patients with IgG4‐RD compared to healthy controls, and after treatment, the levels of IL‐21 mRNA were significantly decreased (for IL‐21 mRNA [F = 2–ΔΔCt], mean ± SD 0.80 ± 0.11 in healthy controls versus 3.43 ± 0.69 before treatment and 1.16 ± 0.20 after treatment in patients with IgG4‐RD; P < 0.01) (Figure 2B). Moreover, the relative transcription levels of IL‐21 mRNA in CD4+ T cells from untreated patients with IgG4‐RD showed a strong positive correlation with the serum levels of IgG4, serum levels of IgG, and IgG4:IgG ratio (Figure 2C).
Immunohistochemical and immunofluorescence staining of IgG4‐RD–involved tissue. As shown in Figure 2D, in experiments using immunohistochemical techniques, we observed specific staining of IL‐21, Bcl‐6, and IgG4 in the affected tissue of patients with IgG4‐RD. IL‐21 was found to be diffusely located or surrounding glandular structures, while Bcl‐6 was found to be located mainly in ectopic GCs in all of the tissue samples analyzed, including the sinus tissue, parotid gland tissue, and lacrimal gland tissue from patients with IgG4‐RD.
In triple‐fluorescence immunostaining, the cell surface markers CD4 and CXCR5 were used to characterize the localization of Tfh cells in the involved tissue of patients with IgG4‐RD (green and red immunostaining, respectively, in Figure 3). DAPI was used to mark the cell nucleus (blue immunostaining in Figure 3). Labial glands from patients with SS were used as controls. As can be seen in Figure 3, CD4+CXCR5+ T cells were much more frequent in the affected gland tissue of patients with IgG4‐RD than in the labial gland tissue of patients with SS. In tissue samples from patients with IgG4‐RD, Tfh cells were mostly distributed around glandular cells or within ectopic GCs. In the affected sinus tissue, CD4+CXCR5+ T cells were found as a diffuse infiltration. Comparison of the quantitative data on the distribution of CD4+CXCR5+ Tfh cells showed significant differences between patients with IgG4‐RD and patients with SS (P < 0.05) (results in Supplementary Figure 1B, available on the Arthritis & Rheumatology web site at http://onlinelibrary.wiley.com/doi/10.1002/art.40556/abstract).
Figure 3.
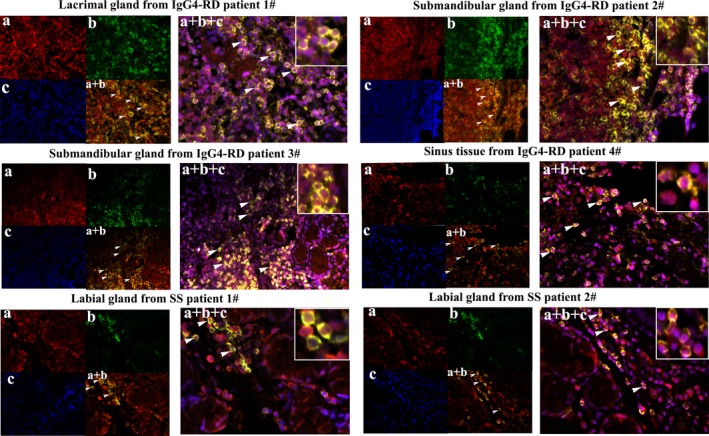
Immunofluorescence staining of Tfh cells in the involved tissue (lacrimal glands, submandibular glands, and sinus tissue) from patients with IgG4‐RD compared to labial glands of control patients with Sjögren's syndrome (SS) (stained with the same concentration of primary antibodies). a, CXCR5 (in red). b, CD4 (in green). c, DAPI counterstaining for cell nucleus (in blue). a + b, Merged image of CD4 and CXCR5 immunostaining. a + b + c, Merged image of CD4, CXCR5, and DAPI immunostaining. White arrowheads indicate positive cells. Insets show higher magnification views of the merged images. Original magnification × 400. See Figure 1 for other definitions.
Promotion of B cell proliferation and differentiation and inhibition of apoptosis by cTfh cells in patients with IgG4‐RD. To assess the ability of cTfh cells to promote B cell proliferation and differentiation in patients with IgG4‐RD, magnetic bead–purified B cells from healthy controls were stimulated in vitro alone or with a 1:1 mixture of sorted CD4+CXCR5+ T cells from patients with IgG4‐RD or age‐ and sex‐matched healthy controls. The cTfh cells from patients with IgG4‐RD induced B cell proliferation and inhibited B cell apoptosis more effectively than did the cTfh cells from healthy controls (Figures 4A and D). Importantly, cTfh cells from patients with IgG4‐RD promoted B cell differentiation into CD19+CD24−CD38high plasmablasts/plasma cells more efficiently than did healthy control cTfh cells, and high production of IgG4 antibodies was observed in the cultures of cTfh cells from patients with IgG4‐RD (Figures 4B and D).
Figure 4.
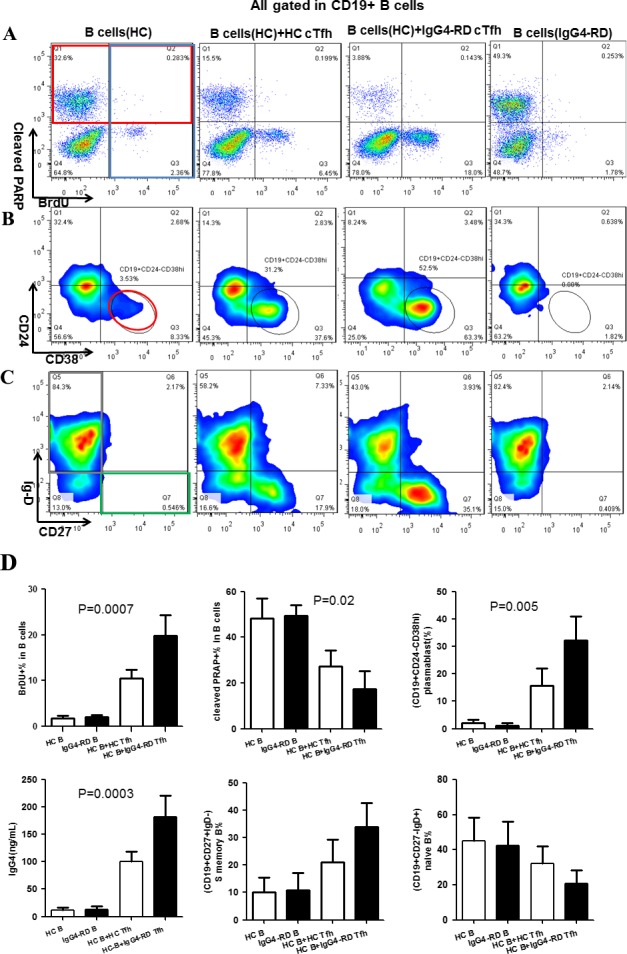
Impact of circulating Tfh (cTfh) cells on B cell proliferation, apoptosis, and differentiation. Magnetic bead–purified B cells from healthy controls were cultured alone or cocultured with CD4+CXCR5+ T cells in vitro. The 4 groups were healthy control B cells alone, healthy control B cells cocultured with healthy control cTfh cells, healthy control B cells cocultured with cTfh cells from patients with IgG4‐RD, and B cells from patients with IgG4‐RD alone. Representative data from 4 independent experiments are shown. A, Detection of bromodeoxyuridine (BrdU) (blue box) and cleaved poly(ADP‐ribose) polymerase (PARP) (red box) by flow cytometry in B cells on day 3 after stimulation. B, Detection of CD19+CD24−CD38high plasmablasts (red circle) by flow cytometry on day 7 after stimulation. C, Detection of naive B cells (CD19+CD27−IgD+) (gray box) and switched (S) memory B cells (CD19+CD27+IgD−) (green box) by flow cytometry on day 7 after stimulation. D, Percentages of BrdU+ B cells, cleaved PARP+ B cells, plasmablasts/plasma cells, switched memory B cells, and naive B cells and concentrations of IgG4 in the cultured cell suspensions from the different groups. Results are the mean ± SD. See Figure 1 for other definitions.
In addition, cTfh cells from patients with IgG4‐RD appeared to be more effective than healthy control cTfh cells in supporting the differentiation of naive B cells (CD19+CD27−IgD+) into switched memory B cells (CD19+CD27+IgD−) (Figures 4C and D). Although not significantly different, the overall trends were apparent and consistent across 4 independent experiments. B cells alone from either patients with IgG4‐RD or healthy controls predominantly underwent apoptosis, with minimal proliferation or differentiation.
High expression of cTfh1 and cTfh2 cells in patients with IgG4‐RD. Based on the expression of the chemokine receptors CXCR3 and CCR6 in CD4+CXCR5+ T cells, we analyzed the proportion of different cTfh cell subsets in the peripheral blood from patients with IgG4‐RD (n = 38) and healthy controls (n = 26) (Figure 5A). As shown in Figures 5B–E, when compared to healthy controls, the percentages of cTfh1 cells (CXCR3+CCR6−) and cTfh2 cells (CXCR3−CCR6−) in CD4+ T cells were significantly increased in patients with IgG4‐RD, whereas the percentages of the other 2 subpopulations, including cTfh17 cells (CXCR3−CCR6+) and CXCR3+CCR6+ T cells, did not show significant differences between patients with IgG4‐RD and healthy controls (for cTfh1, mean ± SD 6.27 ± 0.45% versus 3.83 ± 0.21% [P < 0.0001]; for cTfh2, 5.73 ± 0.45% versus 4.22 ± 0.24% [P = 0.01]; for cTfh17, 6.27 ± 0.45% versus 3.83 ± 0.21% [P < 0.0001]; for circulating CXCR3+CCR6+ T cells, 5.80 ± 0.45% versus 6.24 ± 0.51% [P = 0.52]). Likewise, the ratio of Tfh1 cells to Tfh2 cells in the involved submandibular glands of patients with IgG4‐RD was also remarkably increased. Because of the poor expression of CXCR5 in submandibular glands from non–IgG4‐RD control patients, it was difficult to divide them into subsets of Tfh1, Tfh2, and Tfh17, and we therefore did not compare Tfh cell subsets between submandibular gland tissue samples from patients with IgG4‐RD and submandibular gland tissue samples from non–IgG4‐RD control patients.
Figure 5.
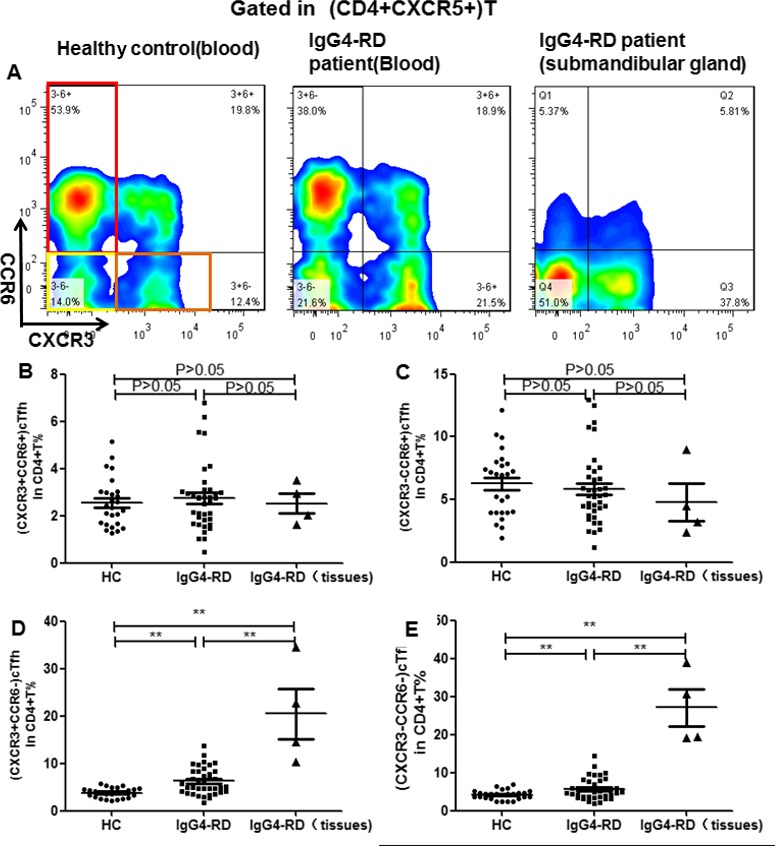
Expression of circulating Tfh (cTfh) cell subsets in patients with IgG4‐RD compared to healthy controls. A, Expression of cTfh1 (CXCR3+CCR6−), cTfh2 (CXCR3−CCR6−), and cTfh17 (CXCR3−CCR6+) cells was assessed in peripheral CD4+ T cells from patients with IgG4‐RD and healthy controls and in submandibular gland tissue from patients with IgG4‐RD. B–E, Percentages of circulating CXCR3+CCR6+ T cells (B) as well as cTfh17 (C), cTfh1 (D), and cTfh2 cells (E) were determined in peripheral CD4+ T cells from patients with IgG4‐RD (n = 38) compared to healthy controls (n = 26), and in submandibular gland tissue from patients with IgG4‐RD (n = 4). Symbols represent individual subjects; horizontal lines with bars show the mean ± SD. ** = P < 0.001. See Figure 1 for other definitions.
Aberrant function of cTfh1 and cTfh2 cells in patients with IgG4‐RD. Considering the abnormal function of cTfh cells in patients with IgG4‐RD, we next investigated which subpopulations might play a major role in helping B cells. The flow cytometry–sorted total cTfh1, cTfh2, and cTfh17 cells from patients with IgG4‐RD and age‐ and sex‐matched healthy controls were cultured with magnetic bead–purified B cells obtained from healthy control subjects. As shown in Figure 6, all of these cTfh cell subsets from patients with IgG4‐RD promoted B cell proliferation and inhibited B cell apoptosis more effectively than did those from healthy controls, a finding that was most notable with cTfh1 and cTfh17 cells. In contrast, cTfh1 cells, and especially cTfh2 cells, from patients with IgG4‐RD enhanced B cell differentiation into CD19+CD24−CD38high plasmablasts/plasma cells more efficiently than did those from healthy controls. However, there were no differences in the abilities of these cTfh cell subsets to promote naive B cell differentiation into memory B cells either in patients with IgG4‐RD or in healthy controls (data not shown).
Figure 6.
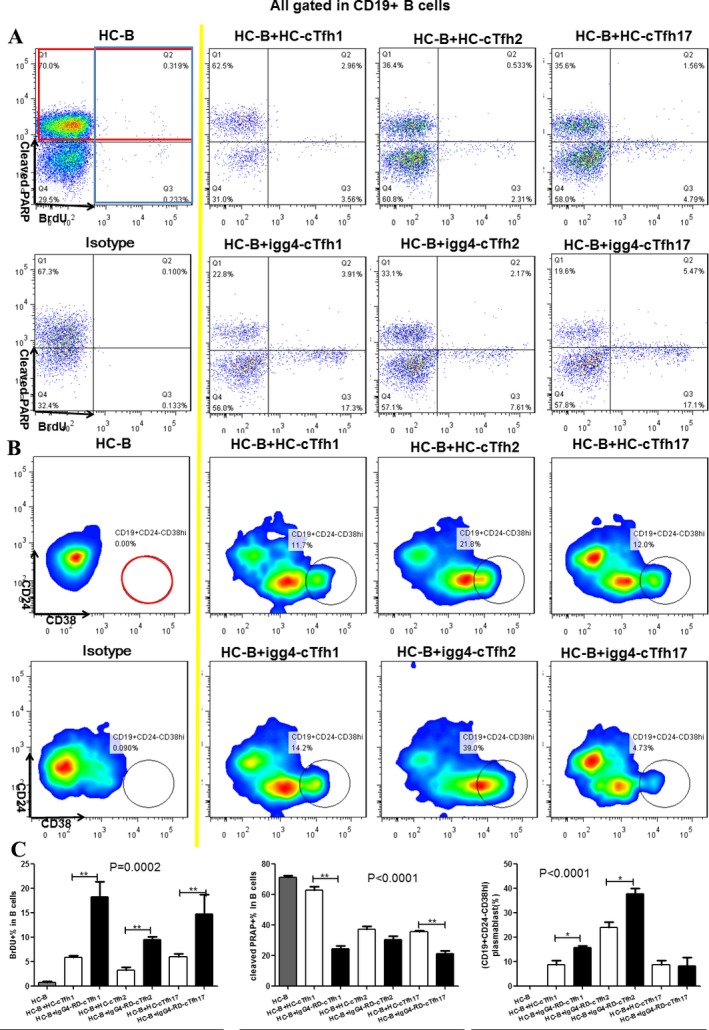
Impact of circulating Tfh (cTfh) cell subsets on B cell proliferation, apoptosis, and differentiation. Magnetic bead–purified B cells from healthy controls were cultured alone or cocultured with cTfh cell subsets (cTfh1, cTfh2, and cTfh17) from healthy controls or patients with IgG4‐RD in vitro. Representative data from 3 independent experiments are shown. A, Detection of bromodeoxyuridine (BrdU) (blue box) and cleaved poly(ADP‐ribose) polymerase (PARP) (red box) by flow cytometry in B cells on day 3 after stimulation. B, Detection of CD19+CD24−CD38high plasmablasts (red circle) by flow cytometry on day 7 after stimulation. C, Comparison of the percentage of BrdU+ B cells, cleaved PARP+ B cells, and plasmablasts between the different groups. Results are the mean ± SD. * = P < 0.05; ** = P < 0.01. See Figure 1 for other definitions.
Discussion
In this study, we found that cTfh cells were significantly expanded in the peripheral blood of patients with IgG4‐RD, and Tfh cells were even more expanded in the involved tissue. The percentages of PD‐1 in CD4+CXCR5+ICOS+ cTfh cells positively correlated with the serum levels of IgG and IgG4, the IgG4:IgG ratio, the number of involved organs, and the frequency of CD19+CD24−CD38high plasmablasts/plasma cells. The level of BLIMP‐1 (PRDM1), but not Bcl‐6, mRNA was higher in peripheral CD4+T cells from patients with IgG4‐RD than in those from healthy controls. Levels of IL‐21 mRNA were much higher in peripheral CD4+ T cells from untreated patients with IgG4‐RD, and this positively correlated with the serum levels of IgG4, serum levels of IgG, and IgG4:IgG ratio. Furthermore, after treatment, the levels of IL‐21 mRNA were significantly decreased. In addition, CD4+CXCR5+ Tfh cells, as well as Bcl‐6 and IL‐21, were highly expressed in the involved tissue of patients with IgG4‐RD, mainly distributed around glandular cells or within ectopic GCs. Importantly, compared to healthy controls, cTfh cells in patients with IgG4‐RD more efficiently facilitated B cell proliferation as well as the differentiation of naive B cells into switched memory B cells and plasmablasts/plasma cells, resulting in increased secretion of IgG4.
Finally, the frequencies of cTfh1 and cTfh2 cells, but not cTfh17 cells, were significantly higher in patients with IgG4‐RD. Moreover, cTfh1 and cTfh17 cells enhanced B cell proliferation, whereas cTfh1 cells, and especially cTfh2 cells, promoted B cell differentiation, and also induced the secretion of IgG4.
Aberrantly expanded cTfh cells have been considered to be an important inducing factor in the development of autoimmune diseases 18. Akiyama et al reported that CD4+CXCR5+CD45RA− memory cTfh cells were overexpressed in patients with IgG4‐RD (n = 15) 19. However, they did not analyze the expression of PD‐1 and ICOS in cTfh cells. In our study, we measured not only the levels of PD‐1 and ICOS in cTfh cells, but also the expansion of Tfh cells in involved organ tissue. Our results demonstrated that, in addition to expansion of CD4+CXCR5+ cTfh cells in the circulating blood of patients with IgG4‐RD, there is also marked enrichment and functional maturation of Tfh cells in the involved tissue in these patients.
Notably, the frequency of Tfh cells was significantly higher in the affected tissue than in the circulating blood. CD4+CXCR5+ Tfh‐like cells mostly localized around the glandular cells or within ectopic GCs, whereas some of them presented as a diffuse infiltration. In contrast, in the involved tissue of non–IgG4‐RD control patients, there were few CD4+ or CXCR5+ T cells, further supporting the important role of Tfh cells in the pathogenesis of IgG4‐RD.
Moreover, the frequencies of CD4+CXCR5+ICOS+ cells, CD4+CXCR5+PD‐1+ T cells, and CD4+CXCR5+ICOS+PD‐1+ cTfh cells were much higher in the circulating blood of patients with IgG4‐RD than in healthy controls, and expansion of mature Tfh cell subsets was even greater in the involved organ tissue of patients. Nearly 90% of CD4+CXCR5+ICOS+ Tfh cells in the involved submandibular gland tissue of patients with IgG4‐RD expressed PD‐1. Notably, in patients with IgG4‐RD, the frequency of PD‐1 in CD4+CXCR5+ICOS+ T cells showed a significant positive correlation with the serum levels of IgG, serum levels of IgG4, and IgG4:IgG ratio and the number of organs involved. Interestingly, the frequencies of PD‐1 in CD4+CXCR5+ICOS+ T cells also positively correlated with the frequencies of CD19+CD24−CD38high plasmablasts/plasma cells, which have been considered to be a potentially useful biomarker for diagnosis and assessment of disease activity in IgG4‐RD 16. Therefore, our data demonstrate that the expression of PD‐1 in CD4+CXCR5+ICOS+ Tfh cells might play an important role in the pathogenesis of IgG4‐RD, especially in the process of inducing GC B cell differentiation into IgG4‐secreting plasma cells. Inhibition of the expansion of, or tissue maturation of, Tfh cells might provide a target of therapy for IgG4‐RD.
Multiple transcriptional regulators influence different aspects of Tfh cell development, migration, and function. These include the positive transcription factors Bcl‐6, interferon regulatory factor 4, c‐Maf, basic leucine zipper ATF‐like transcription factor, and STATs, and the negative transcription factors BLIMP‐1 (PRDM1), FoxO1, FoxP1, and Kruppel‐like factor 2 20. Among these transcription factors, the balance between Bcl‐6 and BLIMP‐1 (PRDM1) plays an essential role in the generation and function of normal Tfh cells. In this study, although there was no significant difference in Bcl‐6 mRNA expression in cTfh cells between healthy controls and patients with IgG4‐RD, Bcl‐6 was found to be highly expressed in the tissue of patients with IgG4‐RD, mainly located in ectopic GCs of the involved tissue.
One possible explanation for this is that Bcl‐6 expression by Tfh cells is unstable. It has previously been shown that Bcl‐6 expression is only necessary for Tfh cell generation at the early stage of Tfh cell maturation in GCs, but no longer required for Tfh cell function once CD4+ T cells have committed to the Tfh cell pathway, and Bcl‐6 expression may be down‐regulated when Tfh cells are in a state of silence 9, 18. Consistent with this possibility, in a Bcl‐6 reporter mouse strain, Tfh cells gradually down‐modulated Bcl‐6 protein expression over a few weeks after development. The Bcl‐6low Tfh cells rapidly terminated proliferation and up‐regulated IL‐7 receptor expression. In addition, it was reported that there was no difference between the function of BCl‐6+ Tfh cells and the function of Bcl‐6− Tfh cells 21. However, BLIMP‐1 was barely expressed in the affected tissue (data not shown), but was up‐regulated in the peripheral blood of patients with IgG4‐RD. The up‐regulation of BLIMP‐1 (PRDM1) in circulating CD4+ T cells of patients with IgG4‐RD was not quite clear. We assumed that BLIMP‐1 (PRDM1) might function as a compensatory mechanism and be increased once GC Tfh cells developed and transformed into memory cTfh cells. Alternatively, BLIMP‐1 (PRDM1) might be up‐regulated in blood cTfh cells as a means to prevent their full differentiation into functional cTfh cells, a condition that is restricted to the tissue 22. Therefore, the mechanisms through which cTfh cells are controlled by multiple transcriptional regulators in IgG4‐RD needs to be further investigated.
As mentioned above, IL‐21 is essential for Tfh cell development and plays a pivotal role in the capacity of Tfh cells to drive B cell differentiation into plasmablasts/plasma cells. Our study also revealed that the levels of IL‐21 mRNA were up‐regulated in peripheral CD4+ T cells of patients with IgG4‐RD compared to healthy controls, and significantly decreased after treatment. In addition, we demonstrated that the IL‐21 mRNA level was positively correlated with the serum levels of IgG, serum levels of IgG4, and IgG4:IgG ratio. These results suggest that IL‐21 might play a critical role in the pathogenesis of IgG4‐RD. In the affected tissue of patients with IgG4‐RD, IL‐21 protein was highly expressed around the glandular tissue, as well as diffusely expressed throughout the tissue.
The major function of Tfh cells is to help naive B cells expand and differentiate into high‐affinity memory B cells and long‐lived plasma cells within GCs 18. Abnormal expansion and/or functional augmentation of Tfh cells could lead to ectopic GC formation and abnormal immune responses, which could result in pathologic immune responses and a large amount of IgG4 in patients with IgG4‐RD 9. In this regard, we further found that the function of Tfh cells in Ig4‐RD was also abnormal. The ability of cTfh cells from patients with IgG4‐RD to enhance B cell proliferation was augmented compared to that of cTfh cells from healthy controls. Importantly, cTfh cells from patients with IgG4‐RD could induce naive B cell differentiation into switched memory B cells and CD19+CD24−CD38high plasmablasts/plasma cells more effectively than could healthy control cTfh cells, leading to greater production of IgG4. On the other hand, cTfh cells from patients with IgG4‐RD inhibited B cell apoptosis more effectively than cTfh cells from healthy controls. The mechanism of this enhanced function of cTfh cells is currently unknown, but the augmented function of cTfh cells in patients with IgG4‐RD is likely to contribute to the exaggerated differentiation of IgG4‐producing plasma cells and the onset of the disease.
Previously, Akiyama et al have reported that the number of cTfh2 cells was greatly increased in patients with IgG4‐RD when compared to healthy controls and patients with other autoimmune diseases (those with primary SS and those with mixed connective tissue disease), and positively associated with the serum levels of IgG4, the IgG4:IgG ratio, and the number of organs involved 19, 23. Subsequently, they examined more patients and further demonstrated that Tfh2 cells induced the differentiation of naive B cells into plasmablasts and enhanced production of IgG4. Moreover, the frequency of activated cTfh2 cells positively correlated with the serum levels of IgG4, IgG4‐RD Responder Index (RI), and number of organs involved in patients with IgG4‐RD, whereas the frequency of activated cTfh1 cells correlated with the IgG4‐RD RI, but not with serum levels of IgG4 23. However, in the current study, we were able to demonstrate that both cTfh1 and cTfh2 cells were increased in the circulating blood of IgG4‐RD patients, and were even more expanded in the involved tissue, but we did not find a statistically significant relationship between the increase in either cTfh1 or cTfh2 subpopulations with clinical or laboratory parameters of IgG4‐RD.
There are a number of possible explanations for this apparent discrepancy. First, Akiyama et al analyzed Tfh cell subsets among the memory CXCR5+CD45RA−CD4+ cTfh cell subset only. Second, according to the expression and intensity of PD‐1 and ICOS, each of the cTfh1, cTfh2, and cTfh17 subpopulations could be further divided into 3 subsets: one activated subset (ICOS+PD‐1+), and 2 quiescent subsets (ICOS‐PD‐1+ and ICOS−PD‐1−) 22, 24. In cTfh2 and cTfh17 cells, the ICOS+PD‐1+ activated subpopulation has increased functional capacity to help both naive and memory B cells, whereas the ICOS‐PD‐1+ quiescent populations more efficiently promote help for memory B cells than the ICOS‐PD‐1− population, although the latter was more efficient in helping naive B cells to produce Ig. The ICOS+PD‐1+ activated cTfh1 cell subpopulation was the most efficient at inducing memory B cells to proliferate and differentiate into plasma cells via IL‐21 and IL‐10, with an increase in antibody titers 22, 24, 25, 26, 27. This may explain why the increased numbers of total cTfh1 and cTfh2 cells did not reflect the level of disease activity. Consistent with the findings of Akiyama et al 23, the number of activated cTfh2 cells, but not total cTfh2 cells, observed in the current study positively correlated with the serum levels of IgG4, the IgG4‐RD RI, and the number of involved organs.
Based on the findings of the functional abnormalities of cTfh cells in patients with IgG4‐RD, we further investigated which cTfh cell subset influenced the activation and differentiation of B cells. Our results demonstrated that all of the cTfh cell subsets from patients with IgG4‐RD exhibited augmented function when compared to those from healthy controls. In patients with IgG4‐RD, it was mainly cTfh1 and cTfh17 cells that led to the increased proliferation of B cells, whereas mainly cTfh1 cells, and especially cTfh2 cells, induced differentiation of B cells into IgG4‐producing plasmablasts/plasma cells. Taken together, these findings demonstrate that the functions of these Tfh cell subsets may explain many of the abnormalities in B cell function characteristic of IgG4‐RD.
In conclusion, Tfh cell subsets are expanded and appear to play critical roles in the pathogenesis of IgG4‐RD. Understanding the involvement of Tfh cell subsets in IgG4‐RD could provide insights into development of novel treatments.
Author contributions
All authors were involved in drafting the article or revising it critically for important intellectual content, and all authors approved the final version to be published. Drs. W. Zhang and Lipsky had full access to all of the data in the study and take responsibility for the integrity of the data and the accuracy of the data analysis.
Study conception and design
Y. Chen, Lin, W. Zhang, Lipsky.
Acquisition of data
Y. Chen, Lin, Yang, Wang, P. Zhang, Feng, H. Chen, Peng, X. Zhang, Zhao, Zeng, F. Zhang, W. Zhang, Lipsky.
Analysis and interpretation of data
Y. Chen, Lin, Yang, Wang, P. Zhang, Feng, H. Chen, Peng, X. Zhang, Zhao, Zeng, F. Zhang, W. Zhang, Lipsky.
Supporting information
Supplementary Figure 1
Supplementary Table 1
Supported by the National Natural Science Foundation of China (grants 81373190 and 81571587), the Natural Science Foundation of Beijing (grant 7172178), CAMS Initiative for Innovative Medicine (grant 2017‐12M‐3‐001), and the National Key Research and Development Program of China (grant 2016YFC0901500).
Contributor Information
Wen Zhang, Email: peterlipsky@comcast.net.
Peter E. Lipsky, Email: zhangwen91@sina.com.
References
- 1. Chen M, Guo Z, Ju W, Bernhard R, He XS, Zheng SG, et al. The development and function of follicular helper T cells in immune responses. Cell Mol Immunol 2012;9:375–9. [DOI] [PMC free article] [PubMed] [Google Scholar]
- 2. Wali S, Sahoo A, Puri S, Alekseev A, Nurieva R. Insights into the development and regulation of T follicular helper cells. Cytokine 2016;87:9–19. [DOI] [PMC free article] [PubMed] [Google Scholar]
- 3. Weber JP, Fuhrmann F, Feist RK, Lahmann A, Al Baz MS, Gentz LJ, et al. ICOS maintains the T follicular helper cell phenotype by down‐regulating Kruppel‐like factor 2. J Exp Med 2015;2:217–33. [DOI] [PMC free article] [PubMed] [Google Scholar]
- 4. Good‐Jacobson KL, Szumilas CG, Chen L, Sharpe AH, Tomayko MM, Shlomchik MJ. PD‐1 regulates germinal center B cell survival and the formation and affinity of long‐lived plasma cells. Nat Immunol 2010;11:535–42. [DOI] [PMC free article] [PubMed] [Google Scholar]
- 5. Zotos D, Coquet JM, Zhang Y, Light A, D'Costa K, Kallies A, et al. IL‐21 regulates germinal center B cell differentiation and proliferation through a B cell‐intrinsic mechanism. J Exp Med 2010;207:365–78. [DOI] [PMC free article] [PubMed] [Google Scholar]
- 6. Johnston RJ, Poholek AC, DiToro D, Yusuf I, Eto D, Barnett B, et al. Bcl‐6 and Blimp‐1 are reciprocal and antagonistic regulators of T follicular helper cell differentiation. Science 2009;325:1006–10. [DOI] [PMC free article] [PubMed] [Google Scholar]
- 7. Morita R, Schmitt N, Bentebibel SE, Ranganathan R, Bourdery L, Zurawski G, et al. Human blood CXCR5(+)CD4(+) T cells are counterparts of T follicular cells and contain specific subsets that differentially support antibody secretion. Immunity 2011;34:108–21. [DOI] [PMC free article] [PubMed] [Google Scholar]
- 8. Schmitt N, Bentebibel SE, Ueno H. Phenotype and functions of memory Tfh cells in human blood. Trends Immunol 2014;35:436–42. [DOI] [PMC free article] [PubMed] [Google Scholar]
- 9. Crotty S. T follicular helper cell differentiation, function, and roles in disease. Immunity 2014;41:529–42. [DOI] [PMC free article] [PubMed] [Google Scholar]
- 10. Mesquita D Jr, Cruvinel WM, Resende LS, Mesquita FV, Silva NP, Câmara NO, et al. Follicular helper T cell in immunity and autoimmunity. Braz J Med Biol Res 2016;49:e5209. [DOI] [PMC free article] [PubMed] [Google Scholar]
- 11. Papp G, Szabo K, Szekanecz Z, Zeher M. Follicular helper T cells in autoimmune diseases. Rheumatology (Oxford) 2014;53:1159–60. [DOI] [PubMed] [Google Scholar]
- 12. Khosroshahi A, Wallace ZS, Crowe JL, Akamizu T, Azumi A, Carruthers MN, et al. International consensus guidance statement on the management and treatment of IgG4‐related disease. Arthritis Rheumatol 2015;67:1688–99. [DOI] [PubMed] [Google Scholar]
- 13. Stone JH, Zen Y, Deshpande V. IgG4‐related disease. N Engl J Med 2012;366:539–51. [DOI] [PubMed] [Google Scholar]
- 14. Wallace ZS, Mattoo H, Carruthers M, Mahajan VS, Della Torre E, Lee H, et al. Plasmablasts as a biomarker for IgG4‐related disease, independent of serum IgG4 concentrations. Ann Rheum Dis 2015;74:190–5. [DOI] [PMC free article] [PubMed] [Google Scholar]
- 15. Lin W, Jin L, Chen H, Wu Q, Fei Y, Zheng W, et al. B cell subsets and dysfunction of regulatory B cells in IgG4‐related diseases and primary Sjogren's syndrome: the similarities and differences. Arthritis Res Ther 2014;16:R118. [DOI] [PMC free article] [PubMed] [Google Scholar]
- 16. Lin W, Zhang P, Chen H, Wu Q, Fei Y, Zheng W, et al. Circulating plasmablasts/plasma cells: a potential biomarker for IgG4‐related disease. Arthritis Res Ther 2017;19:25. [DOI] [PMC free article] [PubMed] [Google Scholar]
- 17. Umehara H, Okazaki K, Masaki Y, Kawano M, Yamamoto M, Saeki T, et al. Comprehensive diagnostic criteria for IgG4‐related disease (IgG4‐RD), 2011. Mod Rheumatol 2012;22:21–30. [DOI] [PubMed] [Google Scholar]
- 18. Ma CS, Deenick EK. Human T follicular helper (Tfh) cells and disease. Immunol Cell Biol 2014;92:64–71. [DOI] [PubMed] [Google Scholar]
- 19. Akiyama M, Suzuki K, Yamaoka K, Yasuoka H, Takeshita M, Kaneko Y, et al. Number of circulating follicular helper 2 T cells correlates with IgG4 and interleukin‐4 levels and plasmablast numbers in IgG4‐related disease. Arthritis Rheumatol 2015;67:2476–81. [DOI] [PubMed] [Google Scholar]
- 20. Vinuesa CG, Linterman MA, Yu D, MacLennan IC. Follicular helper T cells. Annu Rev Immunol 2016;34:335–68. [DOI] [PubMed] [Google Scholar]
- 21. Kitano M, Moriyama S, Ando Y, Hikida M, Mori Y, Kurosaki T, et al. Bcl‐6 protein expression shapes pre‐germinal center B cell dynamics and follicular helper T cell heterogeneity. Immunity 2011;34:961–72. [DOI] [PubMed] [Google Scholar]
- 22. Maul J, Baumjohann D. Emerging roles for microRNAs in T follicular helper cell differentiation. Trends Immunol 2016;37:297–309. [DOI] [PubMed] [Google Scholar]
- 23. Akiyama M, Yasuoka H, Yamaoka K, Suzuki K, Kaneko Y, Kondo H, et al. Enhanced IgG4 production by follicular helper 2 T cells and the involvement of follicular helper 1 T cells in the pathogenesis of IgG4‐related disease. Arthritis Res Ther 2016;18:167. [DOI] [PMC free article] [PubMed] [Google Scholar]
- 24. Ueno H. Human circulating T follicular helper cell subsets in health and disease. J Clin Immunol 2016;36:34–9. [DOI] [PubMed] [Google Scholar]
- 25. Bentebibel SE, Lopez S, Obermoser G, Schmitt N, Mueller C, Harrod C, et al. Induction of ICOS+CXCR3+CXCR5+ TH cells correlates with antibody responses to influenza vaccination. Sci Transl Med 2013;5:176ra32. [DOI] [PMC free article] [PubMed] [Google Scholar]
- 26. Bentebibel SE, Khurana S, Schmitt N, Kurup P, Mueller C, Obermoser G, et al. ICOS(+)PD‐1(+)CXCR3(+) T follicular helper cells contribute to the generation of high‐avidity antibodies following influenza vaccination. Sci Rep 2016;6:26494. [DOI] [PMC free article] [PubMed] [Google Scholar]
- 27. Locci M, Havenar‐Daughton C, Landais E, Wu J, Kroenke MA, Arlehamn CL, et al. Human circulating PD‐1+CXCR3‐CXCR5+ memory Tfh cells are highly functional and correlate with broadly neutralizing HIV antibody responses. Immunity 2013;39:758–69. [DOI] [PMC free article] [PubMed] [Google Scholar]
Associated Data
This section collects any data citations, data availability statements, or supplementary materials included in this article.
Supplementary Materials
Supplementary Figure 1
Supplementary Table 1