

Abstract
Modern life involves mistimed sleeping and eating patterns that in experimental studies are associated with adverse health effects. We assessed whether timing of meals is associated with breast and prostate cancer risk taking into account lifestyle and chronotype, a characteristic correlating with preference for morning or evening activity. We conducted a population‐based case‐control study in Spain, 2008–2013. In this analysis we included 621 cases of prostate and 1,205 of breast cancer and 872 male and 1,321 female population controls who had never worked night shift. Subjects were interviewed on timing of meals, sleep and chronotype and completed a Food Frequency Questionaire. Adherence to the World Cancer Research Fund/American Institute of Cancer Research recommendations for cancer prevention was examined. Compared with subjects sleeping immediately after supper, those sleeping two or more hours after supper had a 20% reduction in cancer risk for breast and prostate cancer combined (adjusted Odds Ratio [OR] = 0.80, 95%CI 0.67–0.96) and in each cancer individually (prostate cancer OR = 0.74, 0.55–0.99; breast cancer OR = 0.84, 0.67–1.06). A similar protection was observed in subjects having supper before 9 pm compared with supper after 10 pm. The effect of longer supper‐sleep interval was more pronounced among subjects adhering to cancer prevention recommendations (OR both cancers= 0.65, 0.44–0.97) and in morning types (OR both cancers = 0.66, 0.49–0.90). Adherence to diurnal eating patterns and specifically a long interval between last meal and sleep are associated with a lower cancer risk, stressing the importance of evaluating timing in studies on diet and cancer.
Keywords: breast cancer, prostate cancer, diet, circadian disruption
Short abstract
What's new?
Evidence shows that long‐term disruption of endogenous circadian rhythms may be associated with cancer. The effects of mistimed sleeping and eating patterns that come with modern life are however less clear. This large Spanish population‐based study examined whether meal timing and sleep patterns are associated with the two most common nightshift‐related cancers. Adherence to a more diurnal eating pattern, and specifically an early supper and a long interval between last meal and sleep were associated with a lower breast and prostate cancer risk, stressing the importance of evaluating circadian rhythms in diet and cancer studies and revisiting recommendations for prevention.
Introduction
Experimental and epidemiological evidence shows that long term disruption of endogenous circadian rhythms, in particular due to exposure to light at night, may be associated with a wide range of common diseases, including cancer, cardiovascular diseases, obesity and type 2 diabetes.1, 2, 3, 4 Studies have shown profound changes of the human transcriptome5 and metabolome6 associated with circadian disruption and sleep deprivation. The prevalence of circadian disruption in human populations is high and increasing due to the expanding human activities over the 24 hr period. In 2007 the International Agency for Research on Cancer (IARC/WHO) classified shift work involving circadian disruption as probably carcinogenic to humans based mainly on animal experimental evidence and evidence on mechanisms, while the human evidence on shift work and breast cancer was considered as limited.7, 8 Following IARC's evaluation, most new studies supported an association of night work with breast and prostate cancer9, 10 although the largest cohort study on breast cancer did not support an association.11 Shift work has also been associated with cancer subphenotypes and specifically with more advanced cancer at diagnosis.9 Individual chronotype is a human attribute with genetic basis that correlates with diurnal preference for activities in the morning or evening.12 Chronotype may affect adaptation to irregular work, sleep and diet schedules and modify the effects of circadian disruption.13
Modern life involve erratic and mistimed eating patterns such as late night eating that are associated with adverse health endpoints in experimental studies.14 In humans there is little evidence on the effect of eating patterns on health and commonly quoted recommendations on “best” eating times are frequently based on poor scientific evidence.15 From an evolutionary perspective, intermittent eating patterns with periods of fasting were the norm in humans and food was primarily consumed during daylight with long hours of overnight fasting.16 In human experimental studies, changes in meal timing were associated with acute effects in leptin levels,17 with synchronizing peripheral circadian rhythms such as glucose levels18 and with systemic inflammation.19 In experimental studies, circadian reprogramming of tumor transcriptome with meal timing was associated with cancer growth inhibition20 and intermittent periods of energy restriction were found to prevent disease processes through a variety of mechanisms.21
Studies on nutrition and cancer have focused on type (e.g., consumption of fruits and vegetables) and quantity of food intake, rather than on timing of eating. Several components of diet and dietary patterns such as the Mediterranean diet or the World Cancer Research Fund/American Institute of Cancer Research (WCRF/AICR), have been associated with breast cancer22, 23 while the causes of prostate cancer, including diet, are poorly understood. In experimental animals14 timing of eating has been shown to modify the effects of diet such as obesity following a hypercaloric diet in mice when eating at the “wrong” time (during the day in mice) compared with eating during the night (normal eating time for mice).
We assessed in a large population‐based study in Spain whether timing of eating and sleep patterns are associated with breast and prostate cancer risk, the two most common night shift related cancers in humans. We also evaluated whether circadian timing of meals modifies the effect of factors associated with cancer risk, such as adherence to cancer prevention recommendations.
Methods
Study population
MCC‐Spain (http://www.mccspain.org) is a population‐based case‐control study including cases from five tumors and population controls conducted in 12 Spanish regions in 2008–2013.24 In this analysis we included 1,738 breast and 1,112 prostate incident cancer cases aged 20–85 who were histologically confirmed, and who lived in the catchment area of the participating hospitals for at least 6 months. Controls (1,910 women; 1,493 men) were randomly selected from primary health centers and were frequency matched by sex, geographical area and age. Response rates varied by center and on average were 72% among cases and 52% among controls. After excluding subjects who had ever done night shift (partly or entirely working between 00:00 and 6:00 am at least 3 nights per month), 1205 breast cases, 621 prostate cases, 1,321 women controls and 872 men controls with complete information on chronotype and timing of activities questionnaire were included. The study was approved by the Ethics committees of the participating institutions. Written informed consent was obtained from each participant.
Data collection
Face‐to‐face interviews included information on potential risk factors for breast and/or prostate cancer such as age, educational level, family socioeconomic level, race, BMI, family history of cancer, smoking status and for women, age of menarche, parity, age at the first birth, menopausal status, oral contraceptive use and history of hormonal replacement therapy. Information on leisure time physical activity (type, frequency and duration) was requested for all activities held over lifetime. Current sleep duration and sleep problems that persisted for at least 1 year were also assessed. Diet habits were reported through a self‐administered validated food frequency questionnaire including 140 food items.25 Nutrient intake was estimated using food composition tables published for Spain.26 Chronotype was assessed through a follow‐up phone interview and the use of the Munich Chronotype Questionnaire (MCTQ).27 Information on eating habits included number of meals, duration and timing. Information was requested for patterns at age 40 (or current age for younger subjects) and at 1 year prior to diagnosis (cases) or interview (controls), and also separately for working days and weekends. Since results did not differ substantially between reports on eating patterns at age 40 and at 1 year prior to diagnosis (cases) or interview (controls), or of eating patterns in work and weekend days, here we only report results for patterns at age 40 and work days (to avoid missing values for subjects not reporting weekend patterns). Clinical information was collected from medical records including tumor hormonal receptor status, differentiation grade and histological type.
A WCRF/AICR score was constructed, incorporating six recommendations for cancer prevention (body fatness, physical activity, foods and drinks that promote weight gain, plant foods, animal foods and alcoholic drinks).28 The total WCRF/AICR score ranged from 0 to 6, with higher scores indicating greater adherence to the WCRF/AICR recommendations. The score was further categorized into sex‐specific tertiles according to the distribution of the score in controls.
Chronotype (MSFcorr) was estimated as the mid‐sleep time on free days (MSF = [sleep onset on free day + (sleep duration on free day)/2)], corrected for oversleep on free days compared with working days (MSFcorr = [MSF – (sleep duration on free day‐sleep duration on a working day)/2]. Chronotype was assessed as a continuous score expressed in local time, and in tertiles based on the sex‐specific distribution of MSF among controls (Females: morning type: MSFcorr < 03:55 hr, neither type: MSFcorr = 03:55–04:45 hr, evening type: MSFcorr > 04:45 hr; Males: morning type: MSFcorr < 03:35, neither type: MSFcorr = 03:35–04:20, evening type: MSFcorr > 04:20).
Statistical analysis
We used unconditional logistic regression analysis and calculated odds ratios (OR) with 95% confidence intervals (CI). We adjusted for matching variables (age, center), socioeconomic status (education: highest grade completed, less than primary school, primary school, secondary school and university) and, in women, menopausal status. Premenopausal status was defined as presence of menstruation during the last year. There is a lack of prior knowledge on the association of cancer risk factors with eating times and we therefore did not use Directed Acyclic Graphs (DAGs) to select potential confounders. We empirically further adjusted for variables that could be related either with the exposure or are a cause of the disease including family history of breast/prostate cancer in first degree relatives; smoking; BMI (normal weight <25; overweight, 25–30; obese ≥30); breast feeding and parity (women); WCRF/AICR score; chronotype; socioeconomic status score (ranging from 0 to 7) based on a combination of information on education of parents, occupation of the subject and education of the subject; and urban vulnerability to measure socioeconomic status at area level coded from 0 to 1.29 Finally, we also adjusted for sleep (duration; reported sleeping problems), indoor light when sleeping (reported using a four digit Likert scale: (i) Total darkness; (ii) Almost dark; (iii) Dim light and (iv) Quite illuminated), and (for subjects in Barcelona and Madrid) also residence outdoor blue light spectrum. The latter was evaluated using geocoded residence of the subjects, Geographic Information System and modeling of light from digital photos taken by astronauts at the International Space Station as described in Garcia‐Saenz et al..30 Further adjustment to the above mentioned variables made minimal difference in risk estimates and these results are fully presented in Supporting Information Tables.
We calculated joint effects for the combination of both cancers applying effects meta‐analysis of adjusted ORs using fixed or random effects based on I 2 index to assess the degree of heterogeneity. We tested possible interactions between eating and sleep time variables with chronotype and the WCRF/AICR score using the likelihood ratio test. We evaluated the association between timing of meals and aggressiveness of disease (Gleason score for prostate cancer) or disease subphenotypes (receptors for breast cancer) using a multinomial logistic regression and calculated relative risk ratios (RRR) with 95% CI. We used generalized additive models to inspect the linearity of associations.
Results
The distribution among cases and controls of several identified risk factors for breast and prostate cancer are shown in Table 1. Family history of cancer was associated with both breast (p values <0.001) and prostate cancer (p values <0.001). Around 27% of breast cancer cases adhered to a healthy lifestyle (WCRF/AICR score above 4.5) compared with 31% for controls and a similar difference was observed for prostate cancer (score above 4.25 for prostate, Table 1). There were no marked differences between cases and controls for most other variables.
Table 1.
Descriptive characteristics of breast and prostate cancer cases and controls included in the MCC‐Spain Study
| Controls for breast cancer (N = 1,321) | Breast cancer cases (N = 1,205) | Controls for prostate cancer (N = 872) | Prostate cancer cases (N = 621) | |
|---|---|---|---|---|
| N (%) | N (%) | N (%) | N (%) | |
| Age (years); mean(SD) | 58.3 (12.5) | 55.5 (11.7) | 66 (8.3) | 65.6 (7) |
| Educational level | ||||
| Less than primary school | 184 (13.9) | 146 (12.1) | 123 (14.1) | 109 (17.6) |
| Primary school | 410 (31.0) | 408 (33.9) | 256 (29.4) | 249 (40.1) |
| Secondary school | 441 (33.4) | 415 (34.4) | 268 (30.7) | 146 (23.5) |
| University | 286 (21.7) | 236 (19.6) | 225 (25.8) | 117 (18.8) |
| Smoking | ||||
| Never | 768 (58.3) | 679 (56.9) | 247 (28.4) | 174 (28.2) |
| Current | 283 (21.5) | 284 (23.8) | 198 (22.8) | 135 (21.8) |
| Ex‐smoker | 266 (20.2) | 231 (19.3) | 425 (48.9) | 309 (50.0) |
| Family history of breast or prostate cancer | ||||
| No | 1,195 (90.5) | 1,026 (85.1) | 816 (93.6) | 518 (83.4) |
| Yes | 126 (9.5) | 179 (14.9) | 56 (6.4) | 103 (16.6) |
| BMI (kg/cm2) | ||||
| <25 | 678 (51.3) | 589 (48.9) | 233 (26.7) | 159 (25.6) |
| ≥25 to <30 | 410 (31.0) | 401 (33.3) | 444 (50.9) | 323 (52.0) |
| ≥30 | 233 (17.6) | 215 (17.8) | 195 (22.4) | 139 (22.4) |
| Chronotype | ||||
| Morning type | 496 (37.8) | 437 (36.7) | 429 (50.5) | 310 (50.1) |
| Intermediate chronotypes | 535 (40.8) | 470 (39.5) | 311 (36.6) | 231 (37.3) |
| Evening type | 281 (21.4) | 284 (23.8) | 109 (12.8) | 78 (12.6) |
| WCRF/AICR | ||||
| Tertile 1 (low) | 447 (39.6) | 409 (42.9) | 307 (40.6) | 184 (36.7) |
| Tertile 2 | 333 (29.5) | 290 (30.4) | 262 (34.6) | 216 (43.0) |
| Tertile 3 (high) | 348 (30.9) | 255 (26.7) | 188 (24.8) | 102 (20.3) |
| Menopause | ||||
| Premenopausal | 389 (29.4) | 443 (36.8) | NA | NA |
| Postmenopausal | 932 (70.6) | 762 (63.2) | NA | NA |
| Breastfeeding (months); mean (SD) | 8.6 (12.8) | 7.9 (13.2) | NA | NA |
| Parity | ||||
| Nulliparous | 236 (17.9) | 246 (20.4) | NA | NA |
| 1–2 children | 742 (56.3) | 705 (58.6) | NA | NA |
| ≥3 children | 340 (25.8) | 252 (20.9) | NA | NA |
Tertiles WCRF/AICR similar to those in Romaguera et al. (2017). Prostate: WCRF(T1): 0.25–3; WCRF(T2): 3.25–4; WCRF(T3): 4.25–6; Breast: WCRF(T1): 1–3.5; WCRF(T2): 3.75–4.25; WCRF(T3): 4.5–6.
NA: Not applicable.
Nearly all subjects had breakfast, lunch and supper (Supporting Information Table S1), about a third had an afternoon snack and about 7% had an after supper snack. Breakfast was on average around 8:30 am, lunch at 2 pm and supper at 9 pm. Patterns were similar in cases and controls and meal patterns were, generally, similar in weekdays and weekends.
Timing of meals and time elapsed between supper and sleep
The distribution among controls of potential risk factors for breast and prostate cancer in relation to short or long time elapsed between supper (main evening meal) and sleep are shown in Table 2. In men and to a less extent in women, never smokers tended to have shorter time elapsed, and the same pattern was observed for morning types in both sexes, nulliparous women and low educational level men. No differences were seen by BMI.
Table 2.
Distribution of potential risk factors for breast and prostate cancer by time interval between diner and sleeping (more or less than 2 hr) among controls
| Women | Men | |||
|---|---|---|---|---|
| <2 hr N = 727 N (%) | ≥2 hr N = 530 N (%) | <2 hr N = 625 N (%) | ≥2 hr N = 210 N (%) | |
| Age (years); mean(SD) | 58.1 (12.8) | 58 (12) | 66.5 (8.4) | 64.3 (8.1) |
| Educational level | ||||
| Less than primary school | 105 (14.4) | 61 (11.5) | 95 (15.2) | 19 (9) |
| Primary school | 224 (30.8) | 168 (31.7) | 190 (30.4) | 55 (26.2) |
| Secondary school | 237 (32.6) | 188 (35.5) | 201 (32.2) | 57 (27.1) |
| University | 161 (22.1) | 113 (21.3) | 139 (22.2) | 79 (37.6) |
| Smoking | ||||
| Never | 426 (58.7) | 301 (57.1) | 190 (30.5) | 47 (22.4) |
| Current | 154 (21.2) | 116 (22) | 132 (21.2) | 59 (28.1) |
| Ex‐smoker | 146 (20.1) | 110 (20.9) | 301 (48.3) | 104 (49.5) |
| Family history of breast or prostate cancer | ||||
| No | 651 (89.5) | 484 (91.3) | 587 (93.9) | 193 (91.9) |
| Yes | 76 (10.5) | 46 (8.7) | 38 (6.1) | 17 (8.1) |
| BMI (kg/cm2) | ||||
| <25 | 399 (54.9) | 258 (48.7) | 160 (25.6) | 63 (30) |
| ≥25 to <30 | 206 (28.3) | 175 (33) | 332 (53.1) | 98 (46.7) |
| ≥30 | 122 (16.8) | 97 (18.3) | 133 (21.3) | 49 (23.3) |
| Chronotype | ||||
| Morning type | 297 (41.1) | 176 (33.5) | 319 (52) | 94 (46.1) |
| Intermediate chronotypes | 276 (38.2) | 232 (44.1) | 220 (35.8) | 79 (38.7) |
| Evening type | 150 (20.7) | 118 (22.4) | 75 (12.2) | 31 (15.2) |
| WCRF/AICR | ||||
| Tertile 1 (low) | 248 (39.7) | 180 (39.9) | 221 (40.3) | 71 (39.9) |
| Tertile 2 | 189 (30.3) | 127 (28.2) | 188 (34.3) | 64 (36) |
| Tertile 3 (high) | 187 (30) | 144 (31.9) | 139 (25.4) | 43 (24.2) |
| Menopause | ||||
| Premenopausal | 226 (31.1) | 152 (28.7) | NA | NA |
| Postmenopausal | 501 (68.9) | 378 (71.3) | NA | NA |
| Breastfeeding (months); mean (SD) | 8 (13.4) | 9 (11.5) | NA | NA |
| Parity | ||||
| Nulliparous | 150 (20.7) | 77 (14.6) | NA | NA |
| 1–2 children | 399 (55) | 308 (58.2) | NA | NA |
| ≥3 children | 176 (24.3) | 144 (27.2) | NA | NA |
Cancer risk decreased with increasing time between supper (main evening meal) and sleeping (Table 3). Compared with subjects sleeping immediately after supper, those sleeping two or more hours after supper had a 20% reduction in cancer risk for breast and prostate cancer combined (adjusted OR = 0.80, 95%CI 0.67–0.96). This effect was slightly more pronounced for prostate cancer (OR = 0.74, 95%CI 0.55–0.99, Table 3); risk declined steadily and a test for departure from linearity was not statistically significant (Fig. 1). A similar but less strong pattern was observed for breast cancer (OR = 0.84, 95%CI 0.67–1.06), also with a steady decline with time elapsed since supper (Fig. 1). Having an evening meal before 9 pm compared with having supper after 10 pm (Table 3) was associated with decreased risk for both cancers combined (OR = 0.82, 0.67–1.00) an effect that was slightly more pronounced for prostate (OR = 0.75, 0.53–1.07) than breast cancer (OR = 0.85, 0.66–1.09). We examined cancer risk combining time of supper and time interval between supper and sleep. Subjects having both earlier supper (before 9 pm) and long interval between supper and sleep (>2 hr) had an approximately 25% decreased combined cancer risk (OR = 0.76, 0.57–1.0) compared with those having supper after 10 pm and short supper‐sleep interval. This pattern was also observed in each of the two cancers individually (Table 3).
Table 3.
Association of timing of supper and sleep interval on risk of breast and prostate cancer
| Controls for breast cancer N (%) | Breast cancer cases N (%) | OR (95%CI)a | Controls for prostate cancer N (%) | Prostate cancer cases N (%) | OR (95%CI)b | Combined breast and prostate cancer OR (95%CI) | |
|---|---|---|---|---|---|---|---|
| Supper/sleep interval | |||||||
| 1 hr or less (ref) | 234 (18.6) | 230 (19.8) | 304 (36.4) | 253 (42.4) | |||
| From >1 to ≤2 hr | 493 (39.2) | 483 (41.6) | 0.99 (0.79,1.24) | 321 (38.4) | 215 (36.1) | 0.79 (0.62,1.02) | 0.89 (0.72,1.11) |
| More than 2 hr | 530 (42.2) | 448 (38.6) | 0.84 (0.67,1.06) | 210 (25.1) | 128 (21.5) | 0.74 (0.55,0.99) | 0.80 (0.67,0.96) |
| Time of supper | |||||||
| 10 pm or later (ref) | 260 (20.4) | 271 (23.0) | 257 (30.2) | 204 (33.4) | |||
| 9:00 to <10 pm | 721 (56.5) | 641 (54.5) | 0.86 (0.70,1.05) | 470 (55.2) | 329 (53.9) | 0.88 (0.69,1.12) | 0.86 (0.74,1.01) |
| Before 9 pm | 296 (23.2) | 264 (22.4) | 0.85 (0.66,1.09) | 124 (14.6) | 77 (12.6) | 0.75 (0.53,1.07) | 0.82 (0.67,1.00) |
| Combined time of supper and supper/sleep interval c | |||||||
| Late supper/short interval (ref) | 105 (8.4) | 107 (9.2) | 141 (16.9) | 121 (20.3) | |||
| Intermediate | 949 (75.5) | 894 (77.0) | 0.94 (0.70,1.25) | 633 (75.8) | 436 (73.2) | 0.79 (0.59,1.05) | 0.86 (0.70,1.05) |
| Early supper/long interval | 203 (16.1) | 160 (13.8) | 0.77 (0.54,1.09) | 61 (7.3) | 39 (6.5) | 0.74 (0.45,1.19) | 0.76 (0.57,1.00) |
Adjusted for age, educational level, menopausal status and center.
Adjusted for age, educational level and center.
Combined time of supper and supper/sleep interval: Late supper/Short interval: after 10 pm supper and less than 1‐hr supper‐sleep interval; Early supper/Long Interval: Before 9 pm supper and >2 hr supper‐sleep interval; Intermediate: other combinations.
Figure 1.
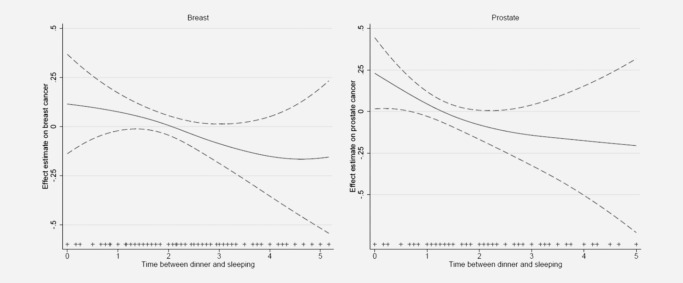
General additive models truncated at 5 hr showing the association (smooth function) of timing of supper and sleep interval and risk of breast and prostate cancer. Estimates are adjusted for age, center, educational level and menopausal status (breast cancer only).
Mutually adjusting time of supper and time interval between supper and sleep, resulted to slightly less pronounced ORs compared with those of models evaluating each time variable separately shown in Table 3. For both cancers combined the OR for long time elapsed between supper and sleep after adjusting for time of supper was 0.84 (0.69, 1.02) while the corresponding adjusted OR for early supper was 0.88 (0.70, 1.10). Time from supper to breakfast was not associated with risk in either cancer (data not shown).
Effect of supper‐sleep timing by chronotype and WCRF/AICR score
The association of chronotype with breast or prostate cancer (Table 4) indicated a higher protection of time elapsed between supper and sleep for morning types (OR both cancer = 0.66, 0.49–0.90) compared with intermediate (OR = 0.85, 0.62–1.16) or evening types (OR = 0.86, 0.57–1.30). This pattern was observed in both breast (OR morning type = 0.65, 0.44–0.97) and prostate cancer (OR morning type = 0.67, 0.41–1.10) (Table 4). An evaluation of more extreme chronotype groups was based on small numbers and estimates were unstable (not shown).
Table 4.
Association of timing of supper and sleep interval on risk of breast and prostate cancer by chronotype
| Chronotype | Controls for breast cancer cases N (%) | Breast cancer cases N (%) | OR (95%CI)a | Controls for prostate cancer cases N (%) | Prostate cancer cases N (%) | OR (95%CI)b | Combined breast and prostate cancer OR (95%CI) |
|---|---|---|---|---|---|---|---|
| Morning type | |||||||
| 1 hr or less (ref) | 83 (19.4) | 92 (24.7) | 114 (41.0) | 96 (48.2) | |||
| From >1 to ≤2 hr | 183 (42.9) | 166 (44.5) | 0.84 (0.58,1.21) | 99 (35.6) | 66 (33.2) | 0.76 (0.50,1.17) | 0.80 (0.61,1.06) |
| More than 2 hr | 161 (37.7) | 115 (30.8) | 0.65 (0.44,0.97) | 65 (23.4) | 37 (18.6) | 0.67 (0.41,1.10) | 0.66 (0.49,0.90) |
| Intermediate Type | |||||||
| 1 hr or less (ref) | 81 (17.7) | 72 (17.7) | 91 (34.5) | 85 (42.5) | |||
| From >1 to ≤2 hr | 172 (37.6) | 173 (42.6) | 1.10 (0.75,1.62) | 118 (44.7) | 72 (36.0) | 0.65 (0.42,1.00) | 0.85 (0.51,1.43) |
| More than 2 hr | 205 (44.8) | 161 (39.7) | 0.84 (0.57,1.23) | 55 (20.8) | 43 (21.5) | 0.87 (0.52,1.45) | 0.85 (0.62,1.16) |
| Evening type | |||||||
| 1 hr or less (ref) | 68 (18.7) | 65 (17.6) | 94 (34.1) | 71 (36.4) | |||
| From >1 to ≤2 hr | 136 (37.4) | 139 (37.7) | 1.05 (0.69,1.60) | 98 (35.5) | 76 (39.0) | 1.02 (0.65,1.59) | 1.03 (0.76,1.40) |
| More than 2 hr | 160 (44.0) | 165 (44.7) | 1.06 (0.70,1.60) | 84 (30.4) | 48 (24.6) | 0.74 (0.45,1.21) | 0.86 (0.57,1.30) |
Adjusted for age, educational level, menopausal status and center.
Adjusted for age, educational level and center.
High adherence to cancer prevention policies (Table 5) was associated with a protective effect for breast cancer (OR = 0.84, 0.67–1.04) compared with low adherence while a less pronounced effect was observed for prostate cancer (OR = 0.90, 0.66–1.25). Effects of time elapsed between supper and sleep in both cancers combined were more pronounced among subjects adhering to cancer prevention recommendations as evaluated through the WCRF/AICR score (OR= 0.65, 0.44–0.97; high adherence) compared with those with lowest adherence (OR = 0.90, 0.66–1.22) (Table 5). This pattern was observed for both breast cancer (OR = 0.72 0.45–1.18 high adherence; OR = 0.87, 0.59–1.28 low adherence; p values = 0.21, LRT test for WCRF/AICR and interaction term, 3 df) and for prostate cancer (OR = 0.51, 0.25–1.05 high adherence; OR = 0.95, 0.58–1.58 low adherence; p values 0.036, as above).
Table 5.
Association of timing of supper and sleep interval on risk of breast and prostate cancer by adherence to cancer prevention recommendations (categories of WCRF/AICR score)
| Interval between supper and sleep by adherence to cancer prevention recommendations | Controls for breast cancer N (%) | Breast cancer cases N (%) | OR (95%CI)a | Controls for prostate cancer N (%) | Prostate cancer cases N (%) | OR (95%CI)b | Combined breast and prostate cancer OR (95%CI) |
|---|---|---|---|---|---|---|---|
| WCRF/AICR lowest adherence | |||||||
| 1 hr or less (ref) | 84 (19.6) | 73 (18.3) | 113 (38.7) | 73 (41.0) | |||
| From >1 to ≤2 hr | 164 (38.3) | 183 (45.9) | 1.27 (0.86,1.86) | 108 (37.0) | 63 (35.4) | 0.87 (0.56,1.37) | 1.07 (0.75,1.54) |
| More than 2 hr | 180 (42.1) | 143 (35.8) | 0.87 (0.59,1.28) | 71 (24.3) | 42 (23.6) | 0.95 (0.58,1.58) | 0.90 (0.66,1.22) |
| WCRF/AICR Intermediate | |||||||
| 1 hr or less (ref) | 61 (19.3) | 64 (23.4) | 81 (32.1) | 87 (41.2) | |||
| From >1 to ≤2 hr | 128 (40.5) | 99 (36.1) | 0.70 (0.45,1.10) | 107 (42.5) | 77 (36.5) | 0.63 (0.41,0.98) | 0.67 (0.49,0.91) |
| More than 2 hr | 127 (40.2) | 111 (40.5) | 0.78 (0.50,1.22) | 64 (25.4) | 47 (22.3) | 0.64 (0.38,1.05) | 0.72 (0.51,1.00) |
| WCRF/AICR high adherence | |||||||
| 1 hr or less (ref) | 53 (16.0) | 44 (17.9) | 66 (36.3) | 45 (47.9) | |||
| From >1 to ≤2 hr | 134 (40.5) | 107 (43.5) | 0.90 (0.56,1.46) | 73 (40.1) | 34 (36.2) | 0.68 (0.39,1.22) | 0.81 (0.56,1.17) |
| More than 2 hr | 144 (43.5) | 95 (38.6) | 0.72 (0.45,1.18) | 43 (23.6) | 15 (16.0) | 0.51 (0.25,1.05) | 0.65 (0.44,0.97) |
Adjusted for age, educational level, menopausal status and center.
Adjusted for age, educational level and center.
Effects by tumor subtype
For breast cancer there were no consistent patterns observed for time elapsed between supper and sleep and cancers with estrogen or progesterone receptors positive tumors or Her2+ tumors while analyses on triple negative tumors were based on a small number of cases (Supporting Information Table S2). The protective effect of the time elapsed between supper and sleep observed for prostate cancer was more pronounced for prostate cancer cases with a Gleason score >7 at diagnosis (RRR = 0.62, 95%CI 0.43–0.89) compared with an RRR of 0.89 (95%CI 0.61–1.29) for those with a score of 7 or less (test for heterogeneity p values 0.12) .
Further adjusted models
Regression models adjusting for basic variables (age, center, education and menopausal status for women) gave similar results with those including in addition variables related to socioeconomic status (socioeconomic score and urban vulnerability index, Supporting Information Table S3). For breast cancer ORs (95%CI) from models with additional socioeconomic adjustment were 0.84 (0.65, 1.07) for >2 hr supper/sleep interval vs. less than 1 hr, 0.83 (0.64, 1.09) for supper before 9 pm vs. after 10 pm, and 0.68 (0.47, 1.00) for long interval/early supper vs. short interval/late supper. The corresponding ORs for prostate cancer were 0.75 (0.55, 1.03), 0.75 (0.51, 1.09) and 0.76 (0.45, 1.27). Further adjustment with variables that could be related to the diseases examined (smoking, family history of prostate/breast cancer, BMI, chronotype, WCRF/AICR, breast feeding, parity) also gave similar results (Supporting Information Table S4).
Adjustment for indoor light (Supporting Information Table S5) and sleep related variables (Supporting Information Table S6) gave very similar results to those of the basic model shown in Table 3. ORs (95%CI) from models with additional adjustment for indoor light for breast cancer (Supporting Information Table S5) were 0.83 (0.66, 1.04) for >2‐hr supper/sleep interval vs. <1 hr, 0.85 (0.66, 1.09) for supper before 9 pm vs. after 10 pm and 0.76 (0.54, 1.08) for long interval/early supper vs. short interval/late supper. The corresponding indoor light adjusted ORs for prostate cancer were 0.72 (0.54, 0.97), 0.74 (0.52, 1.06) and 0.73 (0.45, 1.19). Also shown in Supporting Information Table S5 are associations with exposure to outdoor blue spectrum light for the population in Barcelona and Madrid; adjustment for outdoor blue light had minimal effect on associations between time of eating and sleeping and cancer risk. Similarly, adjusting for either sleep duration or sleep problems made minimal difference in ORs on time of eating and sleeping and cancer risk (Supporting Information Table S6).
Discussion
In this study we found that meal timing was associated with prostate and breast cancer risk and specifically that adherence to diurnal eating patterns and particularly early suppers and a longer supper‐sleep time interval were associated with a lower cancer risk. This is, to our knowledge, the first epidemiological study showing long term health effects associated with mistimed eating patterns.
The present study suggests that changes in timing of circadian controlled activities in sleep or diet that are less extreme than those observed in night shift work, are associated with long term health effects increasing the risk of the most prevalent cancers worldwide. The plausibility of an effect of mistimed eating activities on long term health effects is supported mostly by experimental evidence with little human evidence being available. Acute circadian misalignment of the sleep/wake and feeding cycle experimentally induced in healthy, nonshift workers, was associated with disrupted glucose, insulin, leptin and cortisol rhythms in as few as three days.2 A recent study among shift workers provided evidence of a direct link between night eating and higher levels of markers of inflammation and cardiometabolic risk.31 In our study we examined the effect of a wide spectrum of protective/risk factors estimated through the WCRF/AICR score that have been shown to predict cancer occurrence, and showed that timing of eating and sleep may modify these effects. This is similar to the pattern observed in experimental animals where, for example, obesity was produced not only by the provision of a hyper‐caloric diet but rather by providing this diet at the “wrong” time.14 The World Cancer Research Fund estimates that about a quarter to a third of the commonest cancers are attributable to excess body weight, physical inactivity and poor diet, making these the most common causes of cancers after smoking.32 If timing is proven to be a significant modifier of these effects then it would be important to also define eating and sleep time as one of the recommendations.
We showed that individual preference for morning activities tended to be associated with a higher protection of diurnal eating patterns in both cancers compared with the effect observed in evening types. Individual chronotype is a human attribute believed to have a genetic basis (although other factors like age may also play a role) that reflects the circadian phase of entrainment12 and that reflects personal preference for activities in the morning or evening. It has been suggested that adaptation to evening mistimed activities is more difficult in subjects whose biological rhythms seem to function better during early hours (morning types)13 while evening types (subjects with a later circadian phase) may adapt faster to night shift work or to night time activities. The pattern we observed, although not very pronounced, follows the expected pattern. This is, however, an understudied area of research particularly regarding long term effects of chronotype limiting the prediction of individual risk and planning of prevention policies.
The main strengths of the study are the fairly large sample size, the detailed questionnaire used that was specific on circadian patterns of diet and an internationally used and validated questionnaire on chronotype. Although the circadian pattern questionnaire is extensive and requested information for different time periods in life and separately for weekdays and weekends, the retrospective assessment of eating patterns is the main limitation of the study. The reliability of retrospective assessment of food consumption has well known limitations. Even large cohort studies on food consumption have provided markedly different results on diet and cancer. Dietary data might be subject to measurement error; nevertheless, we used a previously validated FFQ for Spanish populations, and aggregated food group data was corrected using cross‐check questions.33, 34 Nonetheless, it could be expected that questions on timing of eating, for example, “At what time do you usually have supper?” are better recalled than detailed retrospective data on specific foods. However, there are limited population data on timing of eating patterns and on validity of the questions on timing and to this extent the degree of misclassification is unknown. It is unlikely that this misclassification has affected differentially cases and controls particularly since most cases were contacted and interviewed shortly after diagnosis. A further limitation of the study is that variability in meal timing in our population was fairly small and although this does not bias effect estimates it may affect precision. Finally, although the study is not small, confidence intervals for some of the associations particularly in stratified analyses are fairly wide. Findings should be replicated if data are available, in cohort studies.
The implications of these findings refer both to research and to public health. Research on nutrition has focused on quantity, type of foods and also on patterns of diet. There has been minimal research on timing of eating patterns and this has mainly focused on the evaluation of eating restriction during fasting. It is necessary to further evaluate in humans the existing evidence from animal experiments showing that timing of eating has profound implications on metabolism of foods and on health. Public health implications are well recognized as is the lack of evidence based research on several aspects of recommendations of diet,15 for example, the beneficial effect of having breakfast or of having few or many meals during the day. If these findings are confirmed they will have profound implications on recommendations for the timing of the last main meal, particularly for cultures such as those in southern Europe were supper is late.
In conclusion, this is the first study in humans showing that adherence to a more diurnal eating pattern and specifically a long interval between last meal and sleep is associated with a lower cancer risk. The hypothesis we tested is supported by experimental evidence and stresses the importance of evaluating circadian rhythms in studies on diet and cancer.
Supporting information
Supporting Information 1
Acknowledgements
The study sponsors had no role in the design of the study; the collection, analysis, or interpretation of the data; the writing of the manuscript; or the decision to submit the manuscript for publication. ISGlobal is a member of the CERCA Programme, Generalitat de Catalunya.
References
- 1. Bass J. Circadian topology of metabolism. Nature 2012;491:348–56. [DOI] [PubMed] [Google Scholar]
- 2. Scheer FA, Hilton MF, Mantzoros CS, et al. Adverse metabolic and cardiovascular conse‐quences of circadian misalignment. Proc Natl Acad Sci U S A 2009;106:4453–8. [DOI] [PMC free article] [PubMed] [Google Scholar]
- 3. Pan A, Schernhammer ES, Sun Q, et al. Rotating night shift work and risk of type 2 diabetes: two prospective cohort studies in women. PLoS Med 2011;8:e1001141. [DOI] [PMC free article] [PubMed] [Google Scholar]
- 4. IARC . Painting, firefighting and shiftwork. IARC monographs, vol. 98 Lyon: OUP, 2010. 818 p. [PMC free article] [PubMed] [Google Scholar]
- 5. Archer SN, Laing EE, Möller‐Levet CS, et al. Mistimed sleep disrupts circadian regulation of the human transcriptome. Proc Natl Acad Sci U S A 2014;111:E682–91. [DOI] [PMC free article] [PubMed] [Google Scholar]
- 6. Davies SK, Ang JE, Revell VL, et al. Effect of sleep deprivation on the human metabolome. Proc Natl Acad Sci U S A 2014;111:10761–6. [DOI] [PMC free article] [PubMed] [Google Scholar]
- 7. Hansen J. Increased breast cancer risk among women who work predominantly at night. Epidemiology 2001;12:74–7. [DOI] [PubMed] [Google Scholar]
- 8. Schernhammer ES, Laden F, Speizer FE, et al. Rotating night shifts and risk of breast cancer in women participating in the nurses' health study. J Natl Cancer Inst 2001;93:1563–8. [DOI] [PubMed] [Google Scholar]
- 9. Papantoniou K, Castaño‐Vinyals G, Espinosa A, et al. Night shift work, chronotype and prostate cancer risk in the MCC‐Spain case‐control study. Int J Cancer 2015;137:1147–57. [DOI] [PubMed] [Google Scholar]
- 10. Cordina‐Duverger E, Menegaux F, Popa A, et al. Night shift work and breast cancer: a pooled analysis of population‐based case‐control studies with complete work history. Eur J Epidemiol 2018;33:369–79. [DOI] [PubMed] [Google Scholar]
- 11. Travis RC, Balkwill A, Fensom GK, et al. Night shift work and breast cancer incidence: three prospective studies and meta‐analysis of published studies. Jnci J Natl Cancer Inst 2016;108:djw169. [DOI] [PMC free article] [PubMed] [Google Scholar]
- 12. Roenneberg T, Kuehnle T, Juda M, et al. Epidemiology of the human circadian clock. Sleep Med Rev 2007;11:429–38. [DOI] [PubMed] [Google Scholar]
- 13. Erren TC, Groß JV, Fritschi L. Focusing on the biological night: towards an epidemiological measure of circadian disruption. Occup Environ Med. 2017;74:159–60. [DOI] [PubMed] [Google Scholar]
- 14. Arble DM, Bass J, Laposky AD, et al. Circadian timing of food intake contributes to weight gain. Obesity (Silver Spring) 2009;17:2100–2. [DOI] [PMC free article] [PubMed] [Google Scholar]
- 15. Casazza K, Fontaine KR, Astrup A, et al. Myths, presumptions, and facts about obesity. N Engl J Med 2013;368:446–54. [DOI] [PMC free article] [PubMed] [Google Scholar]
- 16. Mattson MP, Allison DB, Fontana L, et al. Meal frequency and timing in health and disease. Proc Natl Acad Sci U S A 2014;111:16647–53. [DOI] [PMC free article] [PubMed] [Google Scholar]
- 17. Schoeller DA, Cella LK, Sinha MK, et al. Entrainment of the diurnal rhythm of plasma leptin to meal timing. J Clin Invest 1997;100:1882–7. [DOI] [PMC free article] [PubMed] [Google Scholar]
- 18. Wehrens SMT, Christou S, Isherwood C, et al. Meal timing regulates the human circadian system. Curr Biol 2017;27:1768–75. [DOI] [PMC free article] [PubMed] [Google Scholar]
- 19. Marinac CR, Sears DD, Natarajan L, et al. Frequency and circadian timing of eating may influence biomarkers of inflammation and insulin resistance associated with breast cancer risk. PLoS One 2015;10:e0136240. [DOI] [PMC free article] [PubMed] [Google Scholar]
- 20. Li XM, Delaunay F, Dulong S, et al. Cancer inhibition through circadian reprogramming of tumor transcriptome with meal timing. Cancer Res 2010;70:3351–60. [DOI] [PubMed] [Google Scholar]
- 21. Hatori M, Vollmers C, Zarrinpar A, et al. Time‐restricted feeding without reducing caloric intake prevents metabolic diseases in mice fed a high‐fat diet. Cell Metab 2012;15:848–60. [DOI] [PMC free article] [PubMed] [Google Scholar]
- 22. Buckland G, Travier N, Cottet V, et al. Adherence to the mediterranean diet and risk of breast cancer in the European prospective investigation into cancer and nutrition cohort study. Int J Cancer 2013;132:2918–27. [DOI] [PubMed] [Google Scholar]
- 23. Romaguera D, Vergnaud AC, Peeters PH, et al. Is concordance with World Cancer Research Fund/American Institute for Cancer Research guidelines for cancer prevention related to subsequent risk of cancer? Results from the EPIC study. Am J Clin Nutr 2012;96:150–63. [DOI] [PubMed] [Google Scholar]
- 24. Castano‐Vinyals G, Aragones N, Perez‐Gomez B, et al. Population‐based multicase–control study in common tumors in Spain (MCC‐Spain): rationale and study design. Gac Sanit 2015;29:308–15. [DOI] [PubMed] [Google Scholar]
- 25. García‐Closas R, García‐Closas M, Kogevinas M, et al. Food, nutrient and heterocyclic amine intake and the risk of bladder cancer. Eur J Cancer 2007;43:1731–40. [DOI] [PubMed] [Google Scholar]
- 26. CESNID . Tablas de Composicion de Alimentos Del CESNID. Barcelona: Ediciones La Universidad Barcelona; McGraw Hill‐Interamericana España S.A, 2008. [Google Scholar]
- 27. Roenneberg T, Wirz‐Justice A, Merrow M. Life between clocks: daily temporal patterns of human chronotypes. J Biol Rhythms 2003;18:80–90. [DOI] [PubMed] [Google Scholar]
- 28. Romaguera D, Gracia‐Lavedan E, Molinuevo A, et al. Adherence to nutrition‐based cancer prevention guidelines and breast, prostate and colorectal cancer risk in the MCC‐Spain case‐control study. Int J Cancer 2017;141:83–93. [DOI] [PubMed] [Google Scholar]
- 29. Ministry of Public Works (Spain) . Atlas of Urban Vulnerability in Spain [Internet]. 2001–2011 Available from: http://atlasvulnerabilidadurbana.fomento.es/#v=map2;l=en [last visited January 2018].
- 30. Garcia‐Saenz A, Sánchez de Miguel A, Espinosa A, et al. Evaluating the association between artificial light‐at‐night exposure and breast and prostate cancer risk in spain (MCC‐Spain Study). Environ Health Perspect 2018;126:047011. [DOI] [PMC free article] [PubMed] [Google Scholar]
- 31. Molzof HE, Wirth MD, Burch JB, et al. The impact of meal timing on cardiometabolic syndrome indicators in shift workers. Chronobiol Int 2017;34:337–48. [DOI] [PMC free article] [PubMed] [Google Scholar]
- 32. WCRF . Cancer preventability estimates for diet, nutrition, body fatness, and physical activity. Available from: http://www.wcrf.org/int/cancer-facts-figures/preventability-estimates/cancer-preventability-estimates-diet-nutrition
- 33. Calvert C, Cade J, Barrett JH, et al. Using cross‐check questions to address the problem of mis‐reporting of specific food groups on Food Frequency Questionnaires. Eur J Clin Nutr 1997;51:708–12. [DOI] [PubMed] [Google Scholar]
- 34. Nöthlings U, Hoffmann K, Boeing H. Do cross‐check questions improve food frequency questionnaire data? Lyon. IARC Sci Publ 2002;156:23–5. [PubMed] [Google Scholar]
Associated Data
This section collects any data citations, data availability statements, or supplementary materials included in this article.
Supplementary Materials
Supporting Information 1