

Abstract
Aim
Hikikomori, a form of severe social withdrawal, is an emerging issue in mental health, for which validated measurement tools are lacking. The object was to develop a self‐report scale of hikikomori, and assess its psychometric properties and diagnostic accuracy.
Methods
A sample of 399 participants from clinical and community settings completed measures. Psychometric properties were assessed with factor analysis; diagnostic accuracy was compared against a semi‐structured diagnostic interview.
Results
The Hikikomori Questionnaire contained 25 items across three subscales representing socialization, isolation, and emotional support. Internal consistency, test–retest reliability, and convergent validity were all satisfactory. The area under the curve was 0.86 (95% confidence interval, 0.80–0.92). A cut‐off score of 42 (out of 100) was associated with a sensitivity of 94%, specificity of 61%, and positive predictive value of 17%.
Conclusion
The 25‐item Hikikomori Questionnaire (HQ‐25) possesses robust psychometric properties and diagnostic accuracy in an initial sample of Japanese adults. Additional research on its psychometric properties and ability to support clinical assessment of hikikomori is warranted.
Keywords: cultural syndrome, diagnosis, mental health, psychometric , social withdrawal, social isolation
During the past few decades, a particular form of severe and prolonged social withdrawal, called hikikomori, has emerged as an issue of clinical, public health, and general societal concern.1 Although a consensus definition has not been established, typically hikikomori is defined as a state of social withdrawal combined with avoidance of major social interactions or responsibilities (e.g., education, employment, and friendships) lasting at least 6 months.2 Initially described in Japan, in the last decade hikikomori has become the source of attention globally,3 with cases described in North America, Europe, and elsewhere in Asia.4, 5, 6 Epidemiologic surveys have suggested a prevalence between 1 and 2%,5, 7 and policy‐makers have expressed concern about the threat to the labor market from hikikomori who inevitably drop out of school or are unable to maintain employment.
Prototypical cases of hikikomori often have their onset in adolescent or young adult men, occur in the context of academic difficulties, troubled family dynamic, and/or other psychosocial stressors, and result in individuals who spend exorbitant amounts of time isolated in their own bedrooms.4 A systematic review of hikikomori noted that it may be an outcome of developmental problems, such as insecure attachment.5 Small case series have suggested that hikikomori frequently have high levels of loneliness and lack of social support received from their social network.8 Major depression or other psychiatric comorbidities are also common, although idiopathic cases occur too.9, 10
In our previous work, we proposed a definition of hikikomori to help standardize research on hikikomori,2 and more recently we updated this working definition.8 One of the next important steps in advancing this emerging area of research is the development of a tool that can be used to assess hikikomori and to measure it consistently across varying populations and settings. To date, two instruments related to hikikomori have been developed. The first one, called the ‘Hikikomori Behavior Checklist,’ is a 45‐item Japanese‐language instrument designed to be completed by a parent about his or her child.11 Each item briefly notes a behavior (e.g., ‘Your family member smiles without reason’) or character description (e.g., ‘Your family member lacks motivation’), accompanied by a 4‐point response scale ranging from definitely untrue to definitely true. The other instrument, called the ‘NEET/Hikikomori Risk Scale,’ was developed with the view that both NEET (‘not in employment education or training’) and hikikomori represent forms of marginalization in society, occupational withdrawal in the former condition and social withdrawal in the latter. The authors developed and validated a 27‐item scale that focuses on work attitudes. In a large‐scale, national Japanese sample, they found a three‐factor structure described as: (i) a freeter lifestyle preference (an intentional decision to perpetually seek low‐skill, part‐time employment); (ii) lack of self‐competence; and (iii) having unclear ambitions for the future.12
In the present study, we aimed to add to this initial literature on psychometric testing of hikikomori. Our primary goal was to develop and evaluate a self‐report instrument that was based on psychosocial characteristics of hikikomori that have been previously described in the medical literature and focused on social (rather than occupational) withdrawal. In addition, we sought to explore accuracy of the tool compared to a clinician‐administered diagnostic interview for hikikomori.
METHODS
Phase 1: Item pool development
We generated an initial list of 59 candidate scale items. Item generation was guided by themes that have been identified in the hikikomori literature, such as lack of social connectedness,2, 4 active social isolation or withdrawal behavior,13 avoidance of social contact,5 and a sense of alienation or marginalization from society.12 Overall, candidate items reflected psychological features and behavioral patterns that have been summarized in reviews of hikikomori. 5 The lead author (A. R. T.) drafted initial item wording, which was then reviewed and revised by consensus among other research team members with expertise in clinical psychology, psychiatry, and hikikomori (H. K., J. E. A., and T. A. K.). Japanese was used for administration of the scale. Negatively worded items were included to reduce acquiescence bias.14 The reference period for scale items (‘over the last 6 months’) was chosen to match the duration of symptoms in our current definition of hikikomori. 2, 15 Response options for all items were: strongly disagree (0), somewhat disagree (1), neither agree nor disagree (2), somewhat agree (3), and strongly agree (4). Individual items were reverse‐scored if indicated, then summed to create a total scale score.
Phase 2: Data collection
Study recruitment occurred in Fukuoka, a major metropolitan area in southern Japan. All participants provided written informed consent and received a gift card incentive worth approximately $18. Study approval was obtained from the institutional review boards at Kyushu University and VA Portland Health Care System.
The study sample (N = 399) consisted of two groups. First, volunteers at Kyushu University (n = 170) were recruited via posters and flyers seeking ‘healthy volunteers.’ Second, patients from nine psychiatric hospitals and clinics affiliated with the Department of Neuropsychiatry of Kyushu University and clients at a community mental health center (n = 229) were recruited during weekly visits by research staff inquiring about interest in participating in a research study. Exclusion criteria included: age <15 or >50 years, inability to understand written Japanese, a self‐reported history of schizophrenia, or severe heart, liver, or kidney disease. Data were collected between February 2014 and December 2016. Participants completed: (i) a semi‐structured diagnostic interview for hikikomori; (ii) the item pool for the hikikomori scale; (iii) a self‐report survey, including sociodemographic items and measures of psychiatric symptoms and psychological constructs; and (iv) a computer‐administered test and blood sample, both used for a separate research study.16 The hikikomori scale item pool was re‐administered to a subsample of participants for evaluation of test–retest reliability.
The semi‐structured diagnostic interview for hikikomori was based on our prior theoretical work2 and empirical research,8, 9 and it was administered by a clinical psychologist or psychiatrist. Interviewers were unaware of participants’ responses on the questionnaire containing candidate scale items. In brief, participants who met the case definition of hikikomori endorsed ‘yes’ with a duration of at least 6 months to the following questions: ‘Currently do you spend most of your time at home?’ and ‘Currently do you avoid nearly all social situations?’ In addition, individuals with hikikomori endorsed distress associated with these symptoms, or had significant functional impairment associated with their social withdrawal as rated by the study clinician. Finally, when physical or medical etiology for the social withdrawal symptoms was apparent (e.g., pregnancy), individuals were excluded from a hikikomori diagnosis.
Three measures were used to assess convergent validity:
The Revised University of California, Los Angeles (R‐UCLA) Loneliness Scale is a 20‐item self‐report assessment of one's degree of loneliness.17, 18 Respondents indicate how often they feel the way described in each statement, ranging from 1 (never) to 4 (often) with a higher score indicating more loneliness. The reliability and validity of the measure have been established for both the English and Japanese versions.17, 19
The Preference for Solitude Scale is a 12‐question self‐report instrument assessing one's preference for solitude.20 For each question, respondents are given two statements and then asked to choose which best describes them, with a higher score indicating a stronger preference for solitude. We developed a Japanese version of this scale by using independent translation by two bilingual master's level mental health clinicians (nurse practitioner and clinical psychologist), followed by resolution of translation discrepancies by meetings and final adjudication by a third bilingual psychiatrist.
The Multidimensional Scale of Perceived Social Support is a 12‐item self‐report instrument designed to measure the perceived adequacy of support from family, friends, and significant others. Respondents rate items on a 7‐point Likert‐type scale ranging from 1 (very strongly disagree) to 7 (very strongly agree) with a higher score indicating more social support. The reliability and validity of both the English and the Japanese versions of the measure have been established.21, 22
Phase 3: Statistical analysis
We initially screened items for variability, violation of normality assumptions (skewness or kurtosis exceeding ±2.0), and poor reliability (item‐to‐total correlations < 0.50). No items were removed based on these criteria. Next, we conducted exploratory factor analysis with Promax rotation. Cattell's scree test and eigenvalues were used to determine the number of factors. Scale items were removed if they met any one of the following four criteria: (i) items that were a factor all by themselves; (ii) items that did not load onto any factor (factor loading < 0.5); (iii) items that loaded positively onto one factor but also had a large negative correlation on a separate factor (factor loading < −0.4); or (iv) items that loaded relatively equally onto two factors. For remaining scale items, we calculated internal consistency using Cronbach's alpha. To assess convergent validity, we calculated correlation coefficients between the hikikomori scale score and other scale measures. When scale scores were skewed, we log‐transformed for correlational analyses. Mean substitution was used for handling missing data for scales missing ≤50% data.
We evaluated the diagnostic accuracy of the hikikomori scale across multiple cut‐off scores using multiple measures: sensitivity (percentage of actual hikikomori cases correctly identified), specificity (percentage of cases without hikikomori correctly identified), positive likelihood ratio (LR+, ratio of true positives to false positives), negative likelihood ratio (LR–, ratio of true negatives to false negatives), positive predictive value (PPV, probability of a positive test result being a true positive), negative predictive value (NPV, probability of negative test result being a true negative), and area under the receiver–operator curve (ROC). In order to calculate PPV and NPV, we assumed a sample prevalence of hikikomori of 8%. In this case, the area under the ROC (AUC) represents the probability that a randomly selected participant would be correctly classified as being with or without hikikomori, with a value of 0.5 representing accuracy no better than chance and greater than 0.8 generally considered excellent.23 Statistical analyses were conducted in Stata, Version 14 (StataCorp, College Station, TX, USA).
RESULTS
Factor structure and reliability
The scree plot (Fig. 1) demonstrated a three‐factor structure (eigenvalues of 23.08, 2.56, and 1.66, with remaining eigenvalues below 1.5). Together the factors accounted for 46.53% of the variance. In terms of the internal reliability of the scale, Cronbach's alpha coefficient for the whole scale was 0.96; and for the three subscales (i.e., factors) it was 0.94, 0.91, and 0.88, respectively. Among the subsample (n = 121) who completed the questionnaire at baseline and the 1‐month follow up, test–retest reliability results showed a correlation of 0.92 (P < 0.001).
Figure 1.
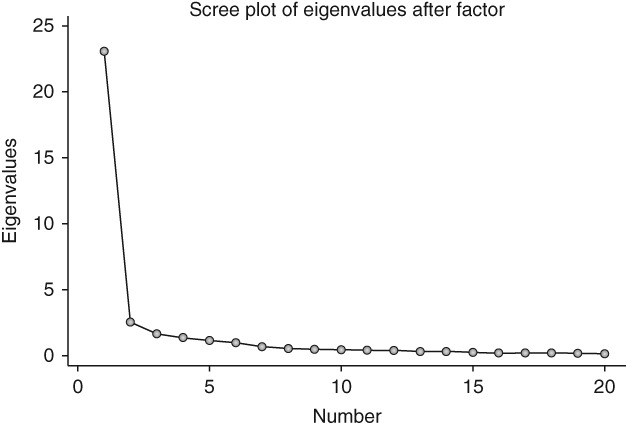
Rotated scree plot indicating a three‐factor structure to the 25‐item Hikikomori Questionnaire.
After factor analysis, the final version of the scale consisted of 25 items, leading us to name the instrument the ‘25‐item Hikikomori Questionnaire’ (HQ‐25). The first factor addressed socialization (11 items), the second factor isolation (eight items), and the third factor emotional support (six items). Rotated factor loadings for the items are presented in Table 1.
Table 1.
Factor loadings for the 25 items included in the Hikikomori Questionnaire
| Item text | Factor 1 | Factor 2 | Factor 3 |
|---|---|---|---|
| Factor 1: Socialization (α = 0.94) | |||
| I stay away from other people. | 0.58 | ||
| I love meeting new people.† | 0.74 | ||
| People bother me. | 0.68 | ||
| I feel uncomfortable around other people. | 0.71 | ||
| I do not like to be seen by others. | 0.59 | ||
| It is hard for me to join in on groups. | 0.74 | ||
| I enjoy being in social situations.† | 0.76 | ||
| I avoid talking with other people. | 0.73 | ||
| I much prefer to be alone than with others. | 0.68 | ||
| I strongly prefer to be around other people.† | 0.74 | ||
| I do not enjoy social interactions. | 0.64 | ||
| Factor 2: Isolation (α = 0.88) | |||
| I spend most of my time at home. | 0.68 | ||
| I shut myself in my room. | 0.50 | ||
| I spend most of my time alone. | 0.73 | ||
| I rarely meet people in‐person. | 0.63 | ||
| I do not live by society's rules and values. | 0.45 | ||
| I have little contact with other people talking, writing, and so on. | 0.51 | ||
| I rarely spend time alone. | 0.54 | ||
| I spend very little time interacting with other people. | 0.55 | ||
| Factor 3: Emotional Support (α = 0.89) | |||
| There really is not anyone with whom I can discuss matters of importance. | 0.76 | ||
| There are people in my life who try to understand me.† | 0.63 | ||
| I can share my personal thoughts with several people.† | 0.63 | ||
| There are few people I can discuss important issues with. | 0.62 | ||
| There really is not anyone very significant in my life. | 0.55 | ||
| I have someone I can trust with my problems.† | 0.85 | ||
All items were rated on a scale ranging from 0 (strongly disagree) to 4 (strongly agree).
Descriptive characteristics
Participants (N = 399) had a mean age (SD) of 32 years (9.8), while 50.5% (201) were men and 33.3% (133) lived alone. Their mean total score on the HQ‐25 was 41.49 (SD = 22.32, with an observed range of 1 to 98) in comparison to a possible score range of 0 to 100. A detailed description of individual scale item score means, SD, skew, and kurtosis is presented in Table S1.
Convergent validity
The HQ‐25 demonstrated convergent validity with both the R‐UCLA Loneliness Scale (r = 0.88, P < 0.0001) and the Preference for Solitude Scale (r = 0.73, P < 0.0001). In addition, it showed high inverse correlation with the Multidimensional Scale of Perceived Social Support (r = −0.81, P < 0.0001).
Diagnostic accuracy
The overall diagnostic accuracy of the HQ‐25, measured as the AUC and shown in Figure 2, was 0.86 (95% confidence interval, 0.80–0.91). To determine a potential cut‐off score for the HQ‐25 to categorize individuals as ‘at risk’ versus ‘not at risk’ for hikikomori, we examined diagnostic characteristics at each possible cut‐off score, compared with our semi‐structured diagnostic interview. Full results are presented in Table S2, with more abbreviated information in Table 2. Using a cut‐off score of 42 (out of a possible 100 points) revealed a sensitivity of 94%, specificity of 61%, PPV of 17%, and LR+ of 2.37. Increasing cut‐off to 43 reduced sensitivity to 87% without significant gains in PPV or LR+.
Figure 2.
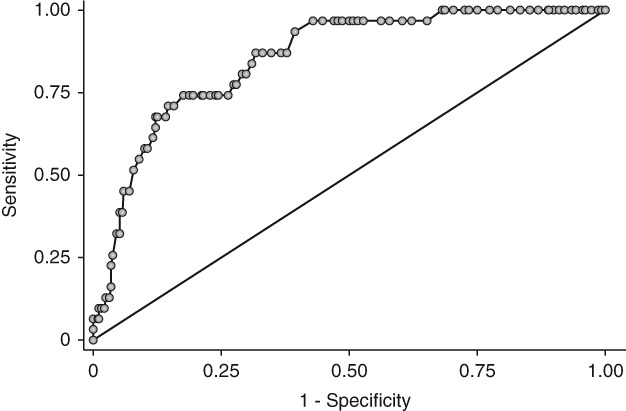
Receiver–operator curve (ROC) showing accuracy of the 25‐item Hikikomori Questionnaire for identifying individuals with hikikomori (N = 385). Area under the ROC = 0.8550.
Table 2.
Diagnostic characteristics of the 25‐item Hikikomori Questionnaire across selected cut‐off scores
| Cut‐off score | Sensitivity | 95%CI | Specificity | 95%CI | LR+ | 95%CI | LR– | 95%CI | PPV | 95%CI | NPV | 95%CI |
|---|---|---|---|---|---|---|---|---|---|---|---|---|
| ≥10 | 100.00% | 88.80%–100.00% | 5.71% | 3.57%–8.59% | 1.06 | 1.03–1.09 | 0.00 | NA | 0.08 | 0.83–0.86 | 1.00 | NA |
| ≥20 | 100.00% | 88.80%–100.00% | 18.48% | 14.60%–22.80% | 1.23 | 1.17–1.29 | 0.00 | NA | 0.10 | 0.92–0.10 | 1.00 | NA |
| ≥30 | 96.77% | 83.30%–99.90% | 37.77% | 32.80%–42.90% | 1.56 | 1.40–1.72 | 0.09 | 0.01–0.59 | 0.12 | 0.11–0.13 | 0.99 | 0.95–1.00 |
| ≥40 | 96.77% | 83.30%–99.90% | 52.99% | 47.70%–58.20% | 2.06 | 1.81–2.34 | 0.06 | 0.01–0.42 | 0.15 | 0.14–0.17 | 0.99 | 0.97–1.00 |
| ≥50 | 80.65% | 62.50%–92.50% | 70.92% | 66.00%–75.50% | 2.77 | 2.19–3.51 | 0.27 | 0.13–0.56 | 0.19 | 0.16–0.23 | 0.98 | 0.95–0.99 |
| ≥60 | 74.19% | 55.40%–88.10% | 81.25% | 76.09%–85.10% | 3.96 | 2.94–5.33 | 0.32 | 0.18–0.58 | 0.26 | 0.20–0.32 | 0.97 | 0.95–0.99 |
| ≥70 | 58.06% | 39.10%–75.50% | 89.40% | 85.80%–92.40% | 5.48 | 3.59–8.35 | 0.47 | 0.31–0.71 | 0.32 | 0.24–0.42 | 0.96 | 0.94–0.97 |
| ≥80 | 32.26% | 16.70%–51.40% | 95.38% | 92.70%–97.30% | 6.98 | 3.50–13.90 | 0.71 | 0.56–0.91 | 0.38 | 0.23–0.55 | 0.94 | 0.93–0.95 |
| ≥91 | 9.68% | 2.04%–25.80% | 98.37% | 96.50%–99.40% | 5.94 | 1.56–22.60 | 0.92 | 0.82–1.03 | 0.34 | 0.12–0.66 | 0.93 | 0.92–0.93 |
CI, confidence interval; LR, likelihood ratio; NA, not applicable; NPV, negative predictive value; PPV, positive predictive value.
DISCUSSION
This paper introduces the HQ‐25, a novel self‐administered instrument for assessing hikikomori. The HQ‐25 is theoretically grounded and straightforward to use, with a convenient and memorable score range of 0–100. In terms of psychometric properties, this study demonstrates initial evidence of internal reliability, test–retest reliability, and convergent validity for the HQ‐25. In terms of preliminary diagnostic accuracy of the HQ‐25, the AUC fell into the range (0.8–0.9) considered excellent,23 and sensitivity and PPV, though not specificity, are comparable to common cut‐off scores on the 9‐item Patient Health Questionnaire to screen for major depression.24, 25 The sample used to develop this scale, predominantly psychiatric patients in Japan, is relatively consistent with the intended real‐world application of the scale, which is a striking contrast with many psychological measures that are developed in homogenous populations of Western college students (the so‐called ‘WEIRD’ phenomenon).26 This study also significantly extends prior work developing instruments for social withdrawal by including comparison to a proposed reference standard for hikikomori; one limitation in prior research has been lack of inclusion and verification of individuals with hikikomori. 11, 12 Taken together, our results suggest that the HQ‐25 is worthy of additional psychometric research and also has potential for application in hikikomori clinical research settings.
There is great need for tools that can assist with evaluation and detection of hikikomori in Japan. The number of affected individuals receiving treatment is not known. However, given population surveys that have suggested upwards of 500 000 among adults below age 40 years, one‐third of whom have been isolated for 7 or more years,27 it is highly likely that many are not engaged in care. Further development and testing of the HQ‐25 may provide a tool to help identify hikikomori for participation in research studies. The HQ‐25 could help in other ways too. For example, deficits in emotional support and socialization, which could be indicated by results on the eponymous HQ‐25 subscales, can be targeted in psychotherapy, which is a preferred treatment modality for patients with hikikomori. 8
Finally, it is worth noting that a full version of the HQ‐25 is freely available, which is presented in Table 3, with the Japanese version in Table S3. Too often, we believe, clinical and research scales are copyrighted or otherwise inaccessible. (Of note, Japanese was used for administration of the scale. However, to facilitate broader evaluation and use in other populations, we present an English version. This was developed using independent translation by two bilingual individuals with backgrounds in clinical psychology, with adjudication of discrepancies by the authors, T. A. K. and A. R. T.)
Table 3.
Hikikomori Questionnaire (HQ‐25): English Version
| Over the last 6 months, how accurately do the following statements describe you? | ||||||
|---|---|---|---|---|---|---|
| Strongly disagree | Somewhat disagree | Neither agree nor disagree | Somewhat agree | Strongly agree | ||
| 1 | I stay away from other people. | 0 | 1 | 2 | 3 | 4 |
| 2 | I spend most of my time at home. | 0 | 1 | 2 | 3 | 4 |
| 3 | There really isn't anyone with whom I can discuss matters of importance. | 0 | 1 | 2 | 3 | 4 |
| 4† | I love meeting new people. | 0 | 1 | 2 | 3 | 4 |
| 5 | I shut myself in my room. | 0 | 1 | 2 | 3 | 4 |
| 6 | People bother me. | 0 | 1 | 2 | 3 | 4 |
| 7† | There are people in my life who try to understand me. | 0 | 1 | 2 | 3 | 4 |
| 8 | I feel uncomfortable around other people. | 0 | 1 | 2 | 3 | 4 |
| 9 | I spend most of my time alone. | 0 | 1 | 2 | 3 | 4 |
| 10† | I can share my personal thoughts with several people. | 0 | 1 | 2 | 3 | 4 |
| 11 | I don't like to be seen by others. | 0 | 1 | 2 | 3 | 4 |
| 12 | I rarely meet people in‐person. | 0 | 1 | 2 | 3 | 4 |
| 13 | It is hard for me to join in on groups. | 0 | 1 | 2 | 3 | 4 |
| 14 | There are few people I can discuss important issues with. | 0 | 1 | 2 | 3 | 4 |
| 15† | I enjoy being in social situations. | 0 | 1 | 2 | 3 | 4 |
| 16 | I do not live by society's rules and values. | 0 | 1 | 2 | 3 | 4 |
| 17 | There really isn't anyone very significant in my life. | 0 | 1 | 2 | 3 | 4 |
| 18 | I avoid talking with other people. | 0 | 1 | 2 | 3 | 4 |
| 19 | I have little contact with other people talking, writing, and so on. | 0 | 1 | 2 | 3 | 4 |
| 20 | I much prefer to be alone than with others. | 0 | 1 | 2 | 3 | 4 |
| 21† | I have someone I can trust with my problems. | 0 | 1 | 2 | 3 | 4 |
| 22 | I rarely spend time alone. | 0 | 1 | 2 | 3 | 4 |
| 23 | I don't enjoy social interactions. | 0 | 1 | 2 | 3 | 4 |
| 24 | I spend very little time interacting with other people. | 0 | 1 | 2 | 3 | 4 |
| 25† | I strongly prefer to be around other people. | 0 | 1 | 2 | 3 | 4 |
The HQ‐25 has a theoretical score range of 0–100.
Item was reverse‐scored.
Limitations and future directions
As the first study of the HQ‐25, there are several potential directions for future research that could address this study's limitations. First, we did not conduct confirmatory factor analysis, which implies the stability and replicability of the factor structure (socialization, isolation, and emotional support) is not clear. Second, our sample was a mixture of a clinical population and healthy subjects in one region in Japan, and therefore may not be representative of Japan as a whole. Further, because test characteristics are influenced by the underlying sample tested, additional evaluation outside of Japanese populations is vital to further determine generalizability of the psychometric properties and diagnostic accuracy of the HQ‐25. For subsequent research, we would also suggest evaluation of the HQ‐25 in younger populations, which could include psychiatric clinics evaluating adolescents and middle/high schools. These settings may be ideal for screening as they match ages typical for the onset of hikikomori. Third, although we used the most rigorous available reference standard for hikikomori, a consensus gold standard test for hikikomori does not yet exist.
A final consideration for additional work is examining the potential clinical applications of the HQ‐25. Although we have proffered one potential cut‐off score for the HQ‐25, selecting an optimal cut‐off score is a combination of science and art, and should vary according to the setting in which the scale is being used. For settings where ruling‐in hikikomori is more useful, a higher cut‐off score characterized by higher specificity and LR+ would be warranted.8 Also, we were unable to examine potential risks of using the HQ‐25 as a diagnostic tool. Because a substantial number of false‐positives is expected to occur with use of our scale, additional work is needed to determine potential harms from screening for hikikomori (e.g., psychological distress or overtreatment).
Future research could also address issues as to whether the HQ‐25 might be simplified or otherwise revised. Many of these approaches have previously been succinctly summarized,24 and here we suggest a few. For screening purposes, a shorter scale is desirable. It is possible that a briefer scale limited to just the 11 items on socialization would suffice because this (first) factor explained the largest portion of the variance. Prospective studies examining sensitivity to change in score would be useful for treatment monitoring of hikikomori. Elimination of reverse‐scored items and attempts to further reduce the number of scale items would improve the practicality of the instrument. Ability to assess severity of hikikomori and adaption of the HQ‐25 into other languages are also desirable.
Conclusions
The HQ‐25 is a self‐report instrument with novel potential for assisting with evaluation of a relatively new mental health issue. As concern about social withdrawal heightens, particularly in economically developed parts of the Western and Eastern world, this scale offers an important new tool in the ability to study and better understand individuals at risk for hikikomori.
DISCLOSURE STATEMENT
The authors declare that they have no conflicts of interest.
AUTHOR CONTRIBUTIONS
A.R.T.: study design; literature search; data analysis; data interpretation; writing. J.I.C.: figures; data analysis; data interpretation; writing. H.K.: data collection; data analysis. R.K.: data collection; data analysis. M.S.‐K.: data collection. N.S.: data collection. K.H.: data collection. W.U.‐N.: data collection. J.E.A.: data interpretation. S.K.: data interpretation. T.A.K.: study design; data interpretation; writing.
Supporting information
Table S1. Descriptive Characteristics of Items in the Hikikomori Questionnaire (HQ‐25).
Table S2. Diagnostic Characteristics of the Hikikomori Questionnaire (HQ‐25) Across All Possible Cut‐off Scores.
Table S3. Hikikomori Questionnaire (HQ‐25): Japanese Version.
ACKNOWLEDGMENTS
We thank Dr Koji Tanaka, Dr Akifumi Inuo, Dr Nobuki Kuwano, Dr Keita Kurahara, Ms Sakumi Kakimoto, Ms Yoko Zushi, and Ms Satomi Nagai for assistance with data collection in the clinical sample and data entry. Drs Teo and Chen are supported by the Department of Veterans Affairs, and the views expressed in this article are those of the authors and do not necessarily reflect the position or policy of the Department of Veterans Affairs or the United States government. This work was supported in part by grants from the: Japan Society for the Promotion of Science (JSPS) Bilateral Joint Research Project between Japan–USA (to Drs Kato and Teo); Japanese Ministry of Education, Culture, Sports, Science, and Technology Innovative Areas ‘Will Dynamics’ (JP16H06403 to Dr Kato); Pfizer Health Research Foundation Japan (to Drs Kato and Teo); Japan Agency for Medical Research and Development (AMED) (Syogaisya‐Taisaku‐Sogo‐Kenkyu‐Kaihatsu‐Jigyo JP17dk0307047 & JP18dk0307073 & JP18dk0307075 to Drs Kato and Kanba; Yugo‐No JP18dm0107095 to Dr Kato); JSPS Kakenhi (JP15K15431 to Dr Kato); Young Principal Investigators’ Research Grant of the Innovation Center for Medical Redox Navigation, Kyushu University (to Dr Kato); and the Senshin Medical Research Foundation (to Drs Kato and Kanba). The funders did not have any role in the study design, collection, analysis, and interpretation of the data, nor in the writing of the report and the decision to submit the paper for publication. Drs Teo and Kato, the corresponding authors, had full access to the data in the study and had final responsibility for the decision to submit for publication.
Contributor Information
Alan R. Teo, Email: teoa@ohsu.edu.
Takahiro A. Kato, Email: takahiro@npsych.med.kyushu-u.ac.jp.
REFERENCES
- 1. Kato TA, Kanbda S, Teo AR. Hikikomori: Experience in Japan and international relevance. World Psychiatry 2018; 17: 105–106. [DOI] [PMC free article] [PubMed] [Google Scholar]
- 2. Teo AR, Gaw AC. Hikikomori, a Japanese culture‐bound syndrome of social withdrawal? J. Nerv. Ment. Dis. 2018; 198: 444–449. [DOI] [PMC free article] [PubMed] [Google Scholar]
- 3. Kato TA, Shinfuku N, Sartorius N, Kanba S. Are Japan's hikikomori and depression in young people spreading abroad? Lancet 2011; 378: 17–23. [DOI] [PubMed] [Google Scholar]
- 4. Teo AR. A new form of social withdrawal in Japan: A review of Hikikomori. Int. J. Soc. Psychiatry 2010; 56: 178–185. [DOI] [PMC free article] [PubMed] [Google Scholar]
- 5. Li TM, Wong PW. Youth social withdrawal behavior (hikikomori): A systematic review of qualitative and quantitative studies. Aust. N. Z. J. Psychiatry 2015; 49: 595–609. [DOI] [PubMed] [Google Scholar]
- 6. Kato TA, Tateno M, Shinfuku N et al Does the ‘hikikomori’ syndrome of social withdrawal exist outside Japan? A preliminary international investigation. Soc. Psychiatry Psychiatr. Epidemiol. 2012; 47: 1061–1075. [DOI] [PMC free article] [PubMed] [Google Scholar]
- 7. Koyama A, Miyake Y, Kawakami N, Tsuchiya M, Tachimori H, Takeshima T. Lifetime prevalence, psychiatric comorbidity and demographic correlates of “hikikomori” in a community population in Japan. Psychiatry Res. 2010; 176: 69–74. [DOI] [PubMed] [Google Scholar]
- 8. Teo AR, Fetters MD, Stufflebam K et al Identification of the hikikomori syndrome of social withdrawal: Psychosocial features and treatment preferences in four countries. Int. J. Soc. Psychiatry 2015; 61: 64–72. [DOI] [PMC free article] [PubMed] [Google Scholar]
- 9. Teo AR, Stufflebam K, Saha S et al Psychopathology associated with social withdrawal: Idiopathic and comorbid presentations. Psychiatry Res. 2015; 228: 182–183. [DOI] [PubMed] [Google Scholar]
- 10. Kato T, Kanba S. Modern‐type depression as an “adjustment” disorder in Japan: The intersection of collectivistic society encountering an individualistic performance‐based system. Am. J. Psychiatry 2017; 174: 1051–1053. [DOI] [PubMed] [Google Scholar]
- 11. Sakai M, Ishikawa S, Sato H, Sakano Y. Development of Hikikomori Behavior Checklist (HBCL) and examination of its reliability and validity. Jpn. J. Couns. Sci. 2004; 37: 210–220. [Google Scholar]
- 12. Uchida Y, Norasakkunkit V. The NEET and Hikikomori spectrum: Assessing the risks and consequences of becoming culturally marginalized. Front. Psychol. 2015; 6: 1117–1128. [DOI] [PMC free article] [PubMed] [Google Scholar]
- 13. Kondo N, Sakai M, Kuroda Y, Kiyota Y, Kitabata Y, Kurosawa M. General condition of hikikomori (prolonged social withdrawal) in Japan: Psychiatric diagnosis and outcome in mental health welfare centers. Int. J. Soc. Psychiatry 2013; 59: 79–86. [DOI] [PubMed] [Google Scholar]
- 14. Guyatt GH, Cook DJ, King D, Norman GR, Kane SL, van Ineveld C. Effect of the framing of questionnaire items regarding satisfaction with training on residents’ responses. Acad. Med. 1999; 74: 192–194. [DOI] [PubMed] [Google Scholar]
- 15. Teo AR, Fetters MD, Stufflebam K et al A cross‐national study of social withdrawal: Identification, diagnosis, and psychosocial features of Hikikomori in four countries. Asia‐Pac. Psychiatry 2015; 7: 19. [Google Scholar]
- 16. Hayakawa K, Kato TA, Watabe M et al Blood biomarkers of Hikikomori, a severe social withdrawal syndrome. Sci. Rep. 2018; 8: 2884. [DOI] [PMC free article] [PubMed] [Google Scholar]
- 17. Russell D, Peplau LA, Ferguson ML. Developing a measure of loneliness. J. Pers. Assess. 1978; 42: 290–294. [DOI] [PubMed] [Google Scholar]
- 18. Schumaker JF, Shea JD, Monfries MM, Groth‐Marnat G. Loneliness and life satisfaction in Japan and Australia. J. Psychol. 1993; 127: 65–71. [DOI] [PubMed] [Google Scholar]
- 19. Kudoh T, Nishikawa M. A study of the feeling of loneliness: I. The reliability and validity of the revised UCLA Loneliness Scale. Jpn. J. Exp. Soc. Psychol. 1983; 22: 99–108. [Google Scholar]
- 20. Burger J. Individual differences in preference for solitude. J. Res. Personal. 1995; 29: 85–108. [Google Scholar]
- 21. Zimet GD, Dahlem NW, Zimet SG, Farley GK. The multidimensional scale of perceived social support. J. Pers. Assess. 1988; 52: 30–41. [DOI] [PubMed] [Google Scholar]
- 22. Iwasa H, Gondo Y, Masui Y et al Development of a Japanese version of multidimensional scale of perceived social support, and examination of its validity and reliability. J. Health Welf. Stat. 2007; 54: 26–33. [Google Scholar]
- 23. Hosmer D, Stanley L. Applied Logistic Regression, 2nd edn. John Wiley & Sons, New York, 2000. [Google Scholar]
- 24. Arroll B, Goodyear‐Smith F, Crengle S et al Validation of PHQ‐2 and PHQ‐9 to screen for major depression in the primary care population. Ann. Fam. Med. 2010; 8: 348–353. [DOI] [PMC free article] [PubMed] [Google Scholar]
- 25. Kroenke K, Spitzer RL, Williams JB. The PHQ‐9: Validity of a brief depression severity measure. J. Gen. Intern. Med. 2001; 16: 606–613. [DOI] [PMC free article] [PubMed] [Google Scholar]
- 26. Henrich J, Heine SJ, Norenzayan A. The weirdest people in the world? Behav. Brain Sci. 2010; 33: 61–83. [DOI] [PubMed] [Google Scholar]
- 27. Jiji K. Japan's first nationwide survey of middle‐aged hikikomori in the pipeline. Japan Times. 2018. [Cited 1 March 2018.] Available from URL: https://www.japantimes.co.jp/news/2018/01/07/national/japans-first-nationwide-survey-middle-aged-hikikomori-pipeline/#.Wpg6QU2WyUm
Associated Data
This section collects any data citations, data availability statements, or supplementary materials included in this article.
Supplementary Materials
Table S1. Descriptive Characteristics of Items in the Hikikomori Questionnaire (HQ‐25).
Table S2. Diagnostic Characteristics of the Hikikomori Questionnaire (HQ‐25) Across All Possible Cut‐off Scores.
Table S3. Hikikomori Questionnaire (HQ‐25): Japanese Version.