Abstract
Chronic hepatitis B virus (HBV) infection remains the most common risk factor for hepatocellular carcinoma (HCC). High HBV surface antigen (HBsAg) levels are highly correlated with hepatocarcinogenesis and HBV‐associated HCC development. However, the role and detailed mechanisms associated with HBsAg in HCC development remain elusive. In this study, we designed specific single guide RNAs (sgRNAs) targeting the open reading frames, preS1/preS2/S, of the HBV genome and established HBsAg knockout HCC cell lines using the CRISPR/Cas9 system. We showed that knockout of HBsAg in HCC cell lines decreased HBsAg expression and significantly attenuated HCC proliferation in vitro, as well as tumorigenicity in vivo. We also found that overexpression of HBsAg, including the large (LHBs), middle (MHBs), and small (SHBs) surface proteins promoted proliferation and tumor formation in HCC cells. Moreover, we demonstrated that knockout of HBsAg in HCC cells decreased interleukin (IL)‐6 production and inhibited signal transducer and activator of transcription 3 (STAT3) signaling, while overexpression of HBsAg induced a substantial accumulation of pY‐STAT3. Collectively, these results highlighted the tumorigenic role of HBsAg and implied that the IL‐6‐STAT3 pathway may be implicated in the HBsAg‐mediated malignant potential of HBV‐associated HCC.
Keywords: CRISPR/Cas9, HBsAg, HBV, HCC, IL‐6, tumorigenicity
1. INTRODUCTION
Hepatocellular carcinoma (HCC) is one of the most common causes of cancer‐related mortality worldwide with rising incidence in the past decades.1 Chronic hepatitis B virus (HBV) infection, among the many etiological risk factors that are associated with HCC, has been recognized as a major risk factor for the development of HCC, as approximately 30‐40% carriers eventually develop HCC.2 In fact, approximately half of the total liver cancer mortality has been attributed to HBV infection.3 Therefore, HBV‐related HCC (HBV‐HCC) is a considerable worldwide problem for human health, especially in China.4
HBV consists of a relaxed circular partially double‐stranded DNA (rcDNA) of approximately 3200 nucleotides and encodes for four overlapping open reading frames (ORFs), including preS1/preS2/S, preCore/Core, X, and Pol.5 Although several factors have been proposed to explain HBV‐HCC, including integration of viral DNA within the host genome in tumors and tumor‐derived cell lines, inflammation, regeneration, chromosomal instability, and insertional mutagenesis caused by viral integration,6 the underlying molecular mechanism by which HBV mediates HCC development remains to be further elucidated. Emerging evidences show that several HBV gene products have been identified as viral oncoproteins. The viral protein HBx may exert effects on cell cycle, cell growth, and HCC metastasis by interfering with cell signaling and gene transcription.7, 8, 9 The expression of hepatitis B e antigen (HBeAg) contributes to the progress of HCC,10 and its role as a marker of active viral replication is associated with poor patient prognosis of HBV‐HCC.10 The HBV core protein has the potency to regulate host gene expression, such as hFGL211 and p53,12 and therefore affects the biological activities of hepatocytes.
The preS1/preS2/S ORF encodes the three different, structurally related viral surface antigens by differential initiation of translation at each of the three in‐frame initiation codons (preS1/preS2/S). Here, there are three HBV envelope glycoproteins collectively known as HBV surface antigen (HBsAg), including the large (LHBs), middle (MHBs), and small (SHBs) surface proteins.13 It has been shown that hepatocarcinogenesis is associated with high HBsAg levels in patients,14 and patients with spontaneous HBV DNA clearance and residual HBsAg titers >1000 IU/mL display increased HCC risk.15 Furthermore, the critical indirect roles of LHBs during malignant transformation in transgenic mice have been observed previously.16 In addition, a number of experimental and clinical studies have provided evidence on the potential role of HBV surface proteins, HBV large surface proteins, and preS1/2 mutants in the pathogenesis and development of HCC.5, 17, 18 However, these previous studies did not include loss‐of function analyses of HBsAg, because complete elimination of HBV from the body is not possible with the current therapy principles, because viral DNA is an integral part of the DNA in liver cells. Recently, the CRISPR/Cas9 system has been successfully applied not only for genome editing in cells, but also for disrupting the genome of virus, including adenovirus, herpes simplex virus, and human immunodeficiency virus.19, 20 A number of experimental systems provide a clear proof that this approach has the potential to disrupt the HBV genome and inhibit viral replication, thereby contributing to the development of novel therapeutic strategies aiming to cure HBV infection.21, 22, 23 Thus, it is necessary to design specific guide RNAs (gRNAs) for HBV preS1/preS2/S ORF to elucidate the precise role of HBsAg and its underlying mechanism in hepatocarcinogenesis. Furthermore, targeting HBsAg using the CRISPR/Cas9 system may open up new avenues for anti‐cancer therapeutic strategies for HBV‐HCC.
In the present study, we designed specific single guide RNAs (sgRNAs), and for the first time established HBsAg knockout HCC cell lines by using CRISPR/Cas9 system‐mediated genetic engineering. We validated the specific cleavage and demonstrated that HBsAg knockout HCC cell lines showed significantly impaired HBsAg release, as analyzed by immunofluorescence and enzyme‐linked immunosorbent assay (ELISA). Functional studies showed that HBsAg knockout inhibited the proliferation and growth rate of xenograft HCC tumors, while overexpression of HBsAg promoted HCC growth. We also investigated the mechanisms underlying the tumor‐promoting effect of HBsAg.
2. RESULTS
2.1. Establishment of HBsAg knockout HCC cell lines
To generate HBsAg knockout HBV‐positive HCC cell lines, we first analyzed sequences in the viral genome (preS1/preS2/S ORF) to identify sgRNA and CRISPR associated protein 9 (Cas9) target sequences plus proto‐spacer adjacent motifs. Regions targeted by Cas9n via gRNA specific to preS1, preS2, and S sequences are shown in Figure 1A and S1A‐F. Subsequently, after identifying potential gRNA target sequences, an SSA (single‐strand annealing) reporter system for detecting Cas9n nuclease activity on HBV S target sequences was used to examine the efficiency of each gRNA. As shown in Figure 1B, the results suggest that sequences in the HBV S gene can be recognized and targeted in human HCC cells by sgRNAs. To more directly detect Cas9n‐mediated mutagenesis of HBV‐derived target sequences, we performed an assay with T7 endonuclease I (T7EI), which detects Cas9‐induced mutations by cutting the DNA at mismatched nucleotides.24, 25 Following the T7EI assay, smaller sized products, indicating the presence of mismatched DNA in the target sequence, were present in cell samples stably transfected with the Cas9n/sgRNA expression plasmids (Figure 1C). Next, to examine the efficiency of sgRNA in the suppression of HBsAg expression, immunofluorescence staining of HBsAg was performed and HBsAg levels in the culture supernatants were detected. With noticeable variation of efficacy, gRNAs targeting the preS1 region (sgR‐1) and preS2 region (sgR‐3) exhibited higher HBsAg‐suppressing efficiency than gRNAs targeting the S region (sgR‐6) (Figures 1D and 1E). Taken together, these data demonstrated that the Cas9n/sgRNA system can successfully target and knockout HBV preS1/preS2/S ORF sequences that are stably integrated into the host cell genome, thereby reducing HBsAg levels in HCC cell lines.
Figure 1.
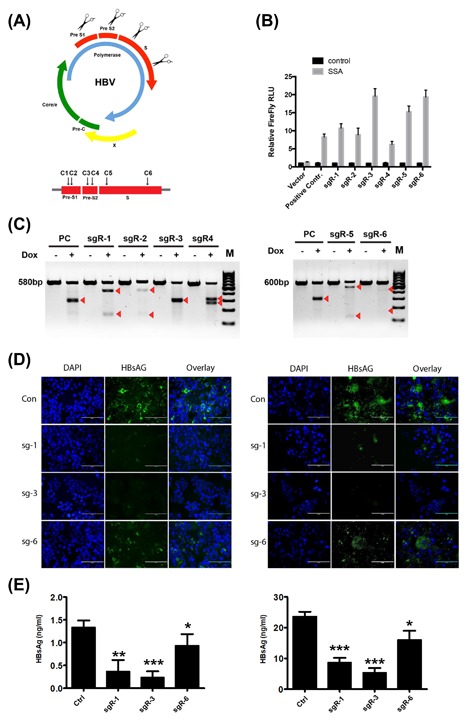
Establishment of hepatitis B virus (HBV) surface antigen (HBsAg) knockout in HBV‐positive HCC cell lines. (A) Schematic diagram of the gRNA‐targeted sequences located in the preS1/preS2/S ORF of the HBV genome. (B) The SSA (single‐strand annealing) reporter system sgR‐Luc plasmids were generated and transfected into HepG2‐2.15 cell lines stably transfected with indicated Cas9n/sgRNA system plasmids. Thirty‐six hours after transfection, the dual luciferase activities were determined. For the luciferase assay conducted, luciferase activities correspond to the average of results from three independent experiments, and data are expressed as means ± SE. (C) Analysis of Cas9n activity by T7 endonuclease I (T7EI) assay using genomic DNA from HepG2‐2.15 cells stably transfected with indicated Cas9n/sgRNA system plasmids. Arrows depict the sizes of Cas9n‐mutagenized DNA fragments. (D) Immunofluorescence staining was performed to examine the HBsAg levels in HepG2‐2.15 (left panel) and PLC/PRF/5 (right panel) cell lines stably transfected with indicted Cas9n/sgRNA plasmids. DAPI was used to stain the DNA. DAPI, 4′,6‐diamidino‐2‐phenylindole. (E) HBsAg in the filtered supernatants of HepG2.2.15 and PLC/PRF/5 cells (stably transfected with indicted Cas9n/sgRNA plasmids) was quantified by ELISA. Three independent experiments were performed. Values are shown as mean ± standard deviation (SD) (n = 3)
2.2. CRISPR/Cas9n‐mediated deletion of HBsAg results in decreased proliferation of HCC cells
We next analyzed potential effects of HBsAg knockout on HCC cell proliferation. HBV‐positive HCC cells (HepG2‐2.15, PLC/PRF/5, and Hep3B) stably expressing Cas9 were transfected with each sgRNA construct to establish stable CRISPR/Cas9n‐mediated deletion cell lines (sgR1, sgR3, and sgR6). Using Cell Counting Kit‐8 (CCK‐8) proliferation assay, the proliferation of each sgR and Ctr cell line was assessed, and results showed that sgR‐1 (targeting the preS1 region) and sgR‐2 (targeting the preS2 region) could significantly inhibit the proliferation of these HCC cells, while sgR‐6 (targeting the preS2 region) had little effect on the proliferation (Figure 2A‐C). To further confirm that the effect of sgRNA on the proliferation of HepG2‐2.15, PLC/PRF/5, and Hep3B cells was attributed to the CRISPR/Cas9n‐mediated deletion of HBsAg, but not the potential off‐target effects, we also generated stably expressing sgRNA (sgR1, sgR3, and sgR6) HBV‐negative cell lines (Huh7 and HEK293FT). As expected, the proliferation assay revealed that each sgR Huh7 and HEK293FT cells exhibited a similar growth rate as that of Ctr cells (Figures 2D and 2E).
Figure 2.
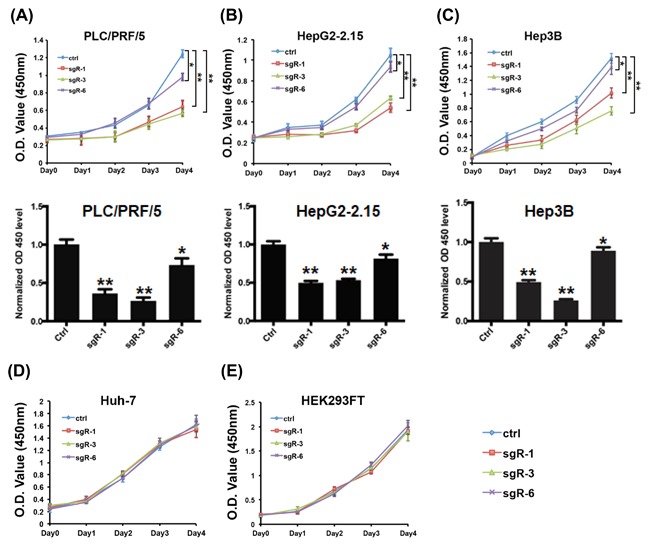
CRISPR/Cas9n‐mediated deletion of HBsAg results in decreased proliferation of HCC cells. (A‐C) Growth curves for indicated PLC/PRF/5 (left), HepG2‐2.15 (middle), and Hep3B (right) cells were evaluated by the CCK‐8 proliferation assay. (D‐E) Cell proliferation assay for the indicated Huh7 (left) and HEK293FT (right) cell lines. The samples were assayed in triplicate. Each point represents the mean value from three independent samples. The data are presented as mean ± SD. P values were calculated using a Student's t‐test. **P < 0.01, *P < 0.05
2.3. HBsAg knockout decreases the in vivo tumorigenicity of HCC cells
The above data suggest the oncogenic function of HBsAg in HCC. We further examined the effects of HBsAg knockout on in vivo tumor growth of HCC cells. In subcutaneous implantation nude mice models, the nude mice injected with indicated sgR cell lines showed significantly decreased tumorigenic potential in comparison to those injected with control cells, but with noticeable variation of efficacy, as determined by tumor sizes (Figure 3A), tumor volumes (Figure 3B), and tumor weights (Figure 3C). The designed sgR‐1 and sgR‐3 (targeting preS1 and preS2 region) exhibited higher tumorigenicity‐suppressing efficiency than sgR‐6 (targeting S region), with decreased tumor incidence and smaller tumor size. Moreover, IHC results indicated that Ki‐67 was significantly decreased in HBsAg knockout (sgR‐1, sgR‐3, sgR‐6) xenograft tumors (Figures 3D and 3E). Taken together, these data indicate that knockout of HBsAg by designing specific sgRNAs targeting the preS1/preS2/S region decreased the tumorigenic potential of HCC cells in vitro and in vivo.
Figure 3.
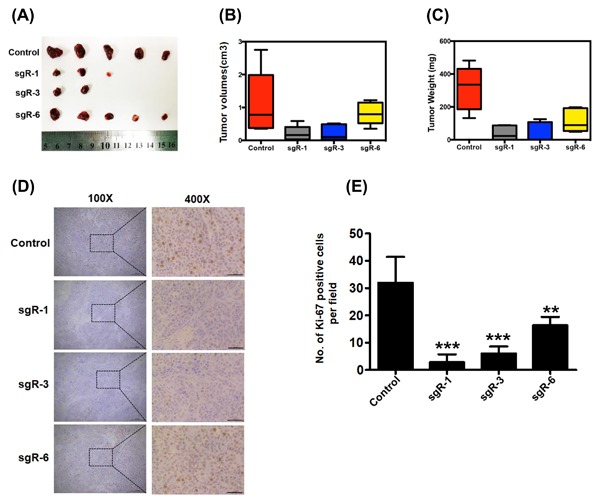
Tumorigenic potential was reduced in HBsAg knockout PLC/PRF/5 HCC cells. (A) Tumor images in the indicated cell lines 7 weeks after inoculation. (B) Final tumor volumes are summarized in the chart. The average tumor volume was expressed as the mean ± SD of five mice. (C) Total tumor weight from each group of mice was calculated and shown. The data are presented as mean ± SD. (D and E) Expression of Ki‐67 in the xenograft tumor tissues was examined by IHC staining. Scale bars: 50 μm. Data are presented as mean ± SD. P values were calculated using a Student's t‐test. ***P < 0.001, **P < 0.01, *P < 0.05
2.4. HBsAg expression promotes HCC cell growth in vitro and in vivo
To further confirm the oncogenic function of HBsAg in HCC, HBV‐negative HCC cell lines (SK‐hep1 and HLF) were stably transfected with LHBs‐Flag, MHBs‐Flag, and SHBs‐Flag constructs, respectively. As shown in Figures 4A and 4B, stable HBsAg expression (LHBs, MHBs, and SHBs) in SK‐hep1 and HLF cells compared with control cells was confirmed by Western blot analysis and quantitative real‐time polymerase chain reaction (qRT‐PCR). Cell proliferation assay was carried out and the results revealed that LHB and MHB expression, but not SHB expression promoted in vitro proliferation of SK‐hep1 and HLF cells (Figures 4C and 4D). We next tested whether HBsAg expression affected tumor growth in vivo. Three weeks after tumor xenograft, nude mice were sacrificed, and HCC cells stably expressing LHBs, MHBs, and SHBs showed increased tumor growth compared with control cells, as determined through tumor imaging and tumor volume and weight measurement (Figures 4D and 4E). Notably, LHB expressing‐HCC cells displayed greater tumorigenic potential than MHB‐ and SHB‐expressing cells in vivo.
Figure 4.
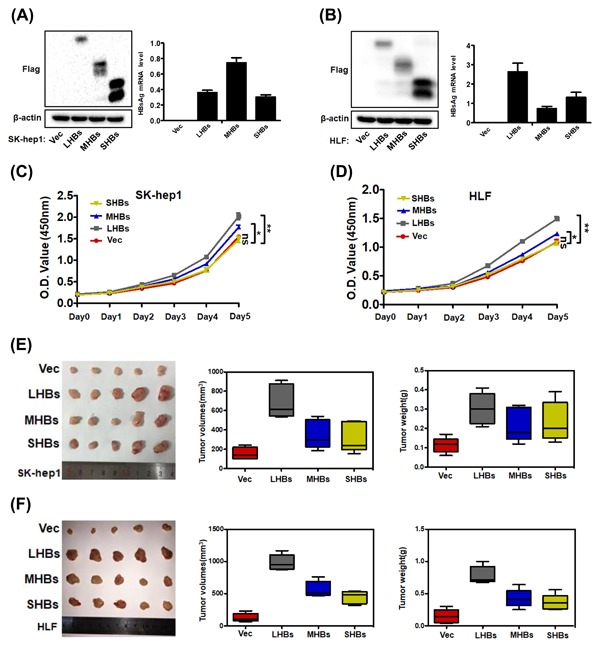
HBsAg expression promotes HCC cell growth in vitro and in vivo. (A and B) Western blot analysis of Flag (left) and qRT‐PCR analysis of HBsAg mRNA level (right) in SK‐hep1 and HLF cells that were stably transfected with LHBs‐Flag, MHBs‐Flag, and SHBs‐Flag constructs. (C and D) Cell proliferation assay for the indicated cells lines. The data are presented as mean ± SD. (E and F) Tumor xenograft experiments were carried out in nude mice with indicated cells. Images (left), volumes (middle), and weights (right) of xenograft tumors are shown. The data are presented as mean ± SD of five mice. Data were analyzed by Student's t‐test; **P < 0.01,*P < 0.05
2.5. CRISPR/Cas9‐mediated disruption of HBsAg decreased interleukin (IL)‐6 production in HCC cells
Next, we attempt to characterize the mechanisms underlying the tumorigenicity suppression conferred by CRISPR/Cas9‐mediated disruption of HBsAg in HCC cells. Recently, studies have reported that transfection of HBV genomic DNA into HCC cells and overexpressing HBx could activate the IL‐6 gene and promote IL‐6 protein production.26, 27 IL‐6 is a pleiotropic cytokine that functions as a growth factor in various tumor cells, and high levels of IL‐6 are found in patients with HCC caused by HBV.28, 29 This prompted us to test whether CRISPR/Cas9‐mediated disruption of HBV ORF preS1/preS2/S could decrease IL‐6 production in HCC cells. Accordingly, the IL‐6 protein level in the culture medium, as tested by ELISA, was dramatically decreased when HBV ORF preS1/preS2/S was disrupted by the CRISPR/Cas9 system (Figures 5A and 5B). Upregulated IL‐6 phosphorylates and activates signal transducer and activator of transcription 3 (STAT3), which is a transcription factor related with IL‐6‐mediated cell growth, differentiation, and survival in cancer,30 and constitutively phosphorylated STAT3 has been reported and considered as an important factor involved in HBV‐HCC.31 Therefore, we wondered whether downstream STAT3 signaling would be downregulated with the decrease in IL‐6 level. Western blot analysis showed that the disruption of HBV ORF preS1/preS2/S caused a decrease in the level of STAT3 phosphorylation at tyrosine 705 (pY‐STAT3) in HCC cells (Figures 5C and 5D). We next carried out IHC staining for IL‐6 and pY‐STAT3 in in the harvested tumors, and the results showed that IL‐6, phospho‐STAT3 expression were markedly lower in sgR (sgR‐1, sgR‐3, sgR‐6) groups compared with the controls (Figures 6A and 6B). Interestingly, we also found that LHB and MHB expression, but not SHB expression could induce a marked accumulation of pY‐STAT3 in SK‐hep1 and HLF cells (Figures 5E and 5F). We subsequently evaluated the in vivo effect of HBsAg expression on the expression of IL‐6 and pY‐STAT3. Xenograft tumors derived from SK‐hep1 and HLF cells were stained for IL‐6 and pY‐STAT3 using IHC. We detected that tumor tissues derived from LHB and MHB groups expressed a higher level of IL‐6 and pY‐STAT3 (Figure 7A‐D). Taken together, these results suggest that CRISPR/Cas9‐mediated disruption of HBsAg decreased IL‐6 level and downregulated STAT3 signaling.
Figure 5.
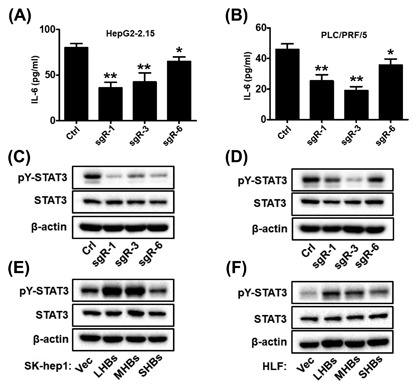
CRISPR/Cas9‐mediated disruption of HBsAg decreased IL‐6 production in HCC cells. (A and B) IL‐6 protein levels in the culture medium of indicated cells were determined by ELISA. Data are presented as mean ± SD of three independent experiments. P values were calculated using a Student's t‐test. **P < 0.01, *P < 0.05. (C and D) pY‐STAT3 and total STAT3 levels of indicated HepG2‐2.15 (left) and PLC/PRF/5 (right) cell lines were analyzed by Western blotting. (E and F) pY‐STAT3 and total STAT3 levels of indicated SK‐hep1 (left) and HLF (right) cells were analyzed by Western blotting
Figure 6.
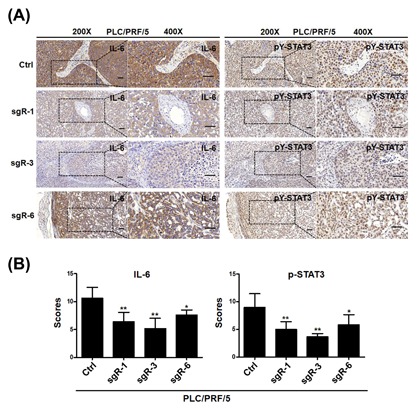
CRISPR/Cas9‐mediated disruption of HBsAg decreased the expression levels of IL‐6 and p‐STAT3 in HCC xenograft tumors derived from HCC cells. (A) The xenograft tumors derived from HCC PLC/PRF/5 cells were sectioned and stained for the expression of IL‐6 and p‐STAT3 by immunohistochemistry. Representative images of IHC staining from xenograft tumors in nude mice were showed. (Left, 200×; right, 400×), Scale bars = 50 μm. (B) Quantification of IHC scores for IL‐6 and p‐STAT3 staining in HCC PLC/PRF/5 xenograft tumors. Data (mean ± SD; n = 5) were analyzed by Student t‐test; **P < 0.01, *P < 0.05
Figure 7.
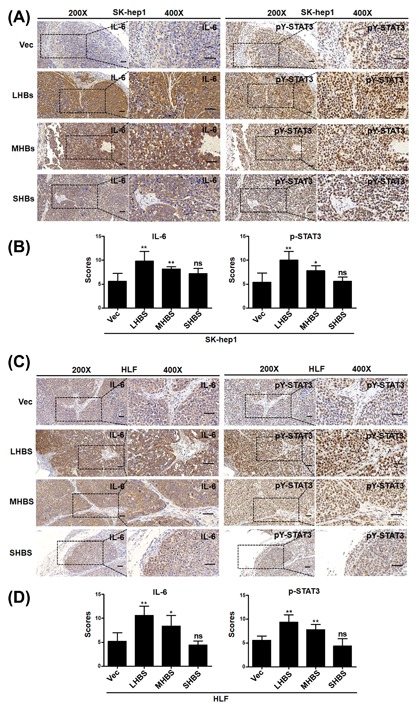
Overexpression of LHBs and MHBs increased the expression levels of IL‐6 and p‐STAT3 in HCC xenograft tumors derived from HCC cells. (A and C) The xenograft tumors derived from SK‐hep1 (A) and HLF (C) cells were sectioned and stained for the expression of IL‐6 and p‐STAT3 by immunohistochemistry. Representative images of IHC staining from xenograft tumors in nude mice were showed. (Left, 200×; right, 400×), Scale bars = 50 μm. (B and D) Quantification of IHC scores for IL‐6 and p‐STAT3 staining in HCC SKhep1 (B) and HLF (D) xenograft tumors. Data (mean ± SD; n = 5) were analyzed by Student t‐test; **P < 0.01, *P < 0.05
3. DISCUSSION
Chronic HBV infection has been linked epidemiologically to the development of HCC for years.6 While significant advances have been made in the understanding of indirect roles of chronic HBV infection proposed on the molecular basis of HBV‐HCC, including virus persistence, genetic alterations conferred by HBV DNA integration, and hepatic cell clone expansion because of chronic inflammation and fibrosis, increasing studies indicate that expression of HBV proteins, such as HBx and HBeAg can modulate hepatic malignant transformation.6 However, the mechanisms regulating cancer stemness and tumor progression in HBV‐HCC remain to be determined. Meanwhile, current anti‐HBV treatments with either nucleoside/nucleotide analogs (NAs) or interferons can control HBV production, but not cure chronic hepatitis B (CHB), and relapses are common.32 Although NAs can inhibit viral reverse transcriptase and suppress HBV replication, unfortunately, none of these drugs alone have little or any ability to eliminate replicative HBV templates comprising integrated HBV DNA.33 Recently, novel designer enzymes, such as the CRISPR/Cas9 RNA‐guided nuclease system, provide technologies for developing advanced therapeutic strategies that could directly cut HBV DNA and cccDNA in vitro and in vivo, as well as for chronic or de novo HBV infection.34, 35 Although there is still a long way for the treatment of patients infected with HBV using the CRISPR/Cas9 system, this system may provide a novel strategy for a sterilizing cure of chronic HBV infection, and may also provide a means of blocking carcinogenesis by eliminating integrated viral DNA in HBV‐HCC.
Here, we designed six sgRNAs targeting the ORF preS1/preS2/S of the HBV genome. In this study, for the first time we established HBsAg knockout HCC cell lines by CRISPR/Cas9‐mediated disruption of ORF preS1/preS2/S. SSA reporter system and T7EI assay were used to validate the efficiency of each HBV‐specific sgRNA and estimate of whether Cas9n/sgRNA‐mediated cleavage was successful or not. Next, our results indicated that most of the gRNAs significantly suppressed the production of HBsAg. Interestingly, the suppressive efficiency of different sgRNAs varied depending on the regions they were targeted against. sgRNAs targeting the preS1 and preS2 regions exhibited higher HBsAg suppression. Thus, this finding provides us a novel tool to explore the role of HBsAg in the oncogenic function of HBV‐HCC, and may likely provide new opportunities for developing novel strategies because the current therapies for HBV‐HCC, especially for advanced patients, are limited and lack efficacy.
On a functional level, we demonstrated for the first time that knockout of HBsAg by CRISPR/Cas9‐mediated disruption of ORF preS1/preS2/S decreased malignant potential, including proliferation in vitro and tumorigenicity in vivo. Notably, we generated HBV‐negative control HCC cell lines to rule out the possibility caused by the off‐target effects of CRISPR/Cas9 system. In addition, we also demonstrated the provocative effect of HBsAg on tumor growth of HCC cells in vivo and in vitro, which provides further evidence on the oncogenic function of HBsAg during HBV‐HCC development. By these in vitro and in vivo gain‐ and loss‐of‐function studies, the preS1 and preS2 regions of ORF preS1/preS2/S were shown to display principal malignant potential, which seems consistent with some previous studies. preS1/2 mutants and overexpression of LHBs are found in patients infected with chronic HBV, and exert oncogenic functions.5, 36 C‐terminally truncated M protein displays transcriptional activation properties and transforming potential, which enhances the proliferative activity of hepatocytes.37, 38
Next, we attempted to explore the molecular mechanism of the oncogenic effect of HBsAg. Studies have demonstrated the oncogenic potential of overexpressed HBV envelope polypeptides and accumulation of filamentous HBsAg particles within the endoplasmic reticulum (ER) as a potential mechanism. Accumulation of unfolded/misfolded proteins activates the intracellular signaling pathways associated with ER stress.39, 40 Pro‐inflammatory cytokines/chemokines are highly expressed during infections and have been shown to correlate significantly with clinical severity and outcomes. Studied in patients with influenza showed that antiviral treatments with oseltamivir could significantly reduce viral RNA load, downregulate of the pro‐inflammatory cytokine (eg, IL‐6, CXCL8/IL‐8) responses.41 It prompted us to investigate whether knockout of HBsAg by disruption of ORF in HBV could lead to similar anti‐inflammatory effects. Interestingly, in our study, we found that CRISPR/Cas9‐mediated disruption of HBsAg decreased IL‐6 production in HCC cells. Inflammation plays an important role in the initiation and progression of tumors. Among these mediators, elevated levels of IL‐6 have been associated with HCC in human patients42 and hypersecretion of IL‐6 leads to HCC tumor progression.43 Meanwhile, we found that CRISPR/Cas9‐mediated disruption of HBsAg caused a decrease in the level of pY‐STAT3, similar to that of IL‐6. Overexpression of LHBs and MHBs significantly increased the levels of pY‐STAT3. STAT3 is considered as an important factor involved in HBV gene expression,44 which can be promoted by STAT3 activators, such as IL‐6.45 STAT3 is a well‐known transcriptional activator that regulates the expression of a variety of genes that are critical for cell differentiation, proliferation, apoptosis, and metastasis.45 These data indicated that the oncogenic effect of HBsAg might possibly be associated with the IL‐6/STAT3 pathway. These aspects of the mechanism remain to be explored further. Previous studies have shown that transfection of HBV genomic DNA into HCC cells and overexpression of HBx greatly enhanced the synthesis of IL‐6, which is involved in the development of HCC.27, 46 In this study, HBsAg release was clearly impaired in HCC cells expressing Cas9n together with ORF preS1/preS2/S‐specific sgRNAs. However, it is noteworthy that such gRNAs not only destroy HBV‐expressing templates, but also destroy HBV cccDNA theoretically. HBeAg and HBx levels could also be reduced in the CRISPR/Cas9‐mediated knockout HBsAg cell culture supernatant because of potential destruction of HBV cccDNA. Thus, further studies are needed to determine whether these mechanisms are applicable only to HBsAg or also to other related factors. Nevertheless, our study highlights a critical role of HBsAg in liver cancer development.
In summary, we designed specific sgRNAs and for the first time established HBsAg knockout HCC cell lines using the CRISPR/Cas9 system. We suggest that HBsAg may play an important role in contributing to the malignant potential of HCC cells by in vitro and in vivo gain‐ and loss‐of‐function studies. Our results indicate that IL‐6/STAT3 may be involved in the HBsAg‐mediated signaling pathways of HBV‐HCC. Furthermore, the data presented here support the notion that the CRISPR/Cas9 technology targeting ORF HBsAg may provide a novel therapeutic strategy for HBV‐related HCC.
4. MATERIALS AND METHODS
4.1. Construction of CRISPR plasmids and preparation of stably expressing cell lines
Lentiviral constructs expressing Cas9 and gRNAs were originally generated from Feng Zhang's lab47, 48 and were obtained from Addgene (Cambridge, MA). The gRNA‐expressing plasmid was modified to generate a Tet‐inducible (Tet‐On) gRNA‐expressing plasmid. Lentiviral particles for infecting cultured cells were produced by transient co‐transfection of 293T cells (ATCC catalogue #CRL‐3216) with the lentiviral vector construct and a packaging mix using Lipofectamine 3000 reagent (Invitrogen, Life Technologies, Carlsbad, CA) according to the manufacturer's protocol. After 48‐72 h of transfection, the medium containing lentiviral particles was harvested and transduced into the target cells in the presence of polybrene (8 µg/mL). We first established HCC cell lines stably expressing Cas9 by infecting the cells with lentivirus expressing Cas9, followed by selection with blasticidin. The various sgRNA sequences were constructed for each target separately. Lentivirus harboring non‐targeting vector (PC) and all gRNA expression constructs were generated and used to infect these stably expressing Cas9 HCC cell lines, followed by selection with puromycin. Dox (100 ng/mL) was used to induce gRNA expression in Tet‐On systems. The primers used for the construction of HBV‐specific sgRNA plasmids are listed in Supplementary Table S1. To establish stable LHBs‐Flag‐, MHBs‐Flag‐, and SHBs‐Flag‐overexpressing HCC cell lines, the LHB, MHB, and SHB genes were synthesized according to the sequences of hepatitis B virus (HBV 991) complete genome (GenBank accession no. AF461363) and cloned into pBABE‐hygro vector (Addgene; plasmid 1765). 293FT cells were then co‐transfected with LHBs‐Flag, MHBs‐Flag, SHBs‐Flag or its empty vector construct, and a packaging mix using Lipofectamine 3000 reagent (Invitrogen) to generate retroviral particles. After 48‐72 h of transfection, the medium containing the retrovirus was harvested and transduced into the target cells in the presence of polybrene (8 µg/mL). Transfected cells were selected by culturing for 2 weeks in the presence of 500 ng/mL hygromycin B (Thermo Fisher Scientific, Waltham, MA).
4.2. Cell lines and culture conditions
We obtained HCC cell lines (PLC/PRF/5, HepG2‐2.15, Hep3B, SK‐hep1, HLF, and Huh‐7) and HEK293F cells from the American Type Culture Collection or China Center for Type Culture Collection (CCTCC, Wuhan, China). The cell lines were maintained in Dulbecco's modified Eagle's medium (DMEM) supplemented with 10% fetal bovine serum, 100 U/mL penicillin, and 0.1 mg/mL streptomycin in a 5% CO2 incubator at 37°C. All cell culture reagents were purchased from Gibco (Invitrogen).
4.3. Dual luciferase reporter assay
Double‐stranded oligonucleotides, containing HBV‐ preS1/preS2/S ORF target sites were ligated and constructed into dual‐fluorescence reporter systems based on SSA repair mechanism to generate sgR‐Luc plasmids according to the manufacturer's protocol. For dual luciferase reporter assay, HepG2‐2.15 cells stably expressing Cas9n/sgRNA were seeded in 6‐well culture plates and transiently transfected with 1 µg indicated sgR‐Luc. Thirty‐six hours after transfection, the activities of luciferase were quantified in a luminometer using the Dual Luciferase Reporter Assay System (Promega, Madison, WI). All experiments were performed in triplicate.
4.4. T7EI assay
Regions containing the Cas9‐nickase‐mediated mutations were amplified using Phusion® polymerase (New England BioLabs, Ipswich, MA) according to the manufacturer's protocol with 100 ng of the purified total cellular DNA in a 50 µL reaction. Amplification products were isolated using a PCR purification kit (Qiagen, Valencia, CA). The purified PCR product was subjected to a re‐annealing process to induce heteroduplex formation. After re‐annealing, products were treated with T7EI (New England Biolabs) at 37°C for 30 min and analyzed using 3% agarose gels. Gels were imaged using a gel imaging system (Bio‐Rad, Hercules, CA). Specific primers used to amplify DNA products are listed in Supplementary Table S2.
4.5. Immunofluorescence
Cells were washed twice in phosphate buffered saline (PBS), fixed in freshly prepared 3.7% paraformaldehyde in PBS for 15 min on ice, washed again three times, permeabilized in 0.1% Triton X‐100 in blocking solution (3% goat serum plus 0.5% bovine serum albumin [BSA] in PBS) for 30 min at room temperature, washed three times each for 5 min, and left in the blocking solution (3% goat serum plus 0.5% BSA in PBS) for 2 h. Cells were incubated overnight at 4°C with primary antibodies against HBsAg (ab9193; Abcam, Cambridge, MA). After washing with PBS, cells were incubated with FITC‐conjugated anti‐mouse secondary antibody at room temperature for 1 h. After washing with PBS three times, anti‐fade 4′,6‐diamidino‐2‐phenylindole (DAPI) (Wuhan Goodbio Biotechnology Co. Ltd., Wuhan, China) solution was added and images were captured using confocal laser‐scanning microscopy on a Nikon Digital ECLIPSE C1 system (Nikon Corporation, Tokyo, Japan).
4.6. Quantification of HBsAg and IL‐6 by ELISA
Indicated cells were cultured and seeded into each well of a 6‐well plate and incubated for 48 h in 2 mL serum‐free medium. The supernatants were collected and HBsAg levels were determined in triplicate using ELISA kits (Jingmei Biotech, China) according to the manufacturer's instructions. Indicated cells were cultured and seeded into each well of a 24‐well plate and incubated for 48 h in 0.5 mL serum‐free medium. The supernatants were collected and IL‐6 levels were determined in triplicate using ELISA kits (Jingmei Biotech, China) according to the manufacturer's instructions.
4.7. Cell proliferation assay
The cell proliferation assay was measured using the Cell Counting Kit‐8 (CCK‐8, Beyotime Institute of Biotechnology). Indicated cells and the same amount of their control cells were cultured in 96‐well plates. At the indicated time points, 10 µL of CCK‐8 was added to 90 µL of the culture medium per well and incubated for 2 h at 37°C, and then the plate was read using an ELISA plate reader (Bio‐Tek Elx 800) at 450 nm. Each cell line was set up in three replicate wells, and the experiment was repeated thrice.
4.8. In vivo tumorigenicity assay
All animal studies were performed in accordance with the National Institutes of Health guidelines, and were approved by the Committee on the Ethics of Animal Experiments of the Tongji Medical College, HUST. The mice were randomly divided into indicated groups (5‐7 mice/group) before inoculation. For the subcutaneous mode, tumor cells (5 × 10⁶ PLC/PRF/5 cells) were suspended in 100 µL serum free‐DMEM and then injected subcutaneously into the flank of 4‐5‐week‐old male BALB/c athymic nude mice. Mice were sacrificed and tumors were dissected over a 3‐7‐week period. Tumors were removed, photographed, measured, and weighed and the average volume and weight of the tumors were calculated.
4.9. Immunohistochemistry (IHC) analysis
Immunohistochemistry staining for Ki‐67, IL‐6, and pY‐STAT3 were performed following the manufacturer's instruction. The primary antibodies were obtained from the following sources: Ki‐67 antibodies (ab16667, Abcam), anti‐IL‐6(ab9324, Abcam), anti‐pY705‐STAT3 (#9145; Cell Signaling Technology, Danvers, MA). In brief, tissue sections were deparaffinized in xylene and rehydrated with ethanol. Tissue sections were then preincubated with 10% normal goat serum in PBS (pH 7.5) followed with incubation with primary antibody overnight at 4°C. Tissue sections were then stained with biotinylated secondary antibody (Vector lab, Burlingame, CA) for 1 h at room temperature, followed by the Vectastain Elite ABC reagent (Vector lab) for 30 min. The peroxidase reaction was developed with diaminobenzidine (DAB kit; Vector lab) and the slides were counterstained with hematoxylin (Sigma).
4.10. Western blotting
Western blotting was carried out according to the standard protocol. Primary antibodies were obtained from the following sources: anti‐β‐actin (A5316; Sigma‐Aldrich, St. Louis, MO), monoclonal anti‐Flag (F1804; Sigma‐Aldrich), anti‐STAT3 (#12640; Cell Signaling Technology), and anti‐pY705‐STAT3 (#9145; Cell Signaling Technology). Horseradish peroxidase‐conjugated goat anti‐mouse and anti‐rabbit antibodies were used as secondary antibodies (Jackson ImmunoResearch, PA), and the blots were detected using enhanced chemiluminescence (ECL; Dura, Pierce, NJ).
4.11. qRT‐PCR assay
RNA was extracted with TRIzol reagent (Invitrogen) and reverse transcription was performed using PrimeScript® RT reagent Kit (Takara, Dalian, China) according to the standard instructions. qRT‐PCR was carried out on CFX96 Touch™ Real‐Time PCR Detection System (Bio‐Rad) using a SYBR Green Supermix kit (Takara, Dalian, China) according to manufacturers’ instructions. Specific primer pairs were used to quantify the expression. GAPDH (forward, 5′GAGAGACCCTCACTGCTG‐3′ and reverse, 5′‐GATGGTACATGACAAGGTGC‐3′); HBsAg (forward, 5′‐TTGGCCAAAATTCG‐CAGTCC‐3′ and reverse, 5′‐TGAGGCATAGCAGCAGGATG‐3′). Relative quantification was accomplished by normalizing the expression levels of the other genes to GAPDH. Each reaction was repeated independently three times in triplicate.
4.12. Statistical analysis
Statistical analysis was performed using the GraphPad Prism 6 software (GraphPad Software, Inc., La Jolla, CA) or SPSS 18.0 software (SPSS, Chicago, IL). Data were shown as mean ± standard deviation (SD). Student's t‐test was used to analyze statistical significance of the data. A P value of less than 0.05 was considered to be statistically significant.
CONFLICTS OF INTEREST
The authors declare no conflict of interest.
Supporting information
Additional supporting information may be found online in the Supporting Information section at the end of the article.
Figure S1. Related to Figure 1. Identifcation of target sites in the open reading frame (ORF) preS1/preS2/S of the HBV genome.
Table S1. The primers used for the construction of HBV‐specific sgRNA plasmids.
Table S1. Specific primers used to amplify DNA in T7 endonuclease I assay.
ACKNOWLEDGMENTS
This work was supported by grants from the National Natural Science Foundation of China (81372327, 81572427 to Bi‐xiang Zhang; 31671348 to Liang Chu; 81202300 to Hui‐fang Liang; 81502530 to Zhan‐guo Zhang).
AUTHORS' CONTRIBUTIONS
Bixiang Zhang and Zhanguo Zhang conceived and designed the study. Jia Song did the main experiments. We are grateful to Xiaochao Zhang, Qianyun Ge, Chaoyi Yuan, Liang Chu, Hui‐fang Liang, Zhibin Liao, and Qiumeng Liu for assistance with our experiments.
Song J, Zhang X, Ge Q, et al. CRISPR/Cas9‐mediated knockout of HBsAg inhibits proliferation and tumorigenicity of HBV‐positive hepatocellular carcinoma cells. J Cell Biochem. 2018;119:8419–8431. 10.1002/jcb.27050
Contributor Information
Zhanguo Zhang, Email: 32650625@qq.com.
Bixiang Zhang, Email: bixiangzhang@163.com.
REFERENCES
- 1. Torre LA, Bray F, Siegel RL, Ferlay J, Lortet‐Tieulent J, Jemal A. Global cancer statistics, 2012. CA. 2015;65:87–108. [DOI] [PubMed] [Google Scholar]
- 2. Fares N, Peron JM. Epidemiology, natural history, and risk factors of hepatocellular carcinoma. Rev Prat. 2013;63:216–217, 220–212. [PubMed] [Google Scholar]
- 3. Parkin DM. The global health burden of infection‐associated cancers in the year 2002. Int J Cancer. 2006;118:3030–3044. [DOI] [PubMed] [Google Scholar]
- 4. Bosetti C, Turati F, La Vecchia C. Hepatocellular carcinoma epidemiology. Best Pract Res Clin Gastroenterol. 2014;28:753–770. [DOI] [PubMed] [Google Scholar]
- 5. Pollicino T, Cacciola I, Saffioti F, Raimondo G. Hepatitis B virus PreS/S gene variants: pathobiology and clinical implications. J Hepatol. 2014;61:408–417. [DOI] [PubMed] [Google Scholar]
- 6. Di Bisceglie AM. Hepatitis B and hepatocellular carcinoma. Hepatology. 2009;49:S56–S60. [DOI] [PMC free article] [PubMed] [Google Scholar]
- 7. Xu J, Liu H, Chen L, et al. Hepatitis B virus X protein confers resistance of hepatoma cells to anoikis by up‐regulating and activating p21‐activated kinase 1. Gastroenterology. 2012;143:199–212.e194. [DOI] [PubMed] [Google Scholar]
- 8. Chen S, Dong Z, Yang P, et al. Hepatitis B virus X protein stimulates high mobility group box 1 secretion and enhances hepatocellular carcinoma metastasis. Cancer Lett. 2017;394:22–32. [DOI] [PubMed] [Google Scholar]
- 9. Zhang T, Zhang J, You X, et al. Hepatitis B virus X protein modulates oncogene Yes‐associated protein by CREB to promote growth of hepatoma cells. Hepatology. 2012;56:2051–2059. [DOI] [PubMed] [Google Scholar]
- 10. Liu D, Cui L, Wang Y, et al. Hepatitis B e antigen and its precursors promote the progress of hepatocellular carcinoma by interacting with NUMB and decreasing p53 activity. Hepatology. 2016;64:390–404. [DOI] [PubMed] [Google Scholar]
- 11. Han M, Yan W, Guo W, et al. Hepatitis B virus‐induced hFGL2 transcription is dependent on c‐Ets‐2 and MAPK signal pathway. J Biol Chem. 2008;283:32715–32729. [DOI] [PubMed] [Google Scholar]
- 12. Kwon JA, Rho HM. Transcriptional repression of the human p53 gene by hepatitis B viral core protein (HBc) in human liver cells. Biol Chem. 2003;384:203–212. [DOI] [PubMed] [Google Scholar]
- 13. Glebe D, Urban S. Viral and cellular determinants involved in hepadnaviral entry. World J Gastroenterol. 2007;13:22–38. [DOI] [PMC free article] [PubMed] [Google Scholar]
- 14. Tseng TC, Liu CJ, Yang HC, et al. Serum hepatitis B surface antigen levels help predict disease progression in patients with low hepatitis B virus loads. Hepatology. 2013;57:441–450. [DOI] [PubMed] [Google Scholar]
- 15. Liu J, Yang HI, Lee MH, et al. Spontaneous seroclearance of hepatitis B seromarkers and subsequent risk of hepatocellular carcinoma. Gut. 2014;63:1648–1657. [DOI] [PubMed] [Google Scholar]
- 16. Toshkov I, Chisari FV, Bannasch P. Hepatic preneoplasia in hepatitis B virus transgenic mice. Hepatology. 1994;20:1162–1172. [PubMed] [Google Scholar]
- 17. Liu H, Xu J, Zhou L, et al. Hepatitis B virus large surface antigen promotes liver carcinogenesis by activating the Src/PI3K/Akt pathway. Cancer Res. 2011;71:7547–7557. [DOI] [PubMed] [Google Scholar]
- 18. Kekule AS, Lauer U, Meyer M, Caselmann WH, Hofschneider PH, Koshy R. The preS2/S region of integrated hepatitis B virus DNA encodes a transcriptional transactivator. Nature. 1990;343:457–461. [DOI] [PubMed] [Google Scholar]
- 19. Ebina H, Misawa N, Kanemura Y, Koyanagi Y. Harnessing the CRISPR/Cas9 system to disrupt latent HIV‐1 provirus. Sci Rep. 2013;3:2510. [DOI] [PMC free article] [PubMed] [Google Scholar]
- 20. Hu W, Kaminski R, Yang F, et al. RNA‐directed gene editing specifically eradicates latent and prevents new HIV‐1 infection. Proc Natl Acad Sci USA. 2014;111:11461–11466. [DOI] [PMC free article] [PubMed] [Google Scholar]
- 21. Kennedy EM, Kornepati AV, Cullen BR. Targeting hepatitis B virus cccDNA using CRISPR/Cas9. Antivir Res. 2015;123:188–192. [DOI] [PubMed] [Google Scholar]
- 22. Li H, Sheng C, Wang S, et al. Removal of Integrated Hepatitis B Virus DNA Using CRISPR‐Cas9. Front Cell Infect Microbiol. 2017;7:91. [DOI] [PMC free article] [PubMed] [Google Scholar]
- 23. Wang J, Xu ZW, Liu S, et al. Dual gRNAs guided CRISPR/Cas9 system inhibits hepatitis B virus replication. World J Gastroenterol. 2015;21:9554–9565. [DOI] [PMC free article] [PubMed] [Google Scholar]
- 24. Kim H, Um E, Cho SR, Jung C, Kim H, Kim JS. Surrogate reporters for enrichment of cells with nuclease‐induced mutations. Nat Methods. 2011;8:941–943. [DOI] [PubMed] [Google Scholar]
- 25. Meyer M, de Angelis MH, Wurst W, Kuhn R. Gene targeting by homologous recombination in mouse zygotes mediated by zinc‐finger nucleases. Proc Natl Acad Sci USA. 2010;107:15022–15026. [DOI] [PMC free article] [PubMed] [Google Scholar]
- 26. Lee Y, Park US, Choi I, Yoon SK, Park YM, Lee YI. Human interleukin 6 gene is activated by hepatitis B virus‐X protein in human hepatoma cells. Clin Cancer Res. 1998;4:1711–1717. [PubMed] [Google Scholar]
- 27. Xiang WQ, Feng WF, Ke W, Sun Z, Chen Z, Liu W. Hepatitis B virus X protein stimulates IL‐6 expression in hepatocytes via a MyD88‐dependent pathway. J Hepatol. 2011;54:26–33. [DOI] [PubMed] [Google Scholar]
- 28. Coskun U, Bukan N, Sancak B, et al. Serum hepatocyte growth factor and interleukin‐6 levels can distinguish patients with primary or metastatic liver tumors from those with benign liver lesions. Neoplasma. 2004;51:209–213. [PubMed] [Google Scholar]
- 29. Chang TS, Wu YC, Chi CC, et al. Activation of IL6/IGFIR confers poor prognosis of HBV‐related hepatocellular carcinoma through induction of OCT4/NANOG expression. Clin Cancer Res. 2015;21:201–210. [DOI] [PubMed] [Google Scholar]
- 30. Johnston PA, Grandis JR. STAT3 signaling: anticancer strategies and challenges. Mol Interv. 2011;11:18–26. [DOI] [PMC free article] [PubMed] [Google Scholar]
- 31. Yang Y, Zheng B, Han Q, Zhang C, Tian Z, Zhang J. Targeting blockage of STAT3 inhibits hepatitis B virus‐related hepatocellular carcinoma. Cancer Biol Ther. 2016;17:449–456. [DOI] [PMC free article] [PubMed] [Google Scholar]
- 32. Bang KB, Kim HJ. Management of antiviral drug resistance in chronic hepatitis B. World J Gastroenterol. 2014;20:11641–11649. [DOI] [PMC free article] [PubMed] [Google Scholar]
- 33. Zucman‐Rossi J, Laurent‐Puig P. Genetic diversity of hepatocellular carcinomas and its potential impact on targeted therapies. Pharmacogenomics. 2007;8:997–1003. [DOI] [PubMed] [Google Scholar]
- 34. Lin SR, Yang HC, Kuo YT, et al. The CRISPR/Cas9 system facilitates clearance of the intrahepatic HBV templates in vivo. Mol Ther Nucleic Acids. 2014;3:e186. [DOI] [PMC free article] [PubMed] [Google Scholar]
- 35. Kennedy EM, Bassit LC, Mueller H, et al. Suppression of hepatitis B virus DNA accumulation in chronically infected cells using a bacterial CRISPR/Cas RNA‐guided DNA endonuclease. Virology. 2015;476:196–205. [DOI] [PMC free article] [PubMed] [Google Scholar]
- 36. Hsieh YH, Chang YY, Su IJ, et al. Hepatitis B virus pre‐S2 mutant large surface protein inhibits DNA double‐strand break repair and leads to genome instability in hepatocarcinogenesis. J Pathol. 2015;236:337–347. [DOI] [PubMed] [Google Scholar]
- 37. Hildt E, Munz B, Saher G, Reifenberg K, Hofschneider PH. The PreS2 activator MHBs(t) of hepatitis B virus activates c‐raf‐1/Erk2 signaling in transgenic mice. EMBO J. 2002;21:525–535. [DOI] [PMC free article] [PubMed] [Google Scholar]
- 38. Luan F, Liu H, Gao L, et al. Hepatitis B virus protein preS2 potentially promotes HCC development via its transcriptional activation of hTERT. Gut. 2009;58:1528–1537. [DOI] [PubMed] [Google Scholar]
- 39. Mathai AM, Alexander J, Kuo FY, Torbenson M, Swanson PE, Yeh MM. Type II ground‐glass hepatocytes as a marker of hepatocellular carcinoma in chronic hepatitis B. Hum Pathol. 2013;44:1665–1671. [DOI] [PubMed] [Google Scholar]
- 40. Tsai HW, Lin YJ, Lin PW, et al. A clustered ground‐glass hepatocyte pattern represents a new prognostic marker for the recurrence of hepatocellular carcinoma after surgery. Cancer. 2011;117:2951–2960. [DOI] [PubMed] [Google Scholar]
- 41. Lee N, Wong CK, Chan MCW, et al. Anti‐inflammatory effects of adjunctive macrolide treatment in adults hospitalized with influenza: a randomized controlled trial. Antivir Res. 2017;144:48–56. [DOI] [PubMed] [Google Scholar]
- 42. Porta C, De Amici M, Quaglini S, et al. Circulating interleukin‐6 as a tumor marker for hepatocellular carcinoma. Ann Oncol. 2008;19:353–358. [DOI] [PubMed] [Google Scholar]
- 43. Zhou M, Yang H, Learned RM, Tian H, Ling L. Non‐cell‐autonomous activation of IL‐6/STAT3 signaling mediates FGF19‐driven hepatocarcinogenesis. Nat Commun. 2017;8:15433. [DOI] [PMC free article] [PubMed] [Google Scholar]
- 44. Waris G, Siddiqui A. Interaction between STAT‐3 and HNF‐3 leads to the activation of liver‐specific hepatitis B virus enhancer 1 function. J Virol. 2002;76:2721–2729. [DOI] [PMC free article] [PubMed] [Google Scholar]
- 45. Chai EZ, Shanmugam MK, Arfuso F, et al. Targeting transcription factor STAT3 for cancer prevention and therapy. Pharmacol Ther. 2016;162:86–97. [DOI] [PubMed] [Google Scholar]
- 46. Kim JS, Rho B, Lee TH, Lee JM, Kim SJ, Park JH. The interaction of hepatitis B virus X protein and protein phosphatase type 2 Calpha and its effect on IL‐6. Biochem Biophys Res Commun. 2006;351:253–258. [DOI] [PubMed] [Google Scholar]
- 47. Ran FA, Hsu PD, Wright J, Agarwala V, Scott DA, Zhang F. Genome engineering using the CRISPR‐Cas9 system. Nat Protoc. 2013;8:2281–2308. [DOI] [PMC free article] [PubMed] [Google Scholar]
- 48. Cong L, Ran FA, Cox D, et al. Multiplex genome engineering using CRISPR/Cas systems. Science. 2013;339:819–823. [DOI] [PMC free article] [PubMed] [Google Scholar]
Associated Data
This section collects any data citations, data availability statements, or supplementary materials included in this article.
Supplementary Materials
Additional supporting information may be found online in the Supporting Information section at the end of the article.
Figure S1. Related to Figure 1. Identifcation of target sites in the open reading frame (ORF) preS1/preS2/S of the HBV genome.
Table S1. The primers used for the construction of HBV‐specific sgRNA plasmids.
Table S1. Specific primers used to amplify DNA in T7 endonuclease I assay.


