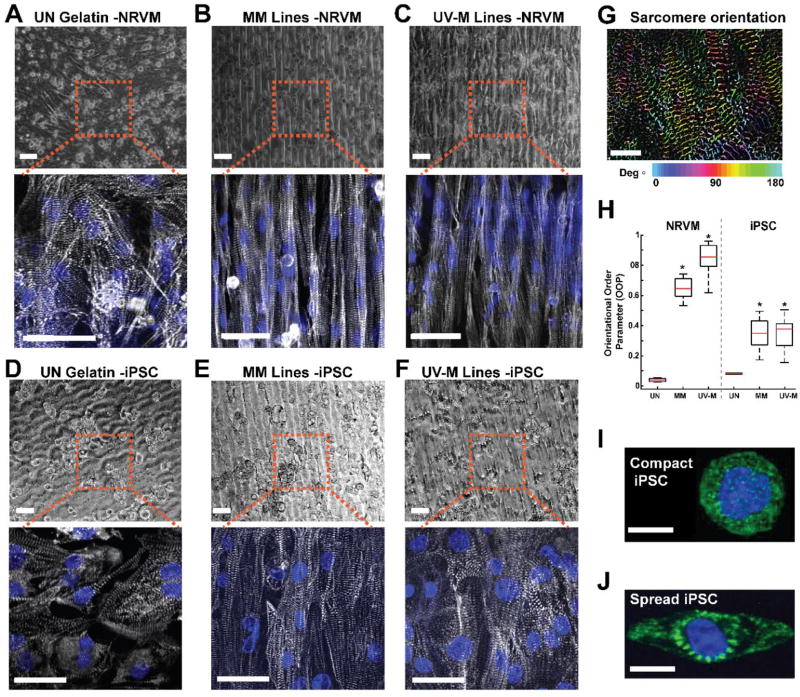
Fig. 4. Cardiac tissue engineering of neonatal rat ventricular myocytes and human iPSCs with UV laser micropatterning.
(A-C) NRVMs seeded on (A) unpatterned (UN) gelatin, (B) MM gelatin, and (C) UV-M gelatin lines after 5 days in culture. Top: Bright field image. Scale is 50 µm. Bottom: Immunohistochemistry. Blue = chromatin, gray = α-actinin. Scale is 25 µm. (D-F) Human iPSCs seeded on (D) unpatterned (UN) gelatin, (E) MM gelatin, and (F) UV-M gelatin lines. Top: Bright field image. Scale is 40 µm. Bottom: Immunohistochemistry. Blue = chromatin, gray = α-actinin. Scale is 15 µm. (G) Example of intermediate OOP analysis step. Sarcomeres are detected through filtering and thresholding, and their relative orientation angles are computed using the image structure tensor. The orientation angle of each sarcomere is indicated through a color-code. Scale is 5 µm. (H) Box plot of orientational order parameter (OOP) of sarcomeric α-actinin in NRVM tissues engineered on UN (n = 3 slides, 8 images), MM (n= 4 slides, 24 images), and UV-M gels (n= 4 slides, 44 images), and in human iPSC tissues engineered on UN (n = 1 slide, 2 images), MM (n= 1 slide, 14 images), and UV-M gels (n= 2 slides, 20 images). The red line represents the mean, black center line represents the median, and bars represent 5th and 95th percentiles. *P < 0.05 vs. UN gelatin by Kruskal-Wallis one way ANOVA and Dunn’s Test. (I) Immunostained single compact iPSC on a UV µ-pillar island. Scale bar is 10 µm. (J) Immunostained single iPSC spread beyond the UV µ-pillar island. Green: α-actinin, blue: chromatin. Scale bar is 10 µm.

