

Abstract
Objectives:
Cosmetic contact lenses are increasingly popular because of their eye enhancing cosmetic benefits. The pigment particles used in these lenses can impact lens surface characteristics. This article examines the surface characteristics and the differences between the clear and the pigmented regions among five limbal ring design lenses.
Methods:
Scanning electron microscopy was used to determine the location and depth of the pigment particles from the lens surface. The coefficient of friction (CoF) was determined with a Basalt-MUST microtribometer at clear and pigmented regions on either the front or the back surface. Atomic force microscopy was used to determine the surface roughness of each lens in root-mean-square (RMS) units at clear and pigmented regions. A linear mixed model for repeated measures was used for the analysis of the CoF and RMS roughness to compare all lenses.
Results:
Four lens types had pigments exposed on the surface and one lens type had pigment fully enclosed. The CoF difference between clear and pigmented regions were similar and not statistically significant (P=0.0124) for the lens type with pigments enclosed, whereas the CoF difference for the other four lens types showed statistically significant difference (P<0.0001).
Conclusions:
Of the lenses tested here, cosmetic contact lenses with pigments enclosed in the lens matrix provided a more consistent surface between clear and pigmented regions compared with lenses that had exposed pigments.
Key Words: Pigment, Cosmetic lenses, Roughness, Lubricity, Coefficient of friction
Cosmetic soft contact lenses (CLs) have been available in the market for at least the past three decades. The use of these lenses to achieve special esthetic effects on the eye may include changing or enhancing the color of the iris through the use of opaque tint; creating special effects of the eye appearance through dramatic print pattern; and more recently, making the iris appear larger using pigmented ring pattern that overlap with the limbal ring of the iris. Since the introduction of limbal ring cosmetic CL (also commonly known as circle lens in Asia) in the past 10 years, limbal ring cosmetic CLs have become remarkably popular, representing 40% to 60% of soft CL fits in Asian countries such as Korea and Taiwan.1 Limbal ring cosmetic CLs have attracted a much wider group of consumers. Typical consumers of limbal ring cosmetic lenses are female, young teenagers, and adults1,2; including many first-time CLs wearers.3 The presence of pigments may alter the surface properties and may impact the comfort performance of these pigmented lenses compared with their clear counterparts. This article examined the surface properties of the clear regions and the pigmented regions of five different brands of limbal ring cosmetic lenses.
PIGMENT LOCATION
With different manufacturers making cosmetic CLs, different brands could have different lens surface properties4 (pigment location, coefficient of friction [CoF], and surface roughness), despite having similar cosmetic patterns. Many manufacturers have indicated that they have their own printing technologies to create a smooth lens with pigments enclosed within the lens. However, Chan et al.5 2014 performed a rub-off test on 15 different brands and they found that only two brands passed the rub-off test. Scanning electron microscopy (SEM) cross-section images of different brands show that few have pigments located beneath the lens surface.6
Pigment-enclosed design has been deemed to be the desirable characteristic of a quality cosmetic lens. If any pigments are exposed on the lens surface, they would come in contact with the cornea or the ocular surface and could potentially impact the ocular physiology. Recently, Jung et al.7 demonstrated that lenses with pigments on the surface resulted in greater increase in epidermal growth factor and interleukin-8 levels, suggesting that presence of surface pigments can increase ocular inflammation. Watanabe et al.8 published a case report of corneal erosion attributed to pigments from a cosmetic lens that became dislodged and embedded on the ocular surface.
Several methods have been reported in the literature to objectively demonstrate pigment location and to determine whether pigments are enclosed within the lens. Examples include SEM,6 SEM with energy dispersive x-ray analysis (SEM-EDX),9 and optical coherence tomography.10 However, no international standard has been established to recommend the most appropriate method to discern the pigment location and to determine whether these pigments are enclosed in a cosmetic CL. Hence, there are no unified regulatory requirements to regulate cosmetic CL manufacturers and therefore manufacturers may claim “pigment enclosed” as long as their lenses passed the local regulatory requirement on what constitute a “pigment enclosed” design.
The advancement in technology in recent years allowed the evaluation of surface properties of these cosmetic CLs at a more microscopic level. From Lorenz et al.,6 lenses with pigments exposed on the surface have increased surface roughness (average root-mean-square [RMS] and peak-to-peak RMS), producing an uneven or inconsistent surface between central clear and peripheral pigmented regions within a lens.
COEFFICIENT OF FRICTION
Coefficient of friction describes the ratio of the force of friction between two surfaces and the normal force between those surfaces.11 Coefficient of friction has been used as an indicator of the resistance that the eyelid encounters when blinking over the CL. Measuring CoF in clear CLs has been gaining increased interest as evidence suggested an association between CoF and subjective end-of-day comfort.12,13 In Brennan's analysis, CoF data13,14 showed a significant correlation between CoF and end-of-day comfort score derived from the visual analog scale.13
Coefficient of friction is not only dependent on the inherent material properties alone but is also dependent on the experimental conditions.15 For example, the CoF of a hydrogel lens obtained in a sloped glass-plate system can vary depending on the slope of the plate, the initial speed of the objects, the pressure exerted on each other, and the water–film thickness between the two surfaces, if any.16–19 In the cornea–eyelid sliding system, the CoF is a function of the cornea, the eyelid, and their interactions with the tear film.20
Multiple studies have looked at CoF in both hydrogel and silicone hydrogel CLs.14,15,21–26 These studies used different methods to quantify CoF in CLs using different experimental designs. Hence, the reported CoF values must be considered in the context of the individual experiment parameters and may not be compared across different methods. To be clinically relevant, the system should take into account the physiological environment of the eye, surface properties of human eyelid, surface properties of the CL, the components/properties of the tear film, the temperature of the ocular tissues, and the behavior of the materials at a particular temperature. On the eye, CLs are interacting dynamically with the corneal epithelium, the palpebral conjunctiva, and tear film components through blinking motion. Ideally, the method used to measure CoF should consider all the abovementioned factors and be able to produce consistent results to compare CoF among different lenses.
Recently, the CoF of the fresh human cornea against a mucin-coated hydrophobized glass mimicking the eyelid chemistry was determined by means of a microtribometer investigation.27 The mean CoF of the human cornea in tear-like fluid in phosphate-buffered saline (PBS) was 0.0153 (±0.00941 SD) and found to be comparable with the CoF measured under the same conditions for some of the more comfortable CLs available commercially. For cosmetic limbal ring CLs, the presence of pigments (at the surface or within the lens) may result in a change of the lubricity because of chemicals (adhesiveness and slippery), mechanical (stiffening) or topographical (roughening) effects, and potentially as a trigger for tissue reaction leading to discomfort. Thus, it is important to be able to determine the CoF of both the pigmented and clear regions of the lens and compare it with the one obtained for other lenses and the cornea under similar conditions.
In this study, we examined surface lubricity using CoF and its correlation with surface roughness of five commercially available cosmetic limbal ring soft CLs. Until this study, there were no data published on the CoF of cosmetic CLs. Examining the correlation/relationship between CoF and surface roughness between the pigmented and clear regions may provide an opportunity to predict the end-of-day comfort performance among cosmetic lenses.
METHODS
Five commercially available soft cosmetic CLs were selected (Table 1) for testing. All were made of hydrogel materials without any surface treatment. Pigment locations were determined by SEM. Coefficient of friction, average RMS, and peak-to-peak RMS roughness were measured on the side where pigments were located closest to the surface (front or back side). Coefficient of friction was used as an indicator for lubricity, whereas average RMS and peak-to-peak RMS obtained by atomic force microscopy (AFM) were used to determine lens surface roughness of pigmented and clear regions.
TABLE 1.
Description of the Contact Lenses Used in This Study

Scanning Electron Microscopy Sample Preparation and Analysis Procedures
Scanning electron microscopy images of at least 3 replicates of −1.00, −3.00, and −6.00D lenses with the same lot number of each brand were obtained. Each sample was removed from its manufacturer's packaging, placed with front surface (convex) side down on a glass slide where the lens was cut into cross-section with a razor blade. The cut piece was then gently rinsed in deionized water and mounted in a vise mount with the cut surface just barely protruding from the jaws of the vise. The sample was rapidly frozen by liquid nitrogen to keep its hydrated state. The sample measurement was taken with the following parameters: Hitachi S-3400N, Imaging mode: BSE3D HR with 10 kV, and variable pressure between 20 and 60 mPa. A 500× image of each cross-section was obtained to show the entire width of the sample and the general location of the pigment particles. To measure the depth of the pigment particles, three 2,000× images of each specimen were obtained. In addition, the top-down image of the lens surface where the pigment was closest to either the front or back surface was obtained. All measurements were conducted at an ISO-certified laboratory. The uncertainty of dimensional SEM measurements is about ±10% (providing an estimated level of confidence of 95% using a coverage factor k=2). Uncertainty estimates are calculated in accordance with the ISO 21748 Guidance for the use of repeatability, reproducibility, and trueness estimates in measurement uncertainty.
Coefficient of Friction Sample Preparation and Analysis Procedures
Methods detailed in Sterner et al.15 2016 approach to measure CoF of CLs were followed. This method was chosen because this model takes the physiological environment into account and is designed to simulate in vivo performance from in vitro data. Specifically, the counter surface consisted of a 5 mm in diameter silanized (hexamethyldisilazane; Alfa Aesar, Karlsruhe, Germany) glass disk (Thickness #1; Menzel-Gläser, Braunschweig, Germany) coated with mucin by immersion in 0.1 mg/mL bovine submaxillary mucin (type I-S; Sigma-Aldrich, Darmstadt, Germany) for 30 min before the experiment. Tear-like fluid27 containing a mixture of proteins, mucins, and lipids was used as lubricant, as previously reported.15,28 Immediately before the measurement, lenses were removed from the packing solution, rinsed three times with PBS, and mounted on a rounded sample holder of matching radius of curvature. To prevent the lens from moving during the measurement, the lens was covered with a silicone ring (polyvinylsiloxane; Provil Novo, Wehrheim, Germany). Lenses were measured in two positions: central and peripheral. For CoF measurement of the central clear region, we followed the clear lens method outlined in Sterner et al. 2016 approach. For CoF measurement of the peripheral region, the sample holder was modified so that the CL would be tilted approximately 45°, exhibiting its peripheral region and not its center, as the highest point (Fig. 1). For measurement of the back surface, the lenses were flipped (with the front surface on the concave side) using clean tweezers while still in the blister.28
FIG. 1.
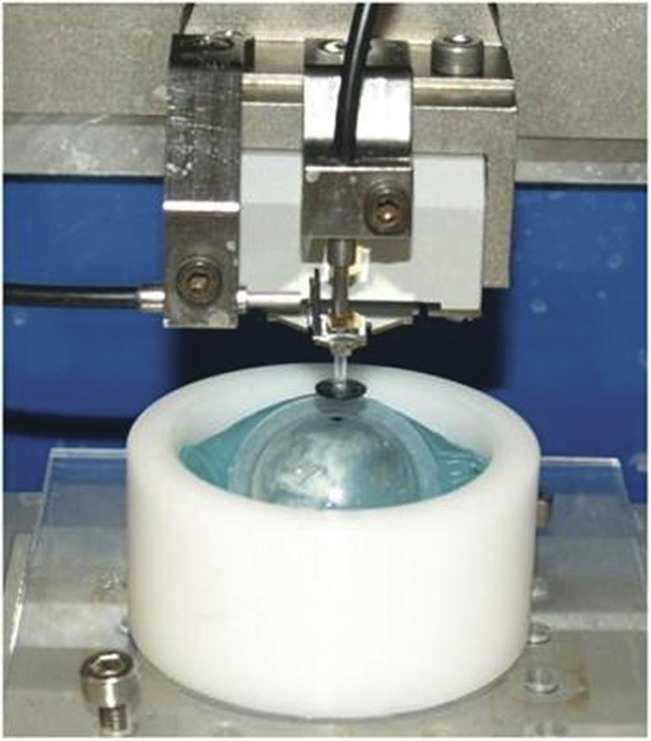
Position of the CL for peripheral region CoF measurement. CL, contact lens; CoF, coefficient of friction.
Friction data were acquired by means of a microtribometer (Basalt Must; Tetra, Germany) with cantilevers (Tetra) of normal spring constant of 15 to 16 N/m, and with a tangential spring stiffness of 12 to 15 N/m. Tangential forces were measured for 7 different normal forces ranging from 0.25 to 4 mN (force ramp). Three ramps, each one interlaced with 50 aging cycles at 2 mN normal force were recorded. The measured stroke length was 1 mm and the sliding speed was 0.1 mm/s. For data processing, experimentally determined lateral and normal force values were calculated by averaging 20 data points around 0.5 mm sliding distance to plot a graph and the CoF was determined from the slope. Data from the last normal force set (after a total of 100 aging cycles) were used for the analysis.
Atomic Force Microscopy Sample Preparation and Analysis Procedures
Lenses were cut on four periphery edges to flatten the lens sample. Atomic force microscopy measurements were performed on a Dimension Icon Atomic Force Microscope (Bruker Nano, Inc., Billerica, MA) in contact mode, using Sharpe Nitride Lever probes SNL-10 (force constant 0.06 N/m). The scanned area of the imaging sample was 20×20 μm. Lens samples and the AFM tip were kept hydrated by standard lens packaging solution (0.9% sodium chloride with borate buffer, pH∼7.4). All measurements were obtained under controlled room temperature at relative humidity of 50%. For each CL, at least three areas of 20×20 μm of the pigmented regions, three areas of 20×20 μm of the central clear (within the optical zone) regions of either the front or the back surface were sampled, depending on the pigment location. We sampled at least three lenses across different powers (−1.00D, −3.00, and −6.00D) from each brand. The Bruker NanoScope software was used for image processing and interpretation. We used a flatten tool from the image analysis menu before obtaining roughness measurement. Atomic force microscopy surface roughness is described by two parameters: average RMS described the average surface roughness of a given area; and peak-to-peak RMS described the difference between the highest and the lowest points of RMS on the surface.
Statistical Analysis
A mixed model for repeated measurements was used for the analysis of the CoF and RMS to compare all lenses. Data from CoF responses were normally distributed and analyzed using a linear mixed model with a normal distribution. Data from RMS responses were log normally distributed and analyzed using a generalized linear mixed model. In both models, location (front curve vs. back curve), pigment (pigmented vs. nonpigmented), and lens brand were included as fixed effects. In addition, all two-way and three-way interactions among location, pigment, and brand were included as fixed effect. Lens number within each brand was included as a random effect. Replicates nested within lens number and area numbers were modeled as random effects within each brand. Least square mean values and their corresponding 95% confidence intervals were estimated for each brand, location, and pigment combination. Results from the SEM image analysis were used to determine the appropriate pairwise comparisons between lens brands. Pairwise comparisons were made for each lens brand using the pigment surface location determined through SEM image analysis. For lens with pigments enclosed, the side where the pigments are closest to the lens surface was imaged. Because the AFM analysis was completed on the log-scale, the AFM estimates and their interval bounds were exponentiated to provide model-based estimates on the original, untransformed scale. Because multiple comparisons were considered, a simulation adjustment for alpha was completed to control the type I error rate at 5%. Significance is noted for simulation-adjusted P values of <0.05. The CoF and roughness data were aggregated for each lens, and correlation between CoF and roughness (RMS and peak-to-peak, respectively) was computed.
RESULTS
Pigment Location
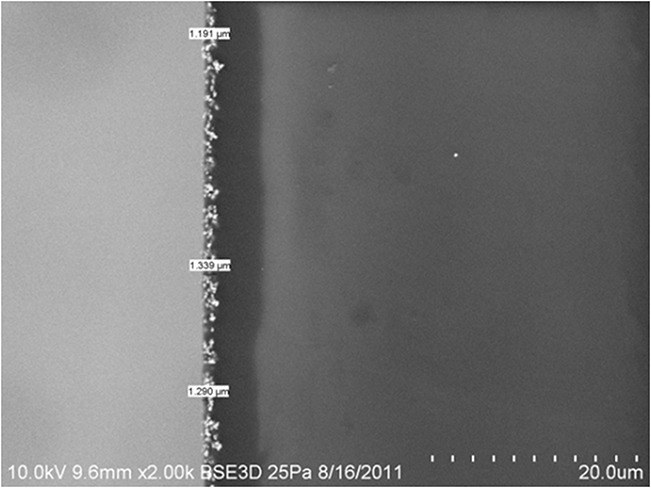
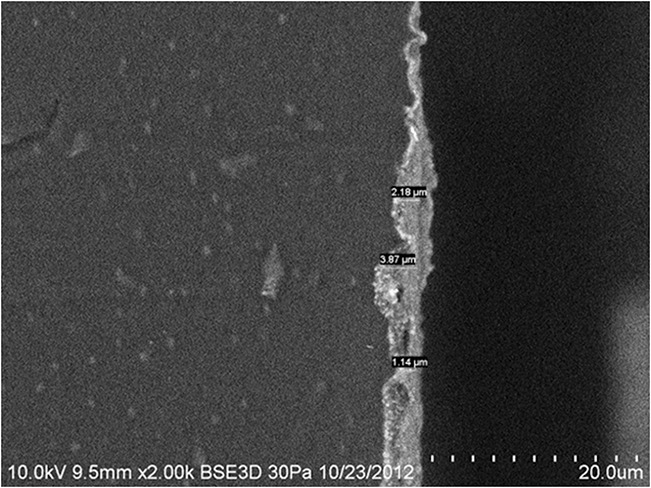
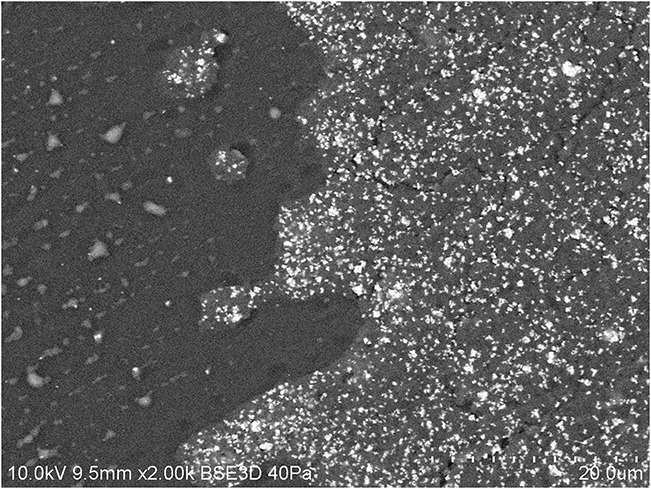
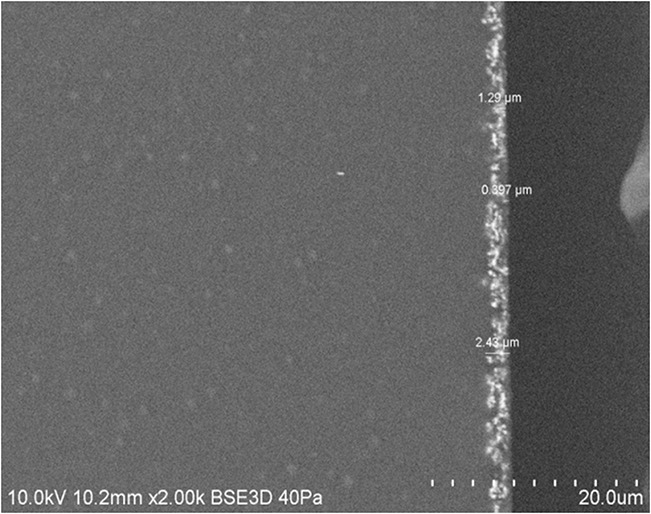
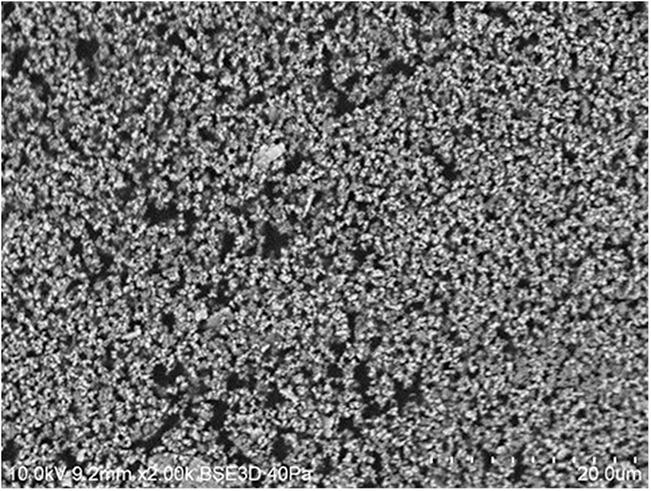
Average pigment depth was measured based on sampling locations from cross-sections. The average pigment depth from sampling at least three lenses was shown on Table 2. Lens A, etafilcon A with polyvinylpyrrolidone, had pigments located beneath the front surface of the lens. The other four lens types tested revealed pigments on either the front or the back surface. Lens B had pigment exposed on the front surface, whereas three other lens types (C, D, and E) had pigments exposed on the back surface based on SEM imaging results. Figures 2–11 show representative SEM images of each lens type. All SEM images shown are obtained from −3.00D lens power at 2000× magnification.
TABLE 2.
Pigment Location and the Average Depth From Lens Surface by SEM for Each Lens Type
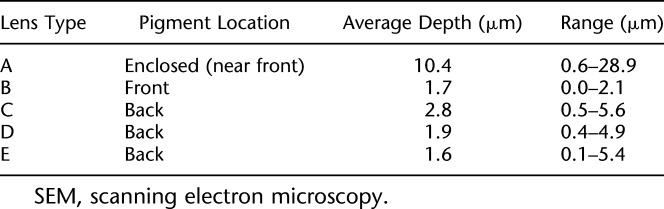
FIG. 2.
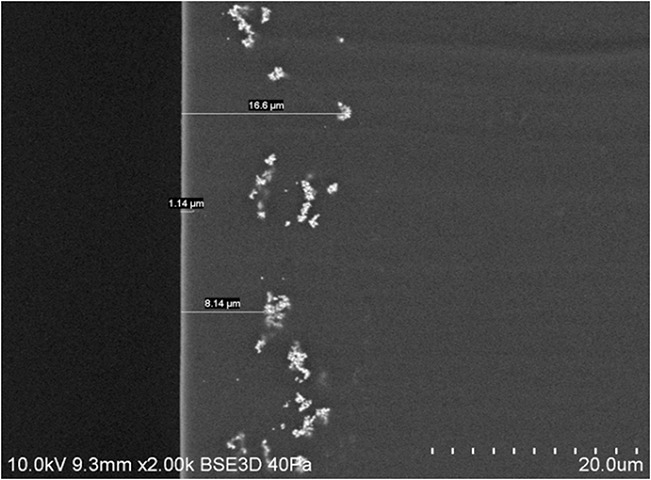
Scanning electron microscopy cross-section image of etafilcon A with PVP (lens A). PVP, polyvinylpyrrolidone.
FIG. 11.
Scanning electron microscopy image of lens E (CONCAVE side, top-down view).
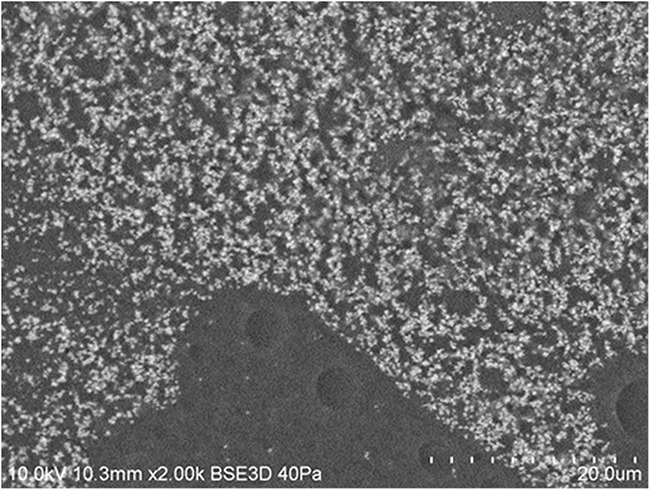
FIG. 3.
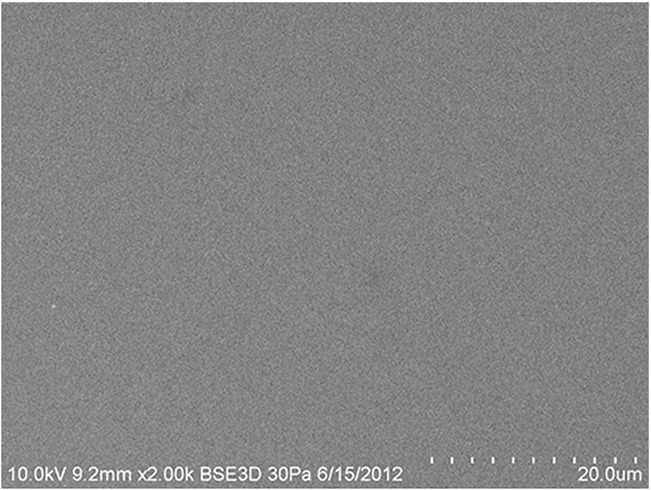
Scanning electron microscopy image of lens A (CONVEX side, top-down view).
FIG. 4.
Scanning electron microscopy cross-section image of hilafilcon B (lens B).
FIG. 5.
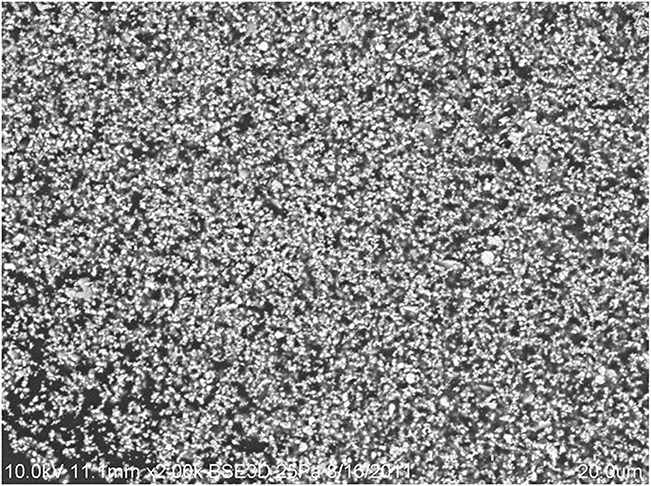
Scanning electron microscopy image of lens B (CONVEX side, top-down view).
FIG. 6.
Scanning electron microscopy cross-section image of 2 HEMA-EGDMA (lens C).
FIG. 7.
Scanning electron microscopy image of lens C (CONCAVE side, top-down view).
FIG. 8.
Scanning electron microscopy cross-section image of hefilcon A 1 day (lens D).
FIG. 9.
Scanning electron microscopy image of lens D (CONCAVE side, top-down view).
FIG. 10.
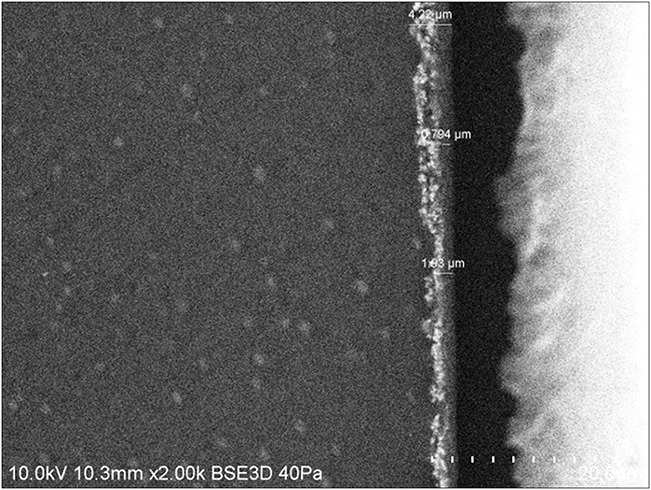
Scanning electron microscopy cross-section image of hefilcon A 2 weeks (lens E).
Coefficient of Friction
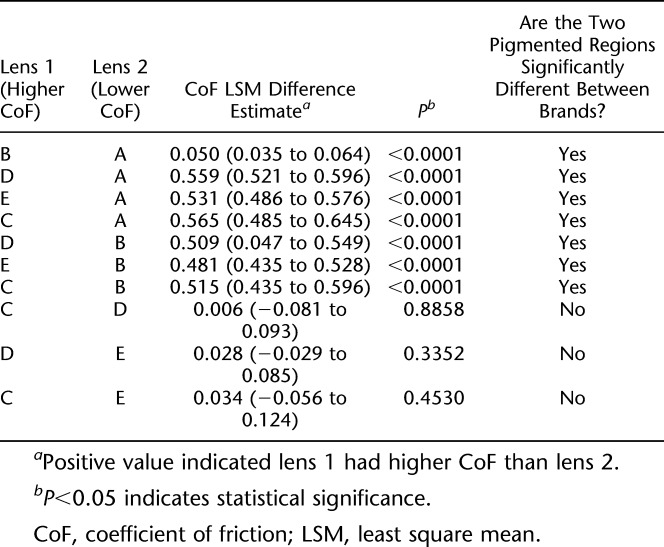
Lens A had no statistically significant difference between pigmented and clear regions (P=0.0124). Lenses B, C, D, and E, with pigments exposed on either the front or the back surface had statistically significant higher CoF in the pigmented regions compared with their clear regions (Table 3 and Fig. 12). Lens A had significantly lower CoF in its pigmented region than lenses B, C, D, and E (P<0.0001). Lens B had significantly lower CoF in its pigmented region than the pigmented regions in lenses C, D, and E (P<0.0001). The CoF of the pigmented regions among lenses C, D, and E was not statistically different from each other (Table 4).
TABLE 3.
Least square mean CoF Difference Between Pigmented and Clear Region Within Brand
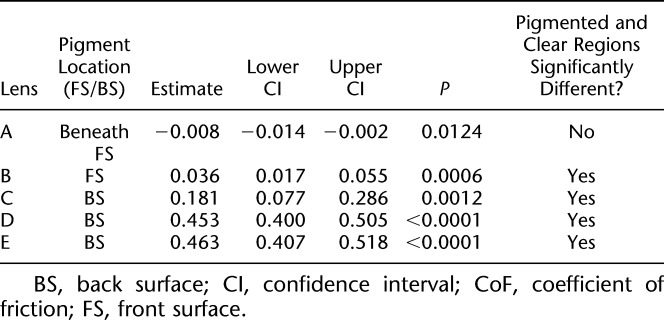
FIG. 12.
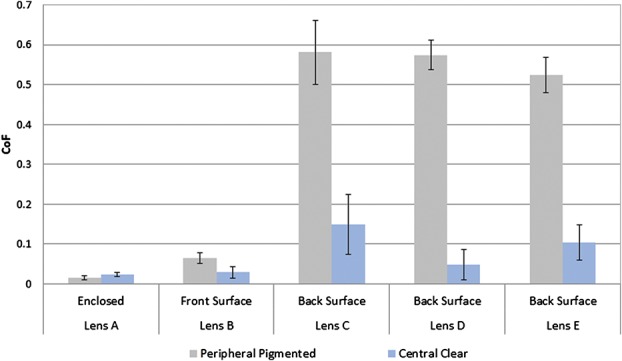
Model-based CoF and 95% CI of peripheral pigmented versus central clear regions of 5 lens brands. CI, confidence interval; CoF, coefficient of friction.
TABLE 4.
Compare CoF of Different Brands (Pigmented Regions Only)
Average Root-Mean-Square Roughness
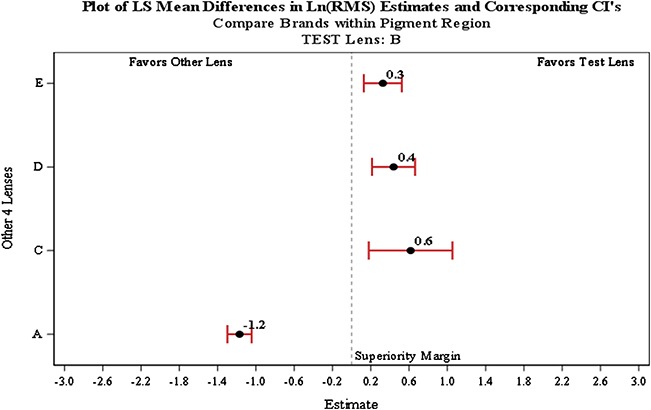
All lenses tested showed that their peripheral pigmented regions had statistically significant higher average RMS roughness surfaces compared with their clear regions (Table 5 and Figs. 13 – 14). Lens A had significantly lower average RMS value in its pigmented region compared with the pigmented regions in lenses B, C, D, and E (all P values<0.0001). Lens B had significantly lower average RMS in its pigmented region than lens C (P=0.0112), D (P=0.0012), and E (P=0.0018). The RMS roughness of the pigmented regions of the lens C, D, and E was not statistically different from each other (Table 6 and Figs. 15–18).
TABLE 5.
Average Roughness Least Square Mean Difference Ln(RMS) Estimates and Corresponding CI's

FIG. 13.
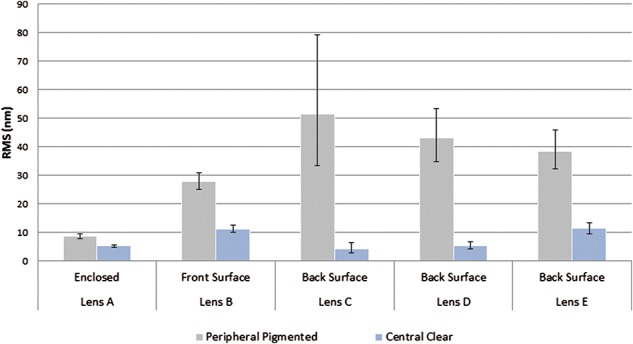
Model-based RMS surface roughness (nm) and 95% CI of peripheral pigmented versus central clear regions. CI, confidence interval; RMS, root-mean-square.
FIG. 14.
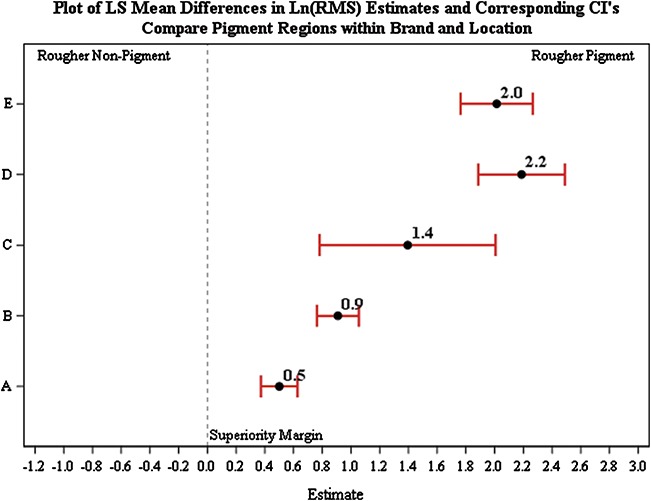
Least square mean difference in Ln(RMS) estimates and 95% CI of pigmented versus clear regions within brand. CI, confidence interval; RMS, root-mean-square.
TABLE 6.
Least Square Mean Difference Ln(RMS) Estimates and Corresponding CI's
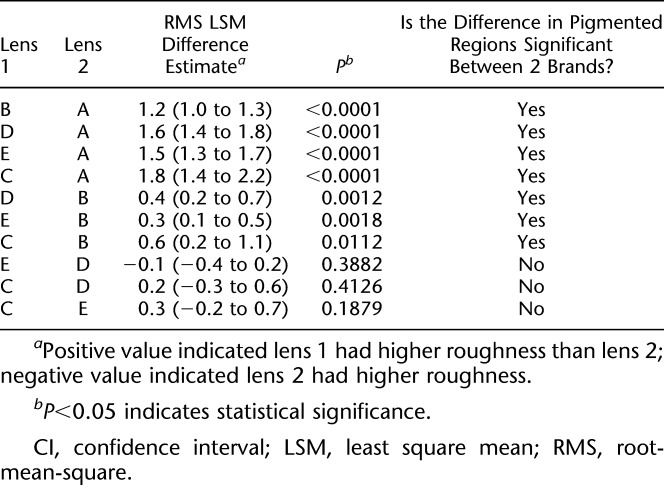
FIG. 15.
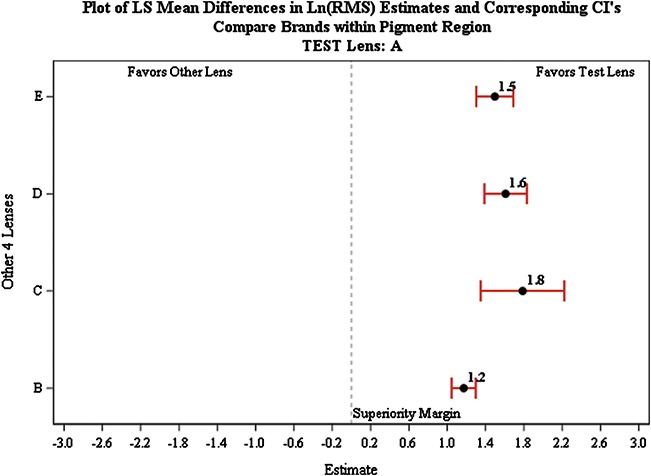
Compare LSM difference of lens A with four other lenses. CI, confidence interval; LSM, least square mean; RMS, root-mean-square.
FIG. 18.
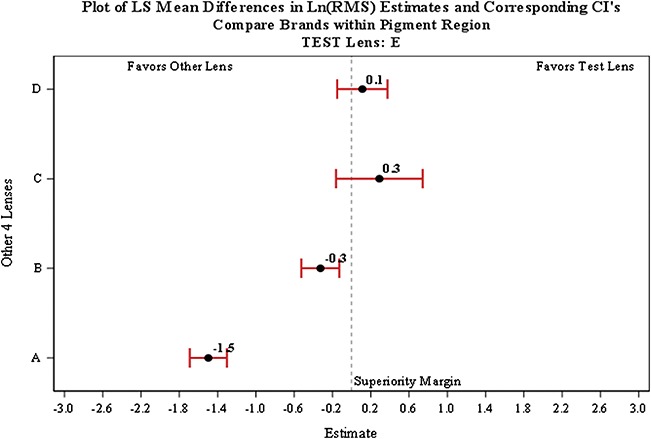
Compare LSM difference of lens E with four other lenses. CI, confidence interval; LSM, least square mean; RMS, root-mean-square.
FIG. 16.
Compare LSM difference of lens B with four other lenses. CI, confidence interval; LSM, least square mean; RMS, root-mean-square.
FIG. 17.
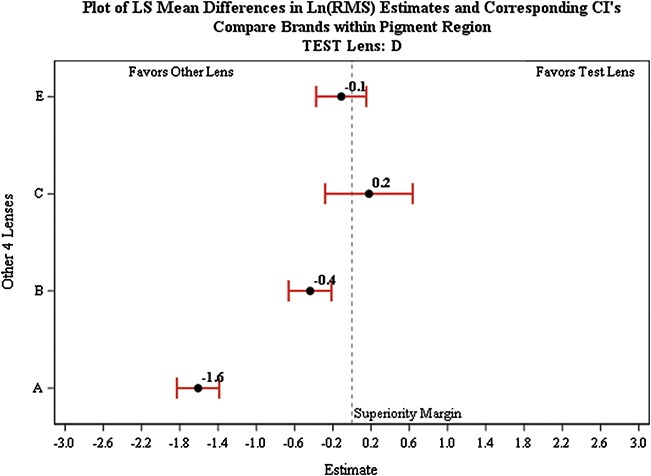
Compare LSM difference of lens D with four other lenses. CI, confidence interval; LSM, least square mean; RMS, root-mean-square.
Correlation Between Coefficient of Friction and Root-Mean-Square
In the pigmented regions, there was a statistically significant correlation between CoF and average RMS (r=0.91 P value=0.0301) (Fig. 19) and between CoF and peak-to-peak RMS (r=0.90, P value=0.035) (Fig. 20). These relationships were not demonstrable for clear regions between CoF and average RMS (r=−0.14, P value=0.65) and between CoF and peak-to-peak RMS (r=0.28, P value=0.83).
FIG. 19.
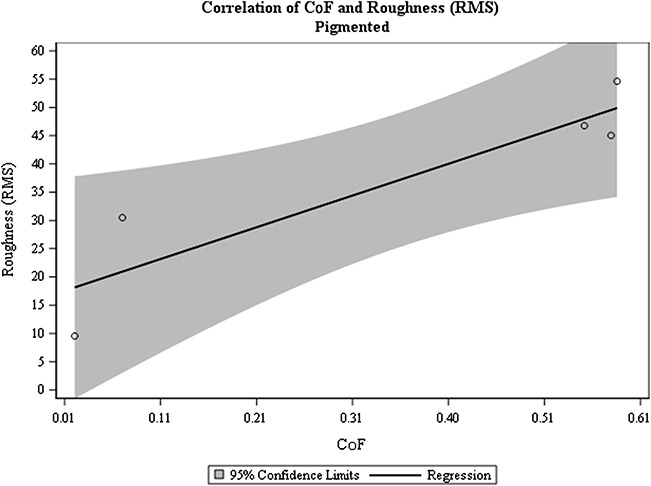
Correlation between CoF and average roughness in pigmented regions. CoF, coefficient of friction; RMS, root-mean-square.
FIG. 20.
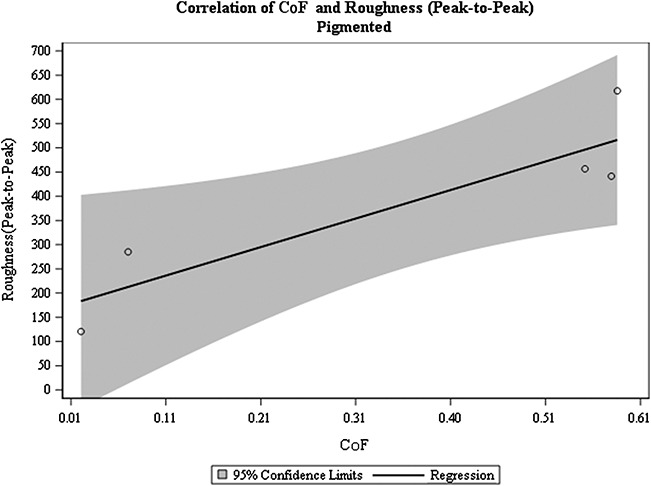
Correlation between CoF and peak-to-peak roughness in pigmented regions. CoF, coefficient of friction.
DISCUSSION
Coefficient of Friction and Pigment
In this investigation, we saw that lenses with pigments on the surface of the lens (front or back) had significantly higher CoF values in the pigmented regions than the clear regions. The lens type with pigment enclosed had no statistically significant difference in CoF between the pigmented and the clear regions. This provides a more consistent lens surface with similar lubricity between the clear and the pigmented regions, more closely resembling the lubricity of a clear, pigment-free lens.
Roughness and Pigment
Almost all clear regions of each brand had average RMS roughness around or below 10 μm. However, the average RMS roughness in the pigmented regions varied widely among different brands. Average RMS roughness ranged from below 10 μm in lens A, to as high as 50 μm in lens C. Although the lens type with pigment enclosed had a statistically difference between the pigmented and the clear regions (as with all other lens types), lens with pigment enclosed had the least difference in average RMS roughness between the clear and the pigmented regions.
Our study suggested that cosmetic lenses with the pigment enclosed provides a more consistent lens surface in lubricity and surface roughness between pigmented and clear regions compared with lenses that have pigments exposed on surfaces. Hence, a pigment-enclosed lens may more closely resemble the performance of a clear, pigment-free lens.
Correlation of Lubricity and Roughness and Its Potential Implication
We found a high correlation between CoF and average RMS (r=0.91) and peak-to-peak RMS (r=0.90) among the pigmented regions of the lens. From this experiment, we found that cosmetic lenses with pigments exposed had less lubricious and rougher surfaces in their pigmented region compared with the clear region. Clear, pigment-free CLs with a more lubricious surface have been associated with better end of day comfort.12,13 Therefore, lenses with surface pigments that have higher surface roughness and less lubricious surfaces may have lower performance in end of day comfort than lenses with pigment enclosed. This relationship remains to be confirmed with on-eye study.
Limitations
In our experiment, all our test lenses were hydrogel lenses without any additional surface treatment. Currently, there are only a few brands of silicone hydrogel beauty CLs available commercially and there are limited data from cosmetic silicone hydrogel CLs. Their performance in these tests remains unknown. In addition, it is unclear how surface treatment technology would impact CoF.
This study evaluated lubricity and surface roughness based on unworn lenses and in vitro testing results. Literature has reported the difference in lens lubricity and RMS surface roughness between worn and unworn lenses.24,29,30 Ngai's24 study suggested early stages of protein deposition that may help lubricate the lens–eyelid interface and reduce friction. The difference in physical dimensions, lens design, and materials can all contribute to differences in comfort or on-eye performance.
The simple linear regressions showed high correlation between CoF and average RMS and peak-to-peak roughness. However, it should be noted that this may be overestimated because of the lack of observations in the center of the regressed line. More data need to be collected to confirm our results.
CONCLUSION
Of the lenses tested here, cosmetic lenses with pigments enclosed in the lens matrix had similar (not statistically different) CoF between their clear and pigmented regions, thus, providing a more consistent surface compared with lenses that had exposed pigments on lens surface. Future clinical studies comparing the end of day comfort performance between cosmetic CLs with pigment-enclosed versus pigment-exposed lens should be investigated.
Footnotes
C. Lau, M. Mundorf, and K. Osborn Lorenz are employees of Johnson & Johnson Vision, Inc. K. Ebare was an employee at Johnson & Johnson Vision, Inc during the time of this work. S. Tosatti is a consultant of Johnson & Johnson Vision, Inc.
Supported by Johnson & Johnson Vision Inc.
Presented in part as a paper at Asia-ARVO, February 17, 2015, Yokohama, Japan and BCLA-Asia, September 13, 2016, Hong Kong, China.
REFERENCES
- 1.Singh S, Satani D, Patel A, et al. Colored cosmetic contact lenses. Cornea 2012;31:777–779. [DOI] [PubMed] [Google Scholar]
- 2.Mahittikorn A, Kittichathanakul T, To-Im J, et al. Knowledge, behavior, and free-living amoebae Contamination of cosmetic contact lens among University Wearers in Thailand: A cross-sectional study. Eye Contact Lens 2017;43:81–88. [DOI] [PubMed] [Google Scholar]
- 3.Efron N, Morgan P, Woods C. An international survey of daily disposable contact lens prescribing. Clin Exp Optom 2012;96:58–61. [DOI] [PubMed] [Google Scholar]
- 4.Maldonado-Codina C, Efron N. Impact of manufacturing technology and material composition on the surface characteristics of hydrogel contact lenses. Clin Exp Optom 2005;88:396–404. [DOI] [PubMed] [Google Scholar]
- 5.Chan KY, Cho P, Boost M. Microbial adherence to cosmetic contact lenses. Cont Lens Anterior Eye 2014;37:267–272. [DOI] [PubMed] [Google Scholar]
- 6.Lorenz K, Kakkassery J, Boree D, et al. Atomic force microscopy and scanning electron microscopy analysis of daily disposable limbal ring contact lenses. Clin Exp Optom 2014;97:411–417. [DOI] [PMC free article] [PubMed] [Google Scholar]
- 7.Jung JW, Han SH, Park SY, et al. Effects of pigment location in tinted contact lenses on the ocular surface. Optom Vis Sci 2016;93:997–1003. [DOI] [PubMed] [Google Scholar]
- 8.Watanabe T, Uematsu M, Mohamed YH, et al. Corneal erosion with pigments derived from a cosmetic contact lens: A case report. Eye Contact Lens Published Online August 16, 2016. 10.1097/ICL.0000000000000306. [DOI] [PubMed] [Google Scholar]
- 9.Hotta F, Eguchi H, Imai S, et al. Scanning electron microscopy findings with energy-dispersive x-ray investigations of cosmetically tinted contact lenses. Eye Contact Lens 2015;41:291–296. [DOI] [PMC free article] [PubMed] [Google Scholar]
- 10.Jung JW, Han SH, Kim SA, et al. Evaluation of pigment location in tinted soft contact lenses. Cont Lens Anterior Eye 2016;39:210–216. [DOI] [PubMed] [Google Scholar]
- 11.Jones L, Brennan NA, Gonzalez-Mejiome J, et al. The TFOS international Workshop on contact lens discomfort: Report of the contact lens materials, design, and care subcommittee. Invest Ophthalmol Vis Sci 2013;54:TFOS37–70. [DOI] [PubMed] [Google Scholar]
- 12.Brennan NA. Contact lens based correlates of soft lens wearing comfort. Optom Vis Sci 2009;86:e-abstract 90957. [Google Scholar]
- 13.Coles-Brennan C, Brennan NA. Coefficient of friction and soft contact lens comfort. Optom Vis Sci 2012;88:e-abstract 125603. [Google Scholar]
- 14.Ross G, Nasso M, Franklin V, et al. Silicone hydrogels: Trends in products and properties. Poster presented at: BCLA 29th Conference and Exhibition Poster; June 3, 2005; Brighton, United Kingdom.
- 15.Sterner O, Aeschlimann R, Zurcher S, et al. Friction measurements on contact lenses in a physiologically relevant environment: Effect of testing conditions on friction. Invest Ophthalmol Vis Sci 2016;57:5383–5392. [DOI] [PubMed] [Google Scholar]
- 16.Lee S, Spencer ND. Materials Science. Sweet hairy, soft, and slippery. Science 2008;319:576. [DOI] [PubMed] [Google Scholar]
- 17.Spencer ND, Glasson S. Aqueous lubrication with polymer brushes. In: Aqueous Lubrication: Natural and Biomimetic Approaches. Singapore, World Scientific Publishing Co, Pte Ltd, 2014. 10.1142/9789814313773_0006. [DOI] [Google Scholar]
- 18.Spencer N. Aqueous lubrication with poly (ethylene glycol) brushes. Tribol Online 2014;9:143–153. [Google Scholar]
- 19.Spencer ND, Tysoe WT. Left of the Stribeck Curve. J Tribol 2012;68:96. [Google Scholar]
- 20.Pult H, Tosatti S, Spencer ND, et al. Spontaneous blinking from a tribological viewpoint. Ocul Surf 2015;13:236–249. [DOI] [PubMed] [Google Scholar]
- 21.Roba M, Duncan EG, Hill GA, et al. Friction measurements of contact lenses in their operating environment. Tribol Lett 2011;44:378–397. [Google Scholar]
- 22.Rennie AC, Dickrell PL, Sawyer WG. Friction coefficient of soft contact lenses: Measurements and modeling. Tribol Lett 2005;18:499–504. [Google Scholar]
- 23.Zhou B, Li Y, Randall NX, et al. A study of the frictional properties of senofilcon-A contact lenses. J Mech Behav Biomed Mater 2011;4:1336–1342. [DOI] [PubMed] [Google Scholar]
- 24.Ngai V, Medley J, Jones L, et al. Friction of contact lenses: Silicone hydrogel versus conventional hydrogel. Tribol Interf Eng Ser 2005;48:371–379. [Google Scholar]
- 25.Sterner O, Aeschlimann R, Zurcher S, et al. Tribological classification of contact lenses: From coefficient of friction to sliding work. Tribol Lett 2016;63:1–13. [Google Scholar]
- 26.Samsom M, Chan A, Iwabuchi Y, et al. In vitro friction testing of contact lenses and human ocular tissues: Effect of proteoglycan 4 (PRG4). Tribol Int 2015;89:27–33. [Google Scholar]
- 27.Wilson Tq, Aeschlimann R, Tosatti S. Coefficient of friction of human corneal tissue. Cornea 2015;34:1179–1185. [DOI] [PubMed] [Google Scholar]
- 28.Tosatti S, Aeschlimann R, Lorenz K, et al. Dynamic Coefficient of Friction of Limbal Ring Contact Lenses. Poster presented at BCLA Annual Clinical Conference and Exhibition Poster; June 7, 2014. Brimingham, UK. [Google Scholar]
- 29.Bhatia S, Goldberg E, Enns JB. Examination of contact lens surfaces by atomic force microscopy (AFM). CLAO 1997;23:264–269. [PubMed] [Google Scholar]
- 30.Baguet J, Sommer F, Duc T. Imaging surfaces of hydrophilic contact lenses with the atomic fore microscope. Biomaterials 1993;14:279–284. [DOI] [PubMed] [Google Scholar]