

Supplemental Digital Content is available in the text.
Keywords: blood pressure, cardiovascular diseases, hypertension, primary health care, quality improvement
Abstract
Better blood pressure (BP; mm Hg) control is a pivotal national strategy for preventing cardiovascular events. Measure accurately, Act rapidly, and Partner with patients (MAP) with practice facilitation improved BP control (<140/<90 mm Hg) from 61.2% to 89.8% during a 6-month pilot study in one primary care clinic. Current study objectives included evaluating the 6-month MAP framework in 16 Family Medicine Clinics and then withdrawing practice facilitation and determining whether better hypertension control persisted at 12 months since short-term improvements often decline by 1 year. Measure accurately included staff training in attended (intake) BP measurement and unattended automated office BP when intake BP was ≥140/≥90 mm Hg. Act rapidly (therapeutic inertia) included protocol-guided escalation of antihypertensive medications when office BP was ≥140/≥90 mm Hg. Partner with patients (systolic BP decline/therapeutic intensification) included shared decision making, BP self-monitoring, and affordable medications. Study data were obtained from electronic records. In 16 787 hypertensive adults (mean, 61.2 years; 54.1% women; 46.0% Medicare) with visits at baseline and first 6 months, BP control improved from 64.4% at baseline to 74.3% (P<0.001) at 6 and 73.6% (P<0.001) at 12 months. At the first MAP visit, among adults with uncontrolled baseline BP and no medication changes (n=3654), measure accurately resulted in 11.1/5.1 mm Hg lower BP. During the first 6 months of MAP, therapeutic inertia fell (52.0% versus 49.5%; P=0.01), and systolic BP decreased more per therapeutic intensification (−5.4 to −12.7; P<0.001). MAP supports a key national strategy for cardiovascular disease prevention through rapid and sustained improvement in hypertension control, largely reflecting measuring accurately and partnering with patients.
Hypertension is a major, modifiable risk factor for cardiovascular and renal disease, contributing to >410 000 US deaths during 2014.1 In 2010, ischemic heart disease and stroke were the first and third leading contributors to years of life lost.2 Improving hypertension control is a strategic pillar in national initiatives to reduce the burden of cardiovascular disease. Target: BP and Million Hearts 20223,4 aim to control hypertension in 70% and 80%, respectively, of all adults receiving health care.
Hypertension control to <140/<90 mm Hg has risen in the United States from 32% in 1999 to 2000 to 53% in 2011 to 2014 among all US adults with hypertension.5,6 Among patients treated for hypertension, blood pressure (BP; mm Hg) control to <140/<90 mm Hg rose from ≈54% in 1999 to 2002 to ≈70% in 2007 to 2014.5,6 Yet, the burden of uncontrolled hypertension remains high.3–6 Closing that gap requires practical, scalable, and sustainable interventions that identify and control more adults with hypertension, especially in primary care settings. Quality improvement programs become even more important if the new hypertension control target of <130/<80 mm Hg in the American College of Cardiology/American Heart Association 2017 Hypertension Guideline is widely adopted.7,8
Many quality improvement programs to raise hypertension control were studied during the past 4 decades.9,10 Team-based care, including nurse clinicians and pharmacists collaborating with a physician, consistently improved hypertension control. Yet, additional skilled clinicians are unavailable in many clinical settings. Moreover, better hypertension control during the first 6 months with quality improvement programs is often not sustained at 1 year.11
Measure accurately, Act rapidly, and Partner with patients (MAP) is a 6-month quality improvement program,12–14 which includes practice facilitation, to increase hypertension control. MAP was designed and adapted for ambulatory, out-patient clinical settings without additional personnel typical of team-based care interventions. Our pilot study showed robust improvement in hypertension control after 6 months of MAP in a single, resource-limited healthcare setting serving disproportionately minority patients with Medicaid health insurance.13 Objectives for the current study included determining whether (1) MAP was effective in a larger number of diverse Family Medicine practice sites, and (2) improvement in hypertension control at 6 months with practice facilitation persisted at 12 months, 6 months after practice facilitation ended.
Methods
Study Design and Regulatory Considerations
Our MAP study used a quasiexperimental, pre- versus poststudy design. The study protocol was approved by the local institutional review board, which granted a waiver from documented informed consent, as it used evidence-based guidelines with usual clinical management of hypertension. To minimize the possibility of unintentionally sharing information that can be used to reidentify private information, and the sensitive nature of the data, data to verify key study outcomes are available on request to the corresponding author from qualified researchers trained in human subjects research with documented approval from an institutional review board.
The development and stream-lining of MAP have been described.12–14 Approximately 20 hours of practice facilitation was provided to each clinical site during the first 6 months of MAP by a single trained individual. Goals of facilitation were to provide education, support, and logistical problem-solving necessary to incorporate MAP into the unique patient flow operations of each clinical site. Staff at each site was aware that MAP was an ongoing quality improvement program, which continued beyond 6 months of practice facilitation. Practice managers and clinicians continued receiving monthly dashboards reports (Figure S1 in the online-only Data Supplement). Implementation of MAP was facilitated by an overarching logic model (Figure S2).
Setting
The study was conducted at 16 diverse, community-based clinical sites in the Department of Family Medicine, Greenville Health System, Greenville, SC.
Inclusion and Exclusion Criteria
The study included adults 18 to 85 years with diagnosed hypertension. Eligible patients had at least 1 office visit with recorded BP during the baseline period from February 1, 2015, to April 30, 2016. Patients in the outcome analysis had at least 1 visit with recorded BP during MAP (June 1, 2016–November 30, 2016). The 6-month follow-up period (months 7–12) without practice facilitation included visits between December 1, 2016, and May 31, 2017. Adults exempt from the National Quality Foundation-18 hypertension control measure were excluded.15
Clinical Measurements
Patient-level data were extracted from the electronic health record system. During baseline, BP was measured according to usual practice at each site and did not include automated office (AO) BP. During the baseline, hypertension control was defined by attended BP <140/<90 mm Hg. BP control during MAP was defined by initial attended or AOBP <140/<90 mm Hg. The BP values from the last visit during the baseline and the first and second 6-month MAP periods were used to determine hypertension control. The most recent baseline height and weight were used to calculate body mass index (kg/m2).
Accurate BP Measurement
Initial attended BP: Staff was trained to measure BP according to protocol.16 A single BP was obtained after the patient was seated for 5 minutes in a semiprivate area and entered into the electronic health record system. BP readings <140/<90 mm Hg were accepted as the final BP value for that visit. Initial attended BP values ≥140 mm Hg systolic and ≥90 mm Hg diastolic led to a protocol recommendation for unattended AOBP.
Unattended AOBP17 was performed in the patient’s exam room or another private location. Using established methods, staff promptly obtained one BP reading to insure the Omron HEM-907XL (Hoffman Estates, IL) was working properly. After initiating a series of 3 additional readings at 1-minute intervals and without additional rest, the staff member left the room. When unattended AOBP was completed, the staff member returned and entered the mean of the 3 AOBP values into the electronic health record system.
Defining Key Process Variables
Measure accurately was assessed in adults with hypertension (1) as the proportion of visits with the mean of unattended AOBP values relative to the number of visits with an initial attended BP ≥140/≥90 mm Hg, (2) by the difference between baseline attended BP and BP at the first MAP visit (attended and AOBP) in subjects without any changes in antihypertensive medications at the baseline visit, and (3) within visit as the difference between attended BP and AOBP in patients with attended BP ≥140/≥90 mm Hg.
Act Rapidly was defined by the therapeutic inertia index, calculated as the proportion of visits in which no changes were made to the number or dose of antihypertensive medications relative to the number of visits with uncontrolled BP.18
Partner with patients was defined by comparing changes in systolic BP in the 2 to 8 week window after each therapeutic change during the baseline and first 6 months of MAP. Additional therapeutic changes during the 2 to 8 week window triggered a new assessment period.
Monthly Dashboard for Physicians and Staff
Each clinician was provided a monthly report on their BP control rate and measures for the 3 process variables for their panel of hypertensive adults (Figure S1). Time trends and patient-level data for each metric were available to clinicians and staff to facilitate management of uncontrolled hypertensive patients.
Statistical Analysis
Descriptive statistics were used to summarize baseline demographic and clinical characteristics of hypertensive patients. Data are reported as sample number and percentage or mean and SEM. The primary outcome variable was the change in hypertension control from baseline to the 6- and 12-month time points. Analyses at 12 months were conducted both with and without last observation during months 1 to 6 carried forward for patients without a clinic visit during months 7 to 12. Additional outcome variables included the change in systolic BP and the 3 process variables.
Pooled t tests were performed to assess differences in demographic and clinical characteristics between patients with a baseline visit and at least one visit during the first 6 months of MAP versus patients with only a baseline visit. The χ2 tests were used to examine racial differences in control rates at each of the 3 evaluation periods The Cochran-Armitage trend test was used to examine trends over time in hypertension control rates before MAP. Dependent group t tests and McNemar tests were used to assess longitudinal outcomes and process measures related to measure accurately, act rapidly, and partner with patients. All analyses were performed with 2-tailed tests using SAS/STAT software.
Results
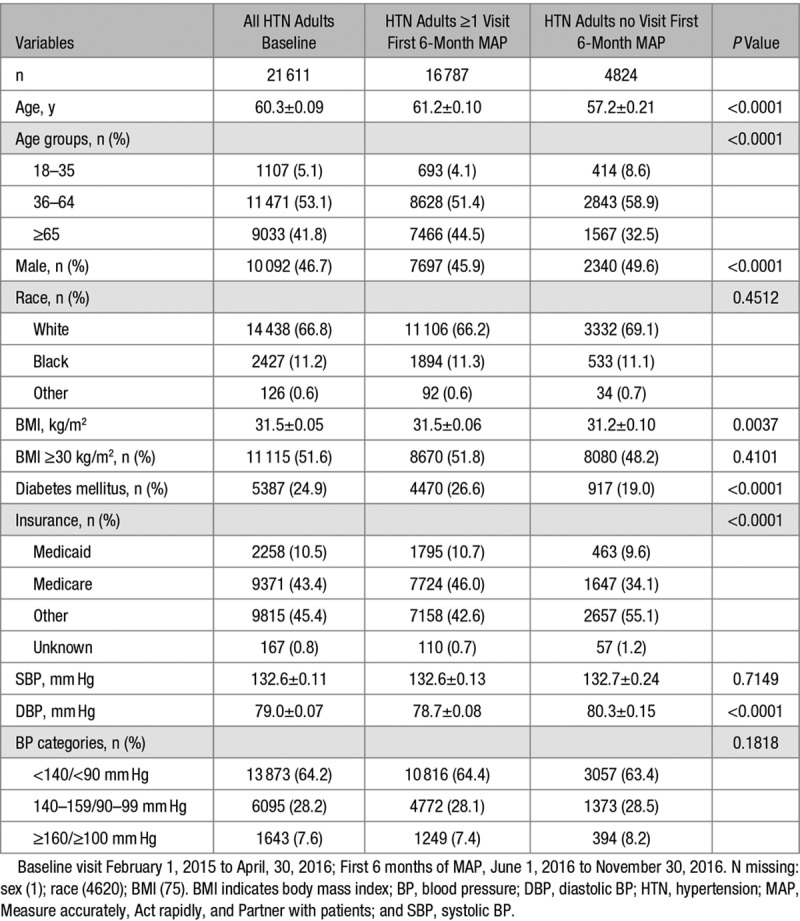
A total of 21 611 hypertensive adults had a baseline visit from February 2015 to April 2016. Among the group, 16 787 (77.7%) did and 4824 (22.3%) did not have a clinic visit during the first 6 months of MAP. When comparing these 2 groups (Table 1), patients seen only during the baseline were more often men and <65 years of age and less likely to have Medicare or Medicaid insurance or diabetes mellitus. Among 4824 patients seen at baseline but not during the first 6 months of MAP, 1691 (35%) had clinic visits during months 7 to 12. Per protocol, this group was not included in the primary analysis. The protocol did not include follow-up data beyond 12 months to determine whether patients seen at baseline but not months 1 to 12 were seen subsequently.
Table 1.
Baseline Characteristics of All Adults With Hypertension and the Subsets With and Without a Visit During the First 6 Months of MAP
Diversity of hypertensive patients at the 16 participating clinics is evident in Table S1. The number of diagnosed hypertensive adults 18 to 85 years ranged from 366 to 2566; percentages of hypertensive adults 18 to 35 years varied from 2.6% to 8.2% and ≥65 years from 28.8% to 55.7%. Minority race ranged between 0.1% and 28.2%, Medicaid insurance from 2.2% to 25.9%, and Medicare from 30.6% to 51.2%.
At baseline, BP was controlled in 64.2% of 21 611 hypertensive adults, including 64.4% of those with and 63.4% in those without a visit during the first 6 months of MAP (Table 1). Data were available for 2 years before MAP from 11 of 16 sites and revealed that BP control was 66.3% in 2014 to 2015, 67.7% in 2015 to 2016, and 66.2% in the baseline period (P for trend=0.8). Among all patients with a visit at baseline and during the first 6 months of MAP, BP decreased from 132.6/78.7 mm Hg at baseline to 130.7/77.2 mm Hg (−1.9/−1.5, P<0.001; Table 2; Figure). The net BP change reflects higher BP (4.9/1.3 from 124/75 to 129/76 mm Hg [not shown]) in hypertensive adults controlled at baseline and lower BP (−11/−5; Table 3) among those uncontrolled at baseline.
Table 2.
BP Values and Hypertension Control Rates at the Past Visit of the Baseline and After Months 1 to 6 and 7 to 12 of MAP
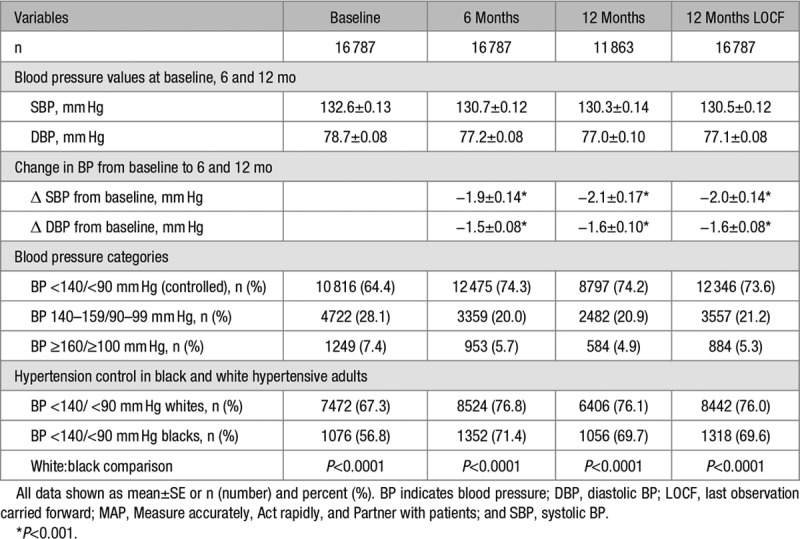
Table 3.
The Impact of MAP on the 3 Key Process Metrics Between Baseline and 6 Months Among Hypertensive Adults Who Were Uncontrolled at Baseline (n=5971)
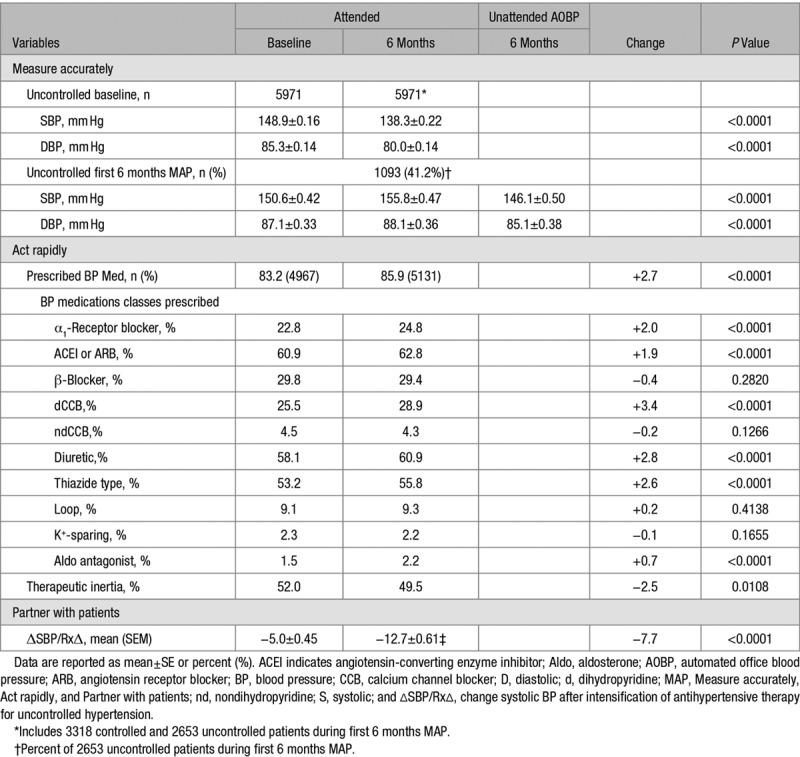
Figure.
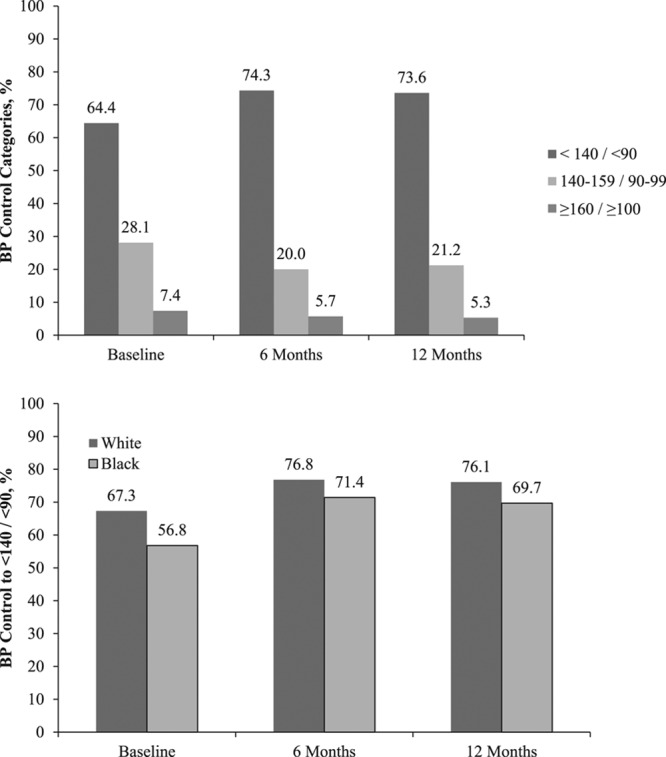
Changes in hypertension levels and control over time. Top, Hypertension control rates to <140/<90 mm Hg are shown at baseline, 6 months and 12 months with last observation carried forward. The percentages of patients with uncontrolled hypertension and systolic blood pressure (BP) 140 to 159 mm Hg and diastolic BP 90 to 99 mm Hg as well as ≥160 mm Hg systolic and ≥100 mm Hg diastolic are also shown. Bottom, BP control rates to <140/<90 mm Hg are shown separately for black and white adults for the 3 time periods.
Of 10 816 patients controlled at baseline, 8851 (81.8%) were controlled at 6 months. Of 5971 patients uncontrolled at baseline, 3624 (60.7%) were controlled at 6 months. And, at their last visit during the first 6 months of MAP (Table S2), 11 744 hypertensive patients (70.0%) were in control based on a single attended BP value. By AOBP, part of measure accurately, an additional 731 patients with an elevated attended BP had a nonhypertensive AOBP value (146.9/84.0 to 129.2/76.8 mm Hg; change −17.7/−7.1), resulting in overall control of 74.3%. For 1400 uncontrolled patients with an elevated confirmatory AOBP, their attended BP was 157.5/88.5 mm Hg versus AOBP 151.7/86.8 mm Hg (−5.8/−1.9 mm Hg). Among patients uncontrolled at baseline who remained on their same medications at the first MAP visit, measured BP declined from 148.1/84.5 to 137.0/79.4 mm Hg, a fall of 11.1/5.1 mm Hg, another proxy for measure accurately.
For patients (n=11 863) with a visit in both months 1 to 6 and 7 to 12, their last BP in months 7 to 12 was 130.3/77.0 mm Hg and 74.2% were controlled to <140/<90 mm Hg (Table 2). When individuals with visits in months 1 to 6 but no visits in months 7 to 12 were added to those with visits in both periods, that is, last BP observation during months 1 to 6 carried forward, mean BP was slightly higher at 130.5/77.1 mm Hg and control to <140/<90 mm Hg slightly lower at 73.6%. At baseline, BP control was higher in white than black hypertensives (67.3% versus 56.8%; P<0.001). Racial differences in hypertension control persisted at 6 and 12 months of MAP. The rise in BP control from baseline to 6 months was significantly greater in black than white adults (+14.6% versus +9.5%; P=0.0004).
Table 3 compares characteristics between the baseline and last visit in the 6 month period visit for 5971 adults seen during the intervention who had uncontrolled baseline BP. On average, their BP declined from 149/85 mm Hg at baseline to 138/80 mm Hg by the last visit (−11/−5 mm Hg; P<0.0001/<0.0001).
In uncontrolled hypertensives, therapeutic inertia, a proxy for act rapidly, declined slightly (52.0% versus 49.5%; P=0.01). Percentages of patients on various classes of BP medications rose moderately and significantly (P<0.0001) except for β-blockers, nondihyrdropyridine calcium antagonists, potassium-sparing, and loop diuretics. The decline in systolic BP for each therapeutic intensification in uncontrolled patients, a proxy for partnering with patients, showed a greater fall during the intervention than baseline period (−12.7 versus −5.0 mm Hg; P<0.0001).
Discussion
Our MAP study in 16 Family Medicine clinics confirmed a clinically and statistically significant improvement in BP as reported in our pilot study.13 Hypertension control increased from 64.4% to 74.3% (P<0.0001) in 16 787 hypertensive adults in only 6 months (Figure). Absolute hypertension control rates improved 9.9% although the increase was smaller than the absolute increase of 28.6% in our single site pilot.13 Implementing the project across multiple sites yielded significant but less dramatic changes than the pilot study.
The successful pilot study prompted simultaneous implementation of MAP at all 16 affiliated clinics rather than the planned staged implementation based on readiness. We speculate that turnover of key personnel and adoption of a new electronic health record system at several sites limited the improvement in BP control. Despite these real-life challenges, BP control improved to ≈3 of every 4 adults with hypertension. This control level exceeds the 70% threshold in 2017 for recognition in Target: BP, a national initiative of the American Heart Association and American Medical Association to improve hypertension control using the MAP framework.3,12,13
Measure Accurately
The practice facilitator sought to train and equip practice staff on proper BP measurement methods for intake BP and AOBP when the initial attended value was high. Before MAP, staff at virtually all practice sites obtained a single attended screening value. A protocol including repeated attended BP when the initial value was high would likely have resulted in a higher percentage of patients with mean BP <140/<90 mm Hg and reduced the requirement for unattended AOBP. Reclassification to nonhypertensive values with repeated readings occurred in up to one-third of NHANES (National Health and Nutrition Examination Survey) participants with initial values of 140 to 159/90 to 99 mm Hg.19
Clinic staff preferred unattended AOBP in the examination room to repeated attended measurements in the patient screening area, which was typically busy. Clinicians also reported having more confidence in the AOBP values and personally rechecked elevated AOBP readings less often than single attended BP values. Because more than half of patients with an elevated attended value did not have AOBP, optimization of the BP measurement protocol is required.
In 2131 hypertensive patients with an elevated attended BP, AOBP was lower (Table S2), a proxy for measure accurately, which essentially eliminates the office effect.17 AOBP declined more in the 731 hypertensives (34.3%) with AOBP <140/<90 mm Hg than in the 1400 hypertensives that sustained high values (−17.7/−7.2 versus −5.8/−1.8 mm Hg; P<0.0001/0.0001). The data suggest that adults with uncontrolled attended office BP and controlled AOBP values have a greater office effect than those who sustain high AOBP.17 Another proxy for measure accurately showed that BP fell 11/5 mm Hg between the last baseline and first MAP visit in 3654 uncontrolled patients with no change in BP medications between the 2 visits; 2069 (56.6%) were controlled. Thus, MAP improved BP control, in part, by reducing pseudouncontrolled hypertension.
Act Rapidly
When office BP was ≥140 mm Hg systolic or ≥90 mm Hg diastolic, which included AOBP, the practice facilitator encouraged clinicians to implement the protocol for therapeutic intensification. As measured by the therapeutic inertia index, clinicians were only slightly more likely to intensify therapy during MAP than the baseline period. Thus, lower therapeutic inertia likely had a minimal impact on improving BP control.18,20 Therapeutic inertia in this study was lower than in earlier reports,13,18,20 which found this variable was a key barrier to BP control. The BP-lowering effect of adding a BP medication from a different drug class at half-maximal dose is greater than titrating the dose of a current BP medication from half-maximal to maximal dose.21 We plan to educate clinicians on this point and change the therapeutic inertia index to therapeutic intensity index to better reflect efficacy of the antihypertensive drug regimen.
Partner With Patients
The practice facilitator emphasized patient engagement including office visits or other contact monthly in patients with uncontrolled BP, shared management decisions, prescribing affordable and single-pill antihypertensive medications, and BP self-monitoring.22–27 The decline in systolic BP after intensifying antihypertensive therapy for uncontrolled hypertension more than doubled from the baseline period to the first 6 months of MAP (Table 3), which suggests that adherence to BP management improved.
Barriers to Quality Improvement
Cost and complexity are major barriers to translating evidence into clinical practice.28 The simplicity of MAP emerges as a key to success. MAP aimed to enhance team-based care but was not dependent on additional personnel, that is, each clinic implemented MAP with existing clinicians and staff (Table S1).9,10 None of the clinics reduced patients seen for the MAP intervention. We estimated the costs for training (20 hours practice facilitation+40 hours preparation, travel, intervisit communication) and equipping (1 BP monitor/1000 patients) a clinic with 1000 hypertensive adults at ≈$3600. Clinics were receiving monthly dashboard reports, which required minimal changes for MAP, that is, addition of AOBP frequency when initial BP was elevated and BP change with therapeutic intensification.
Each clinician received a monthly summary report (Figure S1) with their performance on the 3 process metrics and hypertension control rates. Patient-level data were available for each metric to facilitate individual patient and population management. Each of the 3 MAP components reflects a readily explainable and implementable process accompanied by a single process metric to evaluate progress (Figure S2).
Hypertension control improved from 64.4% at baseline to 74.2% and 73.6% at 1 year without and with last observation carried forward, respectively. Systolic BP fell only 2 mm Hg from 132.6 mm Hg at baseline to 130.5 mm Hg at 1 year. The relatively modest net BP change reflects the composite of an increase of BP (4.9/1.3 mm Hg) among hypertensive adults controlled at baseline and a fall of BP (−11/−5 mm Hg) among those with uncontrolled baseline BP. When patients are separated into groups based on biological measures with variability, for example, BP or cholesterol, those with higher values tend to decline, whereas those with lower values tend to increase even without an intervention, that is, regression to the mean.29 Regression to the mean will not lead to significant improvements in overall control. Of note, the mean systolic BP of 130.5 mm Hg with 73.6% controlled at 1 year compares favorably with the mean systolic BP of 130.1 mm Hg and 72.2% controlled to <140 mm Hg among treated hypertensive adults in NHANES 2009 to 2012.5
A pooled analysis of 3 cluster-randomized trials of health systems level interventions to improve hypertension control indicated that improvement in the first 3 to 6 months was not sustained at 12 months.11 In this study, the primary outcome included BP control at both 6 and 12 months after implementing MAP. Most of the improvement in hypertension control observed at 6 months was retained at 12 months despite withdrawal of practice facilitation after 6 months (Figure). Thus, 6 months of practice facilitation combined with ongoing monthly reports (Figure S1) including patient-level data appears sufficient to sustain meaningful improvement in hypertension control. With successful completion of the MAP framework and 2 pilot studies,12–14 the 3 components of the MAP protocol and logic model (Figure S2) were adapted to support Target: BP, a national hypertension quality improvement initiative of the American Heart Association and American Medical Association.3
Hypertensive adults in the current study were mainly white adults with Medicare or private insurance. Black adults typically have lower hypertension control rates than whites,5,6 and this disparity was confirmed at baseline (Table 2). Hypertension control improved more among black than white adults in this study during the first 6 months of MAP, yet racial differences in control persisted at 6 and 12 months. Thus, MAP appears to be at least as effective for improving BP control in black as in white adults with hypertension.13
It is important to assess our 6- and 12-month MAP results in the context of other quality improvement projects in hypertension. Team-based care is among the most effective interventions for controlling BP.9,10 Additional staffing typical of team-based care was relatively limited among clinics in this study (Table S1). Ten clinics had at least a part-time nurse clinician, 5 had between 1 and 3 physician’s assistants, and 2 had neither; 5 clinical sites had at least a part-time registered nurse, all but 1 had medical assistants, 2 had a part-time pharmacist, but none had registered dietitians, patient coaches, or community health workers. Despite these limitations, clinicians and staff worked together to obtain AOBP measurement in >40% of patients with an elevated attended BP and to engage patients in their management plan as assessed by the fall in BP per therapeutic intensification.
Study limitations include assessment of baseline hypertension control by usual office BP rather than protocol-based BP measurements. More than 20% of hypertensive patients seen at baseline did not have a visit during the first 6 months of MAP with a similar loss to follow-up in the second sixth months. Loss to follow-up was partially a function of study design as some patients with a baseline visit were seen in months 7 to 12 but not 1 to 6 (n=1691). To minimize apparent loss to follow-up, we may modify evaluation of MAP to include these patients. In addition, we plan to test whether assisting practices in developing a systematic process for contacting and rescheduling hypertensive patients who miss appointments will limit loss to follow-up. Health insurance, either public or private, is also important in frequency of healthcare, as well as hypertension treatment and control.30
Previous studies indicate that unattended AOBP without additional rest approximates usual daytime out-of-office BP.17 Daytime out-of-office BP 135/85 mm Hg is roughly equivalent to attended office BP 140/90 mm Hg. To minimize complexity, we elected a BP goal of <140/<90 mm Hg for both attended and AOBP values. The SPRINT (Systolic Blood PRressure INtervention Trial) also selected an AO systolic BP goal <140 mm Hg for the standard treatment group.31 Given the systematic review on office and out-of-office BP in the American College of Cardiology/American Heart Association 2017 Hypertension Guideline,7 our future MAP studies will consider a systolic AOBP <135 mm Hg as equivalent to the current National Quality Foundation systolic BP goal of <140 mm Hg.15
Perspectives
The health and economic burden of hypertension-related cardiovascular and renal diseases is large, which has raised national attention to the need for better hypertension control.2–4,7 Effective, simple, low-cost, scalable interventions that are effective in most primary care settings are needed to realize more of the population benefits of better hypertension control. Our current study confirms our pilot study report that MAP, especially the measure accurately and partner with patients components, is effective for rapidly improving hypertension control.13 Moreover, better hypertension control observed at 6 months is retained at 12 months. Future MAP studies will aim to further enhance hypertension control from 6 to 12 months and beyond. Clinical adoption of the recent recommendation to lower the threshold for hypertension control from <140/<90 to <130/<80 mm Hg would raise the importance of robust quality improvement programs, for example, MAP, that can be implemented in most clinical settings.
Acknowledgments
We thank Lindsey Bayne (CCI) for facilitation, education, and implementation of MAP in all clinical sites; Dave Ramsey (CCI) and Shaun Wagner (CCI) for database management and reporting of quality indicators for MAP; the Department of Family Medicine at Greenville Health System; and Laken Barkowski (AMA) for implementation and facilitation of MAP.
Sources of Funding
The work in this report was funded, in part, by grants to the Care Coordination Institute from the American Medical Association and from the Centers for Disease Control through the South Carolina Department of Health and Environmental Control.
Disclosures
B.M. Egan has received income as a consultant from AstraZeneca, Inside Edge, Medtronic, and Valencia, research support from Boehringer, and royalties from UpToDate. The other authors report no conflicts.
Supplementary Material
Footnotes
The findings and conclusions in this report are those of the authors and do not necessarily represent the views of the American Medical Association.
The online-only Data Supplement is available with this article at https://www.ahajournals.org/doi/suppl/10.1161/HYPERTENSIONAHA.118.11558.
Novelty and Significance
What Is New?
Measure accurately, Act rapidly, and Partner with patients, a 6-month quality improvement program, improved hypertension control at 6 and 12 months.
What Is Relevant?
Measure accurately, Act rapidly, and Partner with patients uses a practical protocol and lean methods to produce a sustained improvement in hypertension control that can be implemented in most clinical settings.
Summary
Measure accurately, Act rapidly, and Partner with patients represents a practical program to facilitate attainment of national goals for hypertension control and cardiovascular disease prevention.
References
- 1.High blood pressure fact sheet. Centers for Disease Control and Prevention: Division for Heart Disease and Stroke Prevention. https://www.cdc.gov/dhdsp/data_statistics/fact_sheets/fs_bloodpressure.htm. Accessed January 22, 2018.
- 2.US Burden of Disease Collaborators. The state of US health, 1990–2016: burden of diseases, injuries, and risk factors among US states. JAMA. 2013;310:591–608. doi: 10.1001/jama.2013.13805. [DOI] [PMC free article] [PubMed] [Google Scholar]
- 3.Target:BP. https://targetbp.org/blood-pressure-improvement-program/; https://targetbp.org/recognition-program/. Accessed January 22, 2018.
- 4.Million Hearts® 2022. Design. https://millionhearts.hhs.gov/files/MH-Framework.pdf. Accessed January 22, 2018.
- 5.Egan BM, Li J, Hutchison FN, Ferdinand KC. Hypertension in the United States 1999–2012: progress toward healthy people 2020 goals. Circulation. 2014;30:1692–1699. doi: 10.1161/CIRCULATIONAHA.114.010676. [DOI] [PMC free article] [PubMed] [Google Scholar]
- 6.Yoon SS, Fryar CD, Carroll MD. Hypertension prevalence and control among adults: United States, 2011–2014. NCHS Data Brief. 2015;220:1–8. https://www.cdc.gov/nchs/data/databriefs/db220.pdf. Accessed January 22, 2018. [PubMed] [Google Scholar]
- 7.Whelton PK, Carey RM, Aronow WS, et al. 2017 ACC/AHA guideline for the prevention, detection, evaluation, and management of high blood pressure in adults. Hypertension. 2017;71:1269–1324. doi: 10.1161/HYP.0000000000000066. [DOI] [PubMed] [Google Scholar]
- 8.Muntner P, Carey RM, Gidding S, Jones DW, Taler SJ, Wright JT, Jr, Whelton PK. Potential US population impact of the 2017 ACC/AHA high blood pressure guideline. Circulation. 2018;137:109–118. doi: 10.1161/CIRCULATIONAHA.117.032582. doi: 10.1161/CIRCULATIONAHA.117.032582. [DOI] [PMC free article] [PubMed] [Google Scholar]
- 9.Walsh JM, McDonald KM, Shojania KG, Sundaram V, Nayak S, Lewis R, Owens DK, Goldstein MK. Quality improvement strategies for hypertension management: a systematic review. Med Care. 2006;44:646–657. doi: 10.1097/01.mlr.0000220260.30768.32. doi: 10.1097/01.mlr.0000220260.30768.32. [DOI] [PubMed] [Google Scholar]
- 10.Proia KK, Thota AB, Njie GJ, Finnie RK, Hopkins DP, Mukhtar Q, Pronk NP, Zeigler D, Kottke TE, Rask KJ, Lackland DT, Brooks JF, Braun LT, Cooksey T Community Preventive Services Task Force. Team-based care and improved blood pressure control: a community guide systematic review. Am J Prev Med. 2014;47:86–99. doi: 10.1016/j.amepre.2014.03.004. doi: 10.1016/j.amepre.2014.03.004. [DOI] [PMC free article] [PubMed] [Google Scholar]
- 11.Pavlik VN, Chan W, Hyman DJ, Feldman P, Ogedegbe G, Schwartz JE, McDonald M, Einhorn P, Tobin JN. Designing and evaluating health systems level hypertension control interventions for African-Americans: lessons from a pooled analysis of three cluster randomized trials. Curr Hypertens Rev. 2015;11:123–131. doi: 10.2174/1573402111666150325234503. [DOI] [PMC free article] [PubMed] [Google Scholar]
- 12.Boonyasai RT, Rakotz MK, Lubomski LH, Daniel DM, Marsteller JA, Taylor KS, Cooper LA, Hasan O, Wynia MK. Measure accurately, Act rapidly, and Partner with patients: an intuitive and practical three-part framework to guide efforts to improve hypertension control. J Clin Hypertens (Greenwich) 2017;19:684–694. doi: 10.1111/jch.12995. doi: 10.1111/jch.12995. [DOI] [PMC free article] [PubMed] [Google Scholar]
- 13.Hanlin RB, Asif IM, Wozniak G, Sutherland SE, Shah B, Yang J, Davis RA, Bryan ST, Rakotz M, Egan BM. Measure accurately, Act rapidly, and Partner with patients (MAP) improves hypertension control in medically underserved patients: Care Coordination Institute and American Medical Association Hypertension Control Project Pilot Study results. J Clin Hypertens (Greenwich) 2018;20:79–87. doi: 10.1111/jch.13141. doi: 10.1111/jch.13141. [DOI] [PMC free article] [PubMed] [Google Scholar]
- 14.Khan T, Yang J, Barkowski L, Tapper B, Lubomski L, Daniel D, Wozniak G. A hypertension control quality improvement pilot program: experiences and blood pressure outcomes from physician practices. Internat J Healthcare. 2018;4:42–49. doi: 10.5430/ijh.v4n1p42. [DOI] [Google Scholar]
- 15.Center for Medicare and Medicaid Services, Office of the National Coordinator for Health Information Technology. 2018 Performance Period EP/EC eCQMs, Controlling High Blood Pressure. https://ecqi.healthit.gov/ecqm/measures/cms165v6. Accessed October 10, 2018.
- 16.Pickering TG, Hall JE, Appel LJ, Falkner BE, Graves J, Hill MN, Jones DW, Kurtz T, Sheps SG, Roccella EJ. Recommendations for blood pressure measurement in humans and experimental animals: part 1: blood pressure measurement in humans: a statement for professionals from the Subcommittee of Professional and Public Education of the American Heart Association Council on High Blood Pressure Research. Circulation. 2005;111:697–716. doi: 10.1161/01.CIR.0000154900.76284.F6. doi: 10.1161/01.CIR.0000154900.76284.F6. [DOI] [PubMed] [Google Scholar]
- 17.Myers MG. Eliminating the human factor in office blood pressure measurement. J Clin Hypertens (Greenwich) 2014;16:83–86. doi: 10.1111/jch.12252. doi: 10.1111/jch.12252. [DOI] [PMC free article] [PubMed] [Google Scholar]
- 18.Okonofua EC, Simpson K, Jesri A, Rehman S, Durkalski V, Egan BM. Therapeutic inertia is an impediment to achieving the healthy people 2010 blood pressure control goals. Hypertension. 2006;47:1–7. doi: 10.1161/01.HYP.0000200702.76436.4b. [DOI] [PubMed] [Google Scholar]
- 19.Handler J, Zhao Y, Egan BM. Impact of the number of blood pressure measurements on blood pressure classification in US adults: NHANES 1999-2008. J Clin Hypertens (Greenwich) 2012;14:751–759. doi: 10.1111/jch.12009. doi: 10.1111/jch.12009. [DOI] [PMC free article] [PubMed] [Google Scholar]
- 20.Daugherty SL, Powers JD, Magid DJ, Masoudi FA, Margolis KL, O’Connor PJ, Schmittdiel JA, Ho PM. The association between medication adherence and treatment intensification with blood pressure control in resistant hypertension. Hypertension. 2012;60:303–309. doi: 10.1161/HYPERTENSIONAHA.112.192096. doi: 10.1161/HYPERTENSIONAHA.112.192096. [DOI] [PMC free article] [PubMed] [Google Scholar]
- 21.Bennett A, Chow CK, Chou M, et al. Efficacy and safety of quarter-dose blood pressure-lowering agents: a systematic review and meta-analysis of randomized controlled trials. Hypertension. 2017;70:85–93. doi: 10.1161/HYPERTENSIONAHA.117.09202. doi: 10.1161/HYPERTENSIONAHA.117.09202. [DOI] [PubMed] [Google Scholar]
- 22.Zullig LL, Peterson ED, Bosworth HB. Ingredients of successful interventions to improve medication adherence. JAMA. 2013;310:2611–2612. doi: 10.1001/jama.2013.282818. [DOI] [PubMed] [Google Scholar]
- 23.Fowler FJ, Jr, Gerstein BS, Barry MJ. How patient centered are medical decisions?: results of a national survey. JAMA Intern Med. 2013;173:1215–1221. doi: 10.1001/jamainternmed.2013.6172. doi: 10.1001/jamainternmed.2013.6172. [DOI] [PubMed] [Google Scholar]
- 24.Roumie CL, Greevy R, Wallston KA, Elasy TA, Kaltenbach L, Kotter K, Dittus RS, Speroff T. Patient centered primary care is associated with patient hypertension medication adherence. J Behav Med. 2011;34:244–253. doi: 10.1007/s10865-010-9304-6. doi: 10.1007/s10865-010-9304-6. [DOI] [PubMed] [Google Scholar]
- 25.Eaddy MT, Cook CL, O’Day K, Burch SP, Cantrell CR. How patient cost-sharing trends affect adherence and outcomes: a literature review. P T. 2012;37:45–55. [PMC free article] [PubMed] [Google Scholar]
- 26.Lauffenburger JC, Landon JE, Fischer MA. Effect of combination therapy on adherence among US patients initiating therapy for hypertension: a cohort study. J Gen Intern Med. 2017;32:619–625. doi: 10.1007/s11606-016-3972-z. doi: 10.1007/s11606-016-3972-z. [DOI] [PMC free article] [PubMed] [Google Scholar]
- 27.Xie L, Frech-Tamas F, Marrett E, Baser O. A medication adherence and persistence comparison of hypertensive patients treated with single-, double- and triple-pill combination therapy. Curr Med Res Opin. 2014;30:2415–2422. doi: 10.1185/03007995.2014.964853. doi: 10.1185/03007995.2014.964853. [DOI] [PubMed] [Google Scholar]
- 28.Glasgow RE, Emmons KM. How can we increase translation of research into practice? Types of evidence needed. Annu Rev Public Health. 2007;28:413–433. doi: 10.1146/annurev.publhealth.28.021406.144145. doi: 10.1146/annurev.publhealth.28.021406.144145. [DOI] [PubMed] [Google Scholar]
- 29.Stigler SM. Regression towards the mean, historically considered. Stat Methods Med Res. 1997;6:103–114. doi: 10.1177/096228029700600202. doi: 10.1177/096228029700600202. [DOI] [PubMed] [Google Scholar]
- 30.Egan BM, Li J, Small J, Nietert PJ, Sinopoli A. The growing gap in hypertension control between insured and uninsured adults: National Health and Nutrition Examination Survey 1988 to 2010. Hypertension. 2014;64:997–1004. doi: 10.1161/HYPERTENSIONAHA.114.04276. doi: 10.1161/HYPERTENSIONAHA.114.04276. [DOI] [PMC free article] [PubMed] [Google Scholar]
- 31.The SPRINT Research Group. A randomized trial of intensive versus standard blood-pressure control. N Engl J Med. 2015;373:2103–2116. doi: 10.1056/NEJMoa1511939. doi: 10.1056/NEJMoa1511939. [DOI] [PMC free article] [PubMed] [Google Scholar]