

Abstract
Background.
Soil contamination with heavy metals has severely increased over the last few decades, mainly from industrial wastes and human activities. Soil pollution is a source of danger to the health of people globally.
Objectives.
To assess the level of soil contamination with heavy metals around steel rolling mills in Jinja municipality, Uganda.
Methods.
Four composite soil samples were collected from each of the sides of the Jinja steel rolling mills, dried and digested. The digested solution samples were analyzed in triplicates for the levels of lead (Pb), zinc (Zn), cadmium (Cd), chromium (Cr), copper (Cu), and nickel (Ni), using a flame atomic absorption spectrometer (Savant AA model 2009); the analytical process was monitored using analytical standard solutions. Data analysis was performed using Statistical Package for the Social Sciences (SPSS) software version 19 and Excel. Mean metal concentrations, standard deviations, medians, and skewness were obtained to describe heavy metal concentrations in the soil. Pollution load index and geo-accumulation indices were calculated to determine the level and extent of heavy metal contamination in the soil.
Results.
The mean concentration loads of the heavy metals in soils around the Jinja steel rolling mills were 43.15 mg/kg for Pb, 28.16 mg/kg for Zn, 0.93 mg/kg for Cd, 0.22 mg/kg for Cr, 80.96 mg/kg for Cu, and 9.40 mg/kg for Ni. The metal load distribution around the industry was in descending order: Left-hand side > Downwind side > Right-hand side > Upwind side. Results for the geo-accumulation index were 1.30 for Pb, −1.31 for Zn, 2.63 for Cd, −7.25 for Cr, 2.99 for Cu, and −1.19 for Ni. The overall pollution load index was 1.08.
Conclusions.
The concentration levels of heavy metals around the steel rolling mills did not appear to be of serious concern, except for copper and cadmium, which showed moderate pollution and moderate to strong pollution, respectively. All heavy metals were within the limits of the United States Environmental Protection Agency (USEPA) residential soil standards and the Dutch intervention soil standards. Overall, soils around the Jinja steel rolling mills were slightly polluted with heavy metals, and measures therefore need to be taken to prevent further soil contamination with heavy metals.
Keywords: Heavy metals, pollution load index, soil contamination, geo-accumulation index, Steel rolling mills
Introduction
Soil contamination with heavy metals has severely increased over the last decades, mainly from industrial wastes and human activities.1,2 Soil pollution by heavy metals is as a result of both natural processes such as weathering of minerals, and anthropogenic activities related to industries, fossil fuel burning, emissions from vehicles, mining, agriculture and metallurgical processes and their waste disposal.3 The production of steel is vital for the economic growth of Uganda, but its production is a major source of pollution.4 Solid and liquid wastes, including fumes generated from the steel plant and the raw materials, usually contain notable amounts of heavy metals such as arsenic (As), cadmium (Cd), mercury (Hg), manganese (Mn), copper (Cu), cobalt (Co), nickel (Ni), zinc (Zn), lead (Pb), and bismuth(Bi), among others, which may be released into the environment and cause environmental health problems.4
Soil pollution is a source of danger to the health of people worldwide. Soil contamination with heavy metals such as Cd, Cu, chromium (Cr), Pb, Ni and Zn in terrestrial ecosystems has been recognized as a serious environmental health concern due to the non-biodegradability of these heavy metals and tendency to accumulate in plants and animal tissues, which later enter into the human food chain and may result in health problems.5 This food chain contamination is an important pathway for the entry of these toxic pollutants into the human body. Chronic intakes of toxic metals have adverse impacts on humans which may become apparent only after several years of exposure.6 The consumption of heavy metal-contaminated food can seriously deplete some essential nutrients in the body that are further responsible for decreasing immunological defenses, intrauterine growth retardation, impaired psycho-social faculties, disabilities associated with malnutrition and a high prevalence of upper gastrointestinal cancer rates.7
The Jinja steel rolling mills (SRM) are part of one of the fast growing industries in Jinja and Uganda. However, there is limited documented information on the level of soil contamination with heavy metals around the Jinja steel rolling mills. Therefore, the aim of this study was to generate information on the level and extent of soil contamination with heavy metals around the Jinja steel rolling mills, Uganda.
Abbreviations
- As
Arsenic
- Bi
Bismuth
- Bn
Geochemical background values of metals
- Cd
Cadmium
- CF
Contamination factor
- Cm
Measured total concentrations of metals in soils
- Co
Cobalt
- Cr
Chromium
- Cu
Copper
- EDTA
Ethylene-diaminetetra-acetic acid
- Fe
Iron
- Hg
Mercury
- Igeo
Geo-accumulation index
- Mn
Manganese
- n
Number of metals investigated in the soil
- Ni
Nickel
- Pb
Lead
- PLI
Pollution load index
- SPSS
Statistical Package for the Social Sciences
- SRM
Steel rolling mills
- USEPA
United States Environmental Protection Agency
- WEPAL
Wageningen Evaluating Programs for Analytical Laboratories
- Zn
Zinc
Methods
Study Area
The present study was conducted around the Jinja SRM in Jinja municipality, Uganda. Jinja lies in southeastern Uganda, approximately 54 miles (87 km) by road, east of Kampala, the capital city of Uganda. The town is located on the shores of Lake Victoria, near the source of the River Nile. The area has warm temperatures ranging between 23°C to 32°C and a bi-modal rainfall pattern averaging approximately 1260 mm annually. The soils in the area are characterized by granites and granitoid gneisses. Part of the industrial area soils are composed of shales, phillites and schists.8 The Jinja steel rolling mills are the leading producer of steel products in Uganda; they are surrounded by farming communities and Lake Victoria. The upwind side of the factory is plain land, with the Busoga Forestry Company Ltd. 350 miles away from the SRM; the downwind side is near the main highway and small cultivations are carried out on that side. The right-hand side of the factory is mainly a settlement area, with small-scale cultivation, while the left-side is a business area with a road network connecting to the factory.
SRM uses iron ore as the main raw material which is stored in the open, at the peripheral ends of the factory before it is fed into the manufacturing process. The iron ore is reduced using coal in a rotary kiln to form sponge iron, releasing fumes into the environment. The sponge iron is melted and upgraded to form mild steel, which is cast into billets through a billet casting machine. The billets are reheated in a reheating furnace using fuel furnace oil and then rolled at the rolling mills into bars. Very minimal liquid waste is generated.
Soil Sampling
Four composite soil samples to a depth of 15 cm were collected from each of the four different sides of the factory (upwind, downwind, right- and left-hand sides) during March 2015. Four discrete sub-samples made up a composite sample. The compositing procedure was done following the United States Environmental Protection Agency (USEPA) guidelines.9 The compositing tools were washed with tap water and air dried prior to sampling, and four sub samples were collected using a screw auger of 8 cm diameter, mixed using a stainless steel fork to form homogeneous composite samples, which were stored in properly labeled polyethylene bags and transported to the laboratory. All field activities, observations, sample labeling, and the corresponding sides of the factory were recorded. The composite samples were labeled U1, U2, U3 and U4 for upwind composites; D1, D2, D3 and D4 for downwind composites; L1, L2, L3 and L4 for left-side composites; and R1, R2, R3, and R4 for right-side composites.
Figure 1.
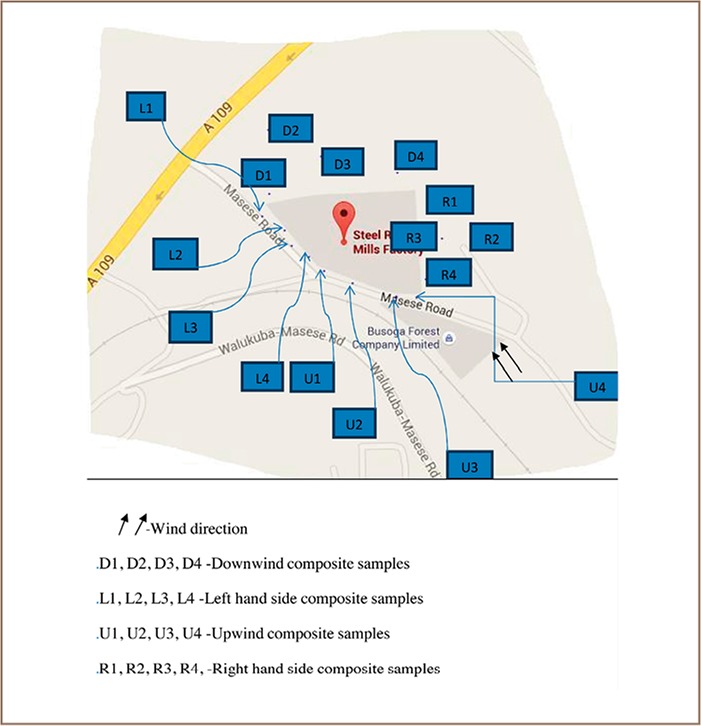
Map of the study area showing sampling locations
Chemical Analysis
The four composite soil samples from each sides of the factory were air dried at 40°C for 48 hours, disaggregated with a mortar and pestle and then sieved through a 150-mesh stainless-steel screen. Triplicates of 5 g of each of these composite samples were digested with a concentrated solution of ethylene-diaminetetra-acetic acid (EDTA) and topped up with distilled water (40 mL). The soil digested solutions were cooled to room temperature, filtered and transferred to plastic vials before metal analysis; the digestion was performed according to the laboratory methods of the Soil and Plant Analysis Working Manual, second edition.10 Quantification of the heavy metal content (i.e. Cd, iron (Fe), Cu, Ni, Pb, Zn and Cr) of the digested samples was carried out with a flame atomic absorption spectrometer (GBC Savant AA Model 2009), which was earlier calibrated using prepared standard solutions of 0.0, 0.2 ppm, 0.4 ppm, 1 ppm, 2 ppm and 5 ppm for the respective metals. The calibration graphs of concentration of the standards against absorbance were plotted, from which the concentrations of the corresponding elements were read by extrapolation or interpolation. The laboratory obtained its certifications and analytical standards from Wageningen Evaluating Programs for Analytical Laboratories (WEPAL).
Quality Control
During the experiment, principles of quality assurance/quality control were applied to ensure improved accuracy and precision of results. These principles included washing all the glassware with dilute hydrochloric acid, and use of well-calibrated volumetric glassware.
The Atomic Absorption spectrometer was calibrated using a freshly prepared standard solution of the corresponding heavy metals. In this study, standard reference materials (JG-3) were used.11 Precision of the analytical results was estimated by replicate analysis.
Data Analysis
Data analysis was performed using SPSS software version 19 and Excel; mean metal concentrations, standard deviations, medians, and skewness were obtained to describe heavy metal concentrations in the soil. Pollution load index and geo-accumulation indices were calculated to determine the level and extent of heavy metal contamination in the soil.
To assess the extent of contamination, pollution load index (PLI) using Tomlinson's approach was used.6 The PLI represents the number of times by which the metal content in the soil exceeds the average natural background concentration, and gives a summative indication of the overall level of heavy metal toxicity in a particular sample. The concentrations in reference materials were taken to represent natural background concentrations. When PLI > 1, then the soil is polluted; and when PLI < 1, there is no metal pollution.12
The PLI is obtained as a contamination factor (CF) of each metal with respect to the natural background value in the soil, given as (CFXCFX…n)1/n, where CF is the contamination factor which is given as mean metal concentration in soils divided by natural background concentrations and the solution is number of metals investigated in the soil (n).13
The geo-accumulation index (Igeo) was used to determine the level of soil contamination with the different heavy metals. The Igeo for heavy metal is calculated by computing the base 2 logarithm of the measured total concentration of the metal over its background concentration using the following mathematical expression: Igeo= log base 2 (Cm/1.5Bn), where Cm is the measured total concentrations of metals in soils, Bn is the geochemical background values of metals and 1.5 is the background matrix correction factor due to lithogenic effects.14,15 The Igeo interpretation according to Lu was adopted for this study; Igeo< 0 = practically unpolluted; 0 < Igeo< 1 = unpolluted to moderately polluted; 1 < Igeo < 2 = moderately polluted, 2 < Igeo< 3 = moderately to strongly polluted; 3 < Igeo < 4 = strongly polluted; 4 < Igeo< 5= strongly to extremely polluted; and Igeo > 5 = extremely polluted.16
Results
Metal Concentration Distributions around the Factory
The right-hand side of the factory had the lowest mean concentrations (mg/kg) for all heavy metals, however, based on the PLI, the left-hand side of the factory had the highest heavy metal load, in the following order: Left-hand side > Downwind side > Right-hand side > Upwind side. The left-hand side was slightly polluted (PLI > 1). The upwind side had the highest concentrations of Pb (56.69 mg/kg) and Zn (30.05 mg/kg), with no Cr. The downwind side had the highest concentrations of Cd (1.93 mg/kg) and Cu (94.75 mg/kg), while the left-hand side had the highest concentrations of Cr (0.60 mg/kg), and Ni (10.82 mg/kg). All of the metals were below the limits according to USEPA residential soil standards and the Dutch intervention standards of soil (Table 1).17,18
Table 1.
Mean Metal Concentrations (mg/kg) around the Factory
| Side of the factory | Sampling Sites | Heavy metal mean concentrations (mg/kg) | PLI | |||||
| Pb | Zn | Cd | Cr | Cu | Ni | |||
| Right-hand side | R1 | 28.98 | 25.45 | 0.21 | 0.28 | 58.46 | 9.46 | |
| R2 | 31.45 | 27.78 | 0.34 | 0.22 | 62.87 | 10.98 | ||
| R3 | 29.46 | 24.39 | 0.28 | 0.25 | 57.47 | 10.25 | ||
| R4 | 31.39 | 28.86 | 0.17 | 0.17 | 60.88 | 9.79 | ||
| Average | 30.32 | 26.62 | 0.25 | 0.23 | 59.92 | 10.12 | 0.79 | |
| Left-hand side | L1 | 45.68 | 27.95 | 0.68 | 0.63 | 74.8 | 9.82 | |
| L2 | 49.53 | 30.24 | 0.59 | 0.71 | 77.45 | 11.34 | ||
| L3 | 46.58 | 25.83 | 0.73 | 0.54 | 73.86 | 10.74 | ||
| L4 | 50.01 | 28.06 | 0.56 | 0.52 | 75.45 | 11.38 | ||
| Average | 47.95 | 28.02 | 0.64 | 0.6 | 75.39 | 10.82 | 1.23 | |
| Upwind side | U1 | 55.76 | 29.45 | 0.74 | 0.00 | 92.34 | 7.43 | |
| U2 | 58.26 | 32.18 | 1.13 | 0.00 | 93.54 | 9.55 | ||
| U3 | 54.83 | 27.54 | 0.85 | 0.00 | 95.45 | 8.23 | ||
| U4 | 57.91 | 31.03 | 1.00 | 0.00 | 93.79 | 9.63 | ||
| Average | 56.69 | 30.05 | 0.93 | 0.00 | 93.78 | 8.71 | 0.00 | |
| Downwind side | D1 | 39.24 | 28.29 | 1.76 | 0.06 | 95.74 | 8.35 | |
| D2 | 37.68 | 31.41 | 1.89 | 0.08 | 93.67 | 8.19 | ||
| D3 | 35.46 | 24.59 | 2.04 | 0.01 | 92.45 | 7.64 | ||
| D4 | 38.22 | 27.55 | 1.99 | 0.01 | 97.14 | 7.66 | ||
| Average | 37.65 | 27.96 | 1.92 | 0.04 | 94.75 | 7.96 | 0.89 | |
| USEPA residential soil standards | 400 | 23,600 | 70 | 230 | — | 1,600 | ||
| Dutch intervention standards for soil | 530 | 720 | 12 | 380 | 190 | 210 | ||
Level and Extent of Soil Contamination with Heavy Metals
From Table 3, the results of the geo-accumulation indices for Zn, Cr, and Ni were less than 0, indicating that the soils were unpolluted with these metals. The soils were moderately polluted with Cd (1 > Igeo < 2) and moderately to strongly polluted with Cu (2 > Igeo < 3). The order of contribution of various heavy metals to soil contamination on the basis of Igeo follows: Cu > Cd > Pb>Ni > Zn > Cr. The overall pollution load index indicated that the soils surrounding the factory were slightly polluted with heavy metals (P = 1.08).
Table 3.
Contamination Factor and Geo-accumulation Indices of Metals in Soil Overall pollution load index =1.08
| Metal | Concentration mg/kg | Natural background concentrations mg/kg | Contamination factor | Geo-accumulation indices |
| Pb | 43.15 | 11.70 | 3.69 | 1.30 |
| Zn | 28.16 | 46.50 | 0.61 | −1.31 |
| Cd | 0.93 | 0.10 | 9.30 | 2.63 |
| Cr | 0.22 | 22.40 | 0.01 | −7.25 |
| Cu | 80.96 | 6.81 | 11.89 | 2.99 |
| Ni | 9.40 | 14.30 | 0.66 | −1.19 |
Table 2.
Statistical Summary of Metal Concentrations (mg/kg) in Soil
| Pb | Zn | Cd | Cr | Cu | Ni | |
| Mean | 43.15 | 28.16 | 0.93 | 0.22 | 80.96 | 9.40 |
| Median | 42.80 | 27.99 | 0.78 | 0.14 | 84.58 | 9.41 |
| Standard deviation | 11.57 | 1.41 | 0.71 | 0.27 | 16.61 | 1.30 |
| Maximum | 56.69 | 30.05 | 1.92 | 0.60 | 94.75 | 10.82 |
| Minimum | 30.32 | 26.62 | 0.25 | 0.00 | 59.92 | 7.96 |
| Skewness | 0.13 | 0.72 | 1.12 | 1.29 | -0.69 | -0.03 |
| USEPA residential soil standards | 400 | 23,600 | 70 | 230 | — | 1,600 |
| Dutch intervention soil standards | 530 | 720 | 12 | 380 | 190 | 210 |
Discussion
The left-hand side of the factory had the highest heavy metal load as compared to the downwind side of the factory. This could be attributed to the road network on the left-hand side of the factory that supplies raw materials to the factory, and therefore the high heavy metal load on this side could be due to anthropogenic effects such as burning of fossil fuel, wear and tear of tires, and dust generation during transportation of raw materials. This finding is consistent with that of studies in the US, where soils lying in the vicinity of highways were found to have high metal concentrations.19 Also, the high perimeter wall on the downwind side of the factory could have contributed to low metal concentrations on that side since wind had less of an effect in depositing metal dust on that side.
The concentration levels of heavy metals around the factory did not appear to be of serious concern, except for Cu and Cd, for which the Igeo indicated that they were moderately polluted and moderately to strongly polluted, respectively. However, Cu and Cd concentrations were below the reference levels for metal contamination in soils of both USEPA residential soil standards and Dutch intervention standards for soils.17,18 The concentration of Cd in this study was higher than the concentrations reported in Sweden (0.4 mg/kg) and Denmark (0.8 mg/kg).20 The high levels of Cd could be attributed to traffic and use of fertilizer by farmers around the factory.
The soils around the factory were slightly polluted with heavy metals (PLI = 1.08). These study findings were in contrast to study findings around the industrial area in Kampala, Uganda where the PLI showed heavy soil pollution with heavy metals.21 It was also contrary to the findings in western India and in Nigeria, where heavy soil contamination with heavy metals was reported.22,23 The low pollution level in this study could be due to the high perimeter wall that was observed around the factory, and it was also reported that all fumes and gases are passed through dust collectors before being released into the environment. However, these results were obtained in soils around a steel processing factory, and thus these results many not be generalized for all industries in the country.
Conclusion
The study revealed that the left-hand side of the factory had the highest heavy metal load, in the following order: Left-hand side > Downwind side > Right-hand side > Upwind side. The overall heavy mean metal concentration around the factory was in the descending order Cu > Pb > Zn > Ni > Cd > Cr. The Igeo indicated that soils were moderately polluted with Cd (1 > Igeo < 2) and moderately to strongly polluted with Cu (2 > Igeo < 3) and overall, soils around the industry were slightly polluted with heavy metals (PLI = 1.08). The steel mill does not appear to be causing significant heavy metal pollution in the neighboring areas, which may be due to effective air pollution controls and relatively low heavy metal concentrations in the iron ore and coal that is used. However, examining the main reasons for the low metal contamination around theses soils would require intrusive evaluation inside the factory and is beyond the scope of this paper.
Acknowledgments
This work was funded in part by a grant from Pure Earth, formerly the Blacksmith Institute.
References
- 1.Martinez T, Lartigue J, Avila PP, Navarrete M, Zarazua G, Lopez C, Cabrera L, Ramirez A. Melville, New York: AIP Conference Proceedings; 2001 Jul [cited 2015 Oct 1]. Metallic pollutants in Mexico Valley [Internet] pp. 512–515. The CAARI 2000: Sixteenth international conference on the application of accelerators in research and industry; 2000 Nov 1–5; Denton, Texas. p. Available from: http://adsabs.harvard.edu/abs/2001AIPC..576..512M Subscription required to view. [Google Scholar]
- 2.Abioye OP. Biological remediation of hydrocarbon and heavy metals contaminated soil. Pascucci S, editor. Soil Contamination [Internet]. InTech: Rijeka, Croatia. 2011 Sep 12 [cited 2015 Oct 1] In. editor. Chapter 7. Available from: http://www.intechopen.com/books/soil-contamination/biological-remediation-of-hydrocarbon-and-heavymetals-contaminated-soil. [Google Scholar]
- 3.Gupta S, Jena V, Matic N, Kapralova V, Solanki JS. Assessment of geo-accumulation index of heavy metal and source of contamination by multivariate factor analysis. Int J Hazard Mater [Internet] 2014 [cited 2015 Jan 8];2(2):18–22. Available from: http://urpjournals.com/tocjnls/16_14v2i1_3.pdf. [Google Scholar]
- 4.Das B, Prakash S, Reddy PS, Biswal SK, Mohapatra BK, Misra VN. Effective utilization of blast furnace flue dust of integrated steel plants. Eur J Mineral Process Environ Prot [Internet] 2002 [cited 2015 Aug 21];2(2):61–8. Available from: http://ejmpep.com/das_et.al.pdf. [Google Scholar]
- 5.Otitoloju AA, Ajikobi DO, Egonmwan RI. Histopathology and bioaccumulation of heavy metals (Cu &Pb) in the giant land snail, Archachatinamarginata (Swainson) Open Environ Pollut Toxicol J [Internet] 2009Jan [cited 2015 Jan8];1:79–88. Available from: http://benthamopen.com/contents/pdf/TOEPTJ/TOEPTJ-1-79.pdf. [Google Scholar]
- 6.Ikeda M, Zhang ZW, Shimbo S, Watanabe T, Nakatsuka H, Moon CS, Matsuda NI, Higashikawa K. Urban population exposure to lead and cadmium in east and south-east Asia. Sci Total Environ [Internet] 2000 Apr 17 [cited 2015 Aug 27];249(1–3):373–84. doi: 10.1016/s0048-9697(99)00527-6. Available from: http://www.sciencedirect.com/science/article/pii/S0048969799005276 Subscription required to view. [DOI] [PubMed] [Google Scholar]
- 7.Turkdogan MK, Fevzi K, Kazim K, Ilyas T, Ismail U. Heavy metals in soil, vegetables and fruits in the endemic upper gastrointestinal cancer region of Turkey. Environ Toxicol Pharmacol [Internet] 2003 Apr [ cited, 2015 Aug 27];13(3):175–9. doi: 10.1016/S1382-6689(02)00156-4. Available from: http://www.sciencedirect.com/science/article/pii/S1382668902001564 Subscription required to view. [DOI] [PubMed] [Google Scholar]
- 8.Kansiime F, Nalubega M. Wastewater treatment by a natural wetland: the Nakivubo Swamp, Uganda [dissertation] [Internet] [Netherlands]: A.A. Balkema; 1999 May 20 [cited 2015 Apr 23]. p. 336. p. Available from: http://www.researchgate.net/publication/40218254_Wastewater_treatment_by_a_natural_wetland_the_Nakivubo_swamp_Uganda__processes_and_implications. [Google Scholar]
- 9.Composite soil sampling in site contamination assessment and management [Internet] Adelaide, Australia: Environmental Protection Authority; 2005 Mar [cited 2015 Oct 2]. p. 5. p. Available from: www.epa.sa.gov.au/files/8370_guide_composite.pdf. [Google Scholar]
- 10.Okalebo R, Gathua KW, Woomer PL. Laboratory methods of soil and plant analysis; a working manual. 2nded. Nairobi, Kenya: Tropical Soil Biology and Fertility Programme; 2002. p. 128. p. [Google Scholar]
- 11.Imai N, Terashima S, Itoh S, Ando A. 1994 compilation of analytical data for minor and trace elements in seventeen GSJ geochemical reference samples, “igneous rock series”. Geostandards News [Internet] 1995 Oct [cited 2015 Jan 7];19(2):135–213. Available from: http://onlinelibrary.wiley.com/doi/10.1111/j1751-908X.1995.tb00158.x/abstract Subscription required to view. [Google Scholar]
- 12.Tomlinson DL, Wilson JG, Harris CR, Jeffrey DW. Problems in the assessment of heavy-metals levels in estuaries and the formation of pollution index. Helgoländer Meeresuntersuchungen [Internet] 1980 Mar [cited 2015 May 11];33(1):566–9. doi: 10.1007/BF02414780. Available from: Subscription required to view. [DOI] [Google Scholar]
- 13.Angulo E. The Tomllinson Pollution Load Index applied to heavy metal “Mussel-Watch” data: a useful index to assess coastal pollution. Sci Total Environ [Internet] 1996 Aug 15 [cited 2015 May 11];187(1):19–56. Available from: http://www.sciencedirect.com/science/article/pii/0048969796051285 Subscription required to view. [Google Scholar]
- 14.Muller G. Index of geoaccumulation in sediments of the Rhine River. J Geol. 1969;2(3):108–18. [Google Scholar]
- 15.Ntekim EE, Ekwere SJ, Ukpong EE. Heavy metal distribution in sediments from CalabarRiver, Southeastern Nigeria. Environ Geol [Internet] 1993 Aug [cited 2015 May 12];21(4):237–41. Available from: http://link.springer.com/article/10.1007%2FBF00775913#page-1 Subscription required to view. [Google Scholar]
- 16.Lu X, Wang L, Lei K, Huang J, Zhai Y. Contamination assessment of copper, lead, zinc, manganese and nickel in street dust of Boaji, NW China. J Hazard Mater [Internet] 2009 Jan 30 [cited 2015 May 21];161(2–3):1058–62. doi: 10.1016/j.jhazmat.2008.04.052. Available from: http://www.sciencedirect.com/science/article/pii/S0304389408005980 Subscription required to view. [DOI] [PubMed] [Google Scholar]
- 17.Dinan J, Cooper D. Supplemental guidance for developing soil screening levels for superfund sites [Internet] Washington, DC: U.S. Environmental Protection Agency; 2002 Dec [cited 2015 Aug 27]. p. 106. p. Available from: http://www.epa.gov/superfund/health/conmedia/soil/pdfs/ssg_main.pdf. [Google Scholar]
- 18.Dutch target and intervention values: 2000 (the new Dutch list) [Internet] Delft, Netherlands: Dutch Standardization Institute; 2000 Feb 4; [cited 2015 August 27]. Available from: http://www.esdat.com.au/Environmental%20Standards/Dutch/annexS_I2000Dutch%20Environmental%20Standards.pdf. [Google Scholar]
- 19.Pendias AK. Trace elements in soils and plants [Internet] 4thed. Boca Raton, Florida: CRC Press; 2011 [cited 2015 Oct 2]. p. 505. p. Available from: http://www.petronet.ir/documents/10180/2323242/Trace_Elements_in_Soils_and_Plants. [Google Scholar]
- 20.Chen ZS, Lee DY, Lin CF, Lo SF, Wang YP. Contamination of rural and urban soils in Taiwan. In: Naidu R, Kookuna RS, Oliver DP, Rogers S, McLaughlin MJ, . Contaminants and the soil environment in the Australasia-Pacific Region: Proceedings of the first Australasia-Pacific conference on contaminants and soil environment in the Australasia-Pacific region [Internet]. 1996 Feb 18–23; Adelaide, Australia. Dordrecht, Natherlands: Kluwer Academic Publishers; 1999 [cited 2015 Jun 11]. pp. 691–709. In. editors. p. Available from: http://link.springer.com/chapter/10.1007%2F978-94-009-1626-5_25. [Google Scholar]
- 21.Sekabira K, Origa HO, Basamba TZ, Mutumba G, Kakudidi E. Assessment of heavy metal pollution in the urban stream sediments and its tributaries. Int J Environ Sci Technol[Internet] 2010 June [cited 2010 Jan 8];7(3):435–46. Available from: http://link.springer.com/article/10.1007/BF03326153 Subscription required to view. [Google Scholar]
- 22.Krishna AK, Govil PK. Soil contamination due to heavy metals from an industrial area of Surat, Gujarat, Western India. Environ Monit Assess [Internet] 2007 Jan [cited 2015 Jan 7];124(1):263–75. doi: 10.1007/s10661-006-9224-7. Available from: http://link.springer.com/article/10.1007/s10661-006-9224-7 Subscription required to view. [DOI] [PubMed] [Google Scholar]
- 23.Adeniyi AA, Afolabi JA. Determination of total petroleum hydrocarbons and heavy metals in soils within the vicinity of facilities handling refined petroleum products in Lagos metropolis. Environ Int [Internet] 2002 Apr [cited 2015 Apr 23];28(1–2):79–82. doi: 10.1016/s0160-4120(02)00007-7. Available from: http://www.sciencedirect.com/science/article/pii/S0160412002000077 Subscription required to view. [DOI] [PubMed] [Google Scholar]