Abstract
To investigate whether the maximum Watts factor (WF) is 1 parameter of describing detrusor contraction in male patients with lower urinary tract symptoms (LUTS).
We retrospectively reviewed urodynamic data of male subjects with LUTS. Data on age, maximum flow rate (Qmax), post-void residual (PVR), detrusor pressure at maximum flow rate (PdetQmax), maximum Watts factor (WFmax), and Schafer contractility grades were collected. First, all patients were divided into 6 groups according to Schafer contractility grade. The urodynamic parameters include WFmax and bladder contractility index (BCI) were compared and analyzed among the 6 groups by using Kruskal–Wallis test statistically. The box plot of Schafer contractility grade with WFmax or BCI were plotted and analyzed. Second, the correlation scatter diagram between WFmax and BCI was plotted and analyzed. Spearman's correlation test was performed. Third, we drew the Receiver Operating Characteristic (ROC) curve and confirmed the area under the curve, the Optimal Operating Point (OOP) and corresponding sensitivity and specificity for WFmax by the reference standard of Schafer contractility grade and BCI respectively.
A total of 455 men were included. The mean age of patients was 57 ± 17.9 years, ranging from 18 to 87 years. Median of WFmax increased from 5.8 W/m2 in very week (VW) group to 19.5 W/m2 in strong (ST) group, while BCI rose from 70 to 170. The box plot of Schafer contractility grade with WFmax or BCI showed that both WFmax and BCI were positively correlated with Schafer contractility grade. Kruskal-Wallis test among the 6 groups showed statistically significant difference (P <.001). The correlation scatter diagram showed that WFmax increased significantly with BCI (Fig. 3), the linear regression equation being Y = 3.33 + 0.07X, R2 = 0.298. Spearman's correlation test revealed that WFmax and BCI were positively correlated, with the correlation coefficient being 0.616 (P <.001). The WFmax area under ROC curve by Schafer contractility grade was 0.894 and WFmax OOP was interpreted at 11.1 W/m2. In addition, the area under ROC curve by BCI was 0.802 and WFmax OOP was interpreted at 9.8 W/m2.
Our findings suggestted that WFmax was a good parameter of evaluating detrusor contraction as well as Schafer contractility grade and BCI, which should be widely used in clinical.
Keywords: Bladder contractility index, detrusor contraction, Schafer contractility grade, Watts factor
1. Introduction
It has been generally accepted by urologists that bladder detrusor contracts and urethral sphincter relax simultaneously during voiding phase, and then urine comes out smoothly. Weaker detrusor contraction or higher urethral resistance can both result in voiding dysfunction. Detrusor contraction is a subject of active investigation and poses a great challenge. It plays an important role in generating uroflow and is dictated by a number of physiological and pathophysiological factors, such as neurological, behavioral, mental, psychogenic, and hormonal factors.[1] Meanwhile, long-term retention of residual urine in bladder tends to cause severe urinary tract infection (UTI), hydronephrosis, and even renal insufficiency.[2,3] Therefore, identification of the causes and suitable management are of great importance.
Bladder outlet relation (BOR), the isovolumetric detrusor pressure (Pdet), stop test, U/L parameter, force/velocity plots, pressure/velocity plots were used to measure detrusor contraction previously.[4] Currently, methods for measuring detrusor contraction in clinical setting include PdetQmax, Schafer contractility grade, bladder contractility index (BCI), Watts factor (WF), detrusor contractility coefficient (DECO), the detrusor-adjusted mean passive urethral resistance relation (PURR) factor (DAMPF).[5–8] In addition, some new noninvasive techniques are also being studied, such as ultrasonographic measurement of detrusor wall thickness, and measurement of the maximum condom pressure.[9,10] However, they have not been well accepted and standard parameter is not available. And methods used vary with different settings or clinicians.
Over the past, Schafer contractility grade and BCI are most commonly used. WF had been proposed by Griffiths for more than thirty years. However, this parameter is not widely used maybe because of its complexity. No much attention has been paid to this parameter and reports on WF were scanty. In this study, we compared WFmax with Schafer contractility grade and BCI and analyzed whether the maximum WF was 1 parameter of describing detrusor contraction in male patients with LUTS.
2. Materials and methods
Between January 2013 and March 2016, 961 male patients had been done urodynamic test in our urodynamic center of Wuhan Union Hospital. Among the 961 male patients, 455 male subjects clinically diagnosed single lower urinary tract symptoms (LUTS) were selected except history of pelvic surgery, radiotherapy, upper urinary tract diseases, UTI, urinary system cancer or stone, traumatic urethral stricture, neurogenic diseases, diabetes mellitus and previous use of α-blockers or M-blockers over the past 1 month. Clinical manifestations were frequency, urgency, dysuria, urinary incontinence, voiding dysfunction, and so on.
All patients had undergone physical examination, urinalysis, urine culture, prostate-specific antigen (PSA), kidney-ureter-bladder-prostate ultrasound, and complete urodynamic tests, with detailed data on medical history collected. Patients were included only when the urinalysis, urine culture, urinary system ultrasound results were all negative at the investigation.
The complete urodynamic tests were performed all by 1 experienced investigator using an Aquarius urodynamics (UDS) system (Laborie Medical Systems, Canada), in strict accordance with the international incontinence society (ICS)-Good Urodynamic Practices standards. Indications for urodynamic tests were extensive. All patients accompanied with abnormal urination should proceed urodynamic tests except UTI, urethra rupture, intolerant patients, and so on. The UDS procedure was done step-by-step as follows.
-
1.
Patients were asked to present with a full bladder and urinate into a given container. A computer recorded the volume and time and plotted the uroflow curve.
-
2.
Then patients were put in a lithotomy position. After sterilization, draping and catheterization, the post-void residual (PVR) urine volume was measured.
-
3.
A transurethral 6-Fr double-lumen catheter was inserted into bladder and a10-Fr single-lumen catheter was placed into the rectum for about 10 to 15 cm to record the pressure of bladder and abdomen. The 2 catheters were connected with urodynamic equipment, and then patient was put in a comfortable sitting position.
-
4.
All systems are zeroed at atmospheric pressure. The bladder was filled with normal saline at a speed of 20 to 40 mL/min. Meanwhile, we observed the sensation, volume, compliance and stability of bladder.
-
5.
Filling was stopped when the patient had a strong desire to void, and then the patient was allowed to urinate in a private environment as usual.
-
6.
Finally, pressure-flow analysis was done by the computer program automatically.
Data on maximum flow rate (Qmax), PVR, PdetQmax, WFmax, and Schafer contractility grades were collected. Qmax was the maximum value of free uroflow rate corrected by hand when needed. PVR was measured by catheterization, the golden standard measurement. PdetQmax was the Pdet at the highest uroflow during the voiding phase. WFmax was the maximum WF obtained from the WF graph.
All patients were divided into 6 groups in terms of Schafer contractility grade, including very weak contraction (VW) group, weak − contraction (W−) group, weak + contraction (W+) group, normal − contraction (N−) group, normal + contraction (N+) group and strong contraction (ST) group.[11] BCI was calculated applying the following formula: BCI = PdetQmax + 5Qmax.[12,13] We employed 3 methods to compare WFmax with Schafer contractility grade and BCI.
-
1.
All urodynamic parameters include WFmax and BCI were compared and analyzed among 6 groups by using Kruskal–Wallis test statistically. The box plot of Schafer contractility grade with WFmax or BCI were plotted and analyzed.
-
2.
The correlation scatter diagram between WFmax and BCI was plotted and analyzed. Spearman's correlation test was performed statistically.
-
3.
We drew the Receiver Operating Characteristic (ROC) curve for WFmax by the reference standard of Schafer contractility grade and BCI respectively. N−, N+, ST Schafer contractility groups (n = 185) were regarded as normal contraction. VW, W−, W+ Schafer contractility groups (n = 270) were regarded as weak contraction. BCI ≥100 (n = 262) classified as normal contraction, BCI <100 (n = 193) classified as weak contraction. Then we plotted ROC curve and confirmed the area under the curve, the Optimal Operating Point (OOP) and corresponding sensitivity and specificity.
A P value ≤.05 was considered to be statistically significant. All statistical analysis were done by using SPSS, version 21.
3. Results
A total of 455 men were included. The mean age of patients was 57 ± 17.9 years, ranging from 18 to 87 years. When grouped according to Schafer contractility grade, VW, W−, W+, N−, N+, ST contraction groups included 55, 88, 127, 83, 62, 40 patients, respectively.
-
1.
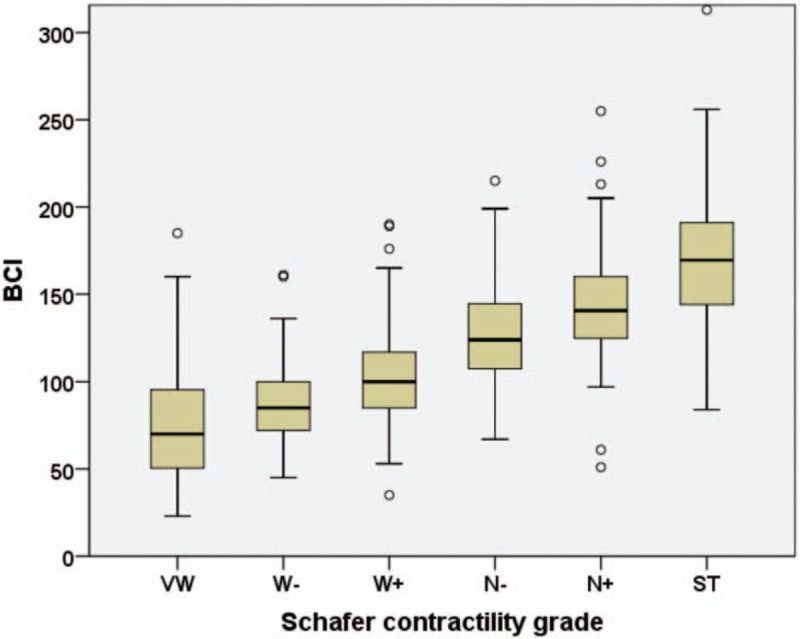
The age, Qmax, PVR, PdetQmax, WFmax, and BCI in 6 groups were expressed as medians, with 25 and 75 percentiles (Table 1). Median value of WFmax increased from 5.8 W/m2 in VW group to 19.5 W/m2 in ST group, while median value of BCI rose from 70 to 170 (Fig. 1). The box plot of Schafer contractility grade with WFmax or BCI showed that both WFmax and BCI were positively correlated with Schafer contractility grade (Figs. 2 and 3). Kruskal–Wallis test among the 6 groups showed statistically significant difference (P <.001).
-
2.
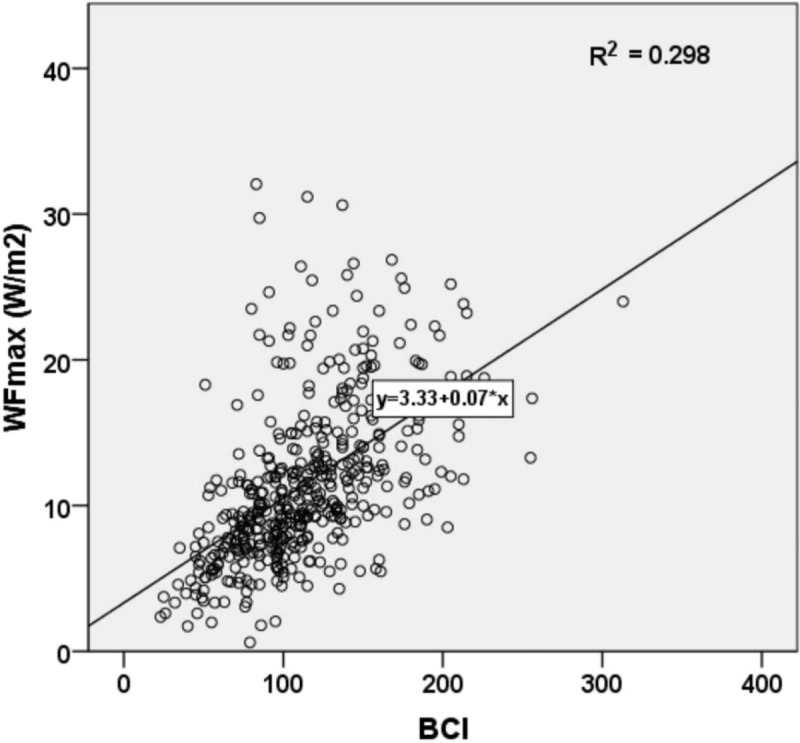
The correlation scatter diagram showed that WFmax increased significantly with BCI (Fig. 3), the linear regression equation being Y = 3.33 + 0.07X, R2 = 0.298. Spearman's correlation test revealed that WFmax and BCI were positively correlated, with the correlation coefficient being 0.616 (P <.001).
-
3.
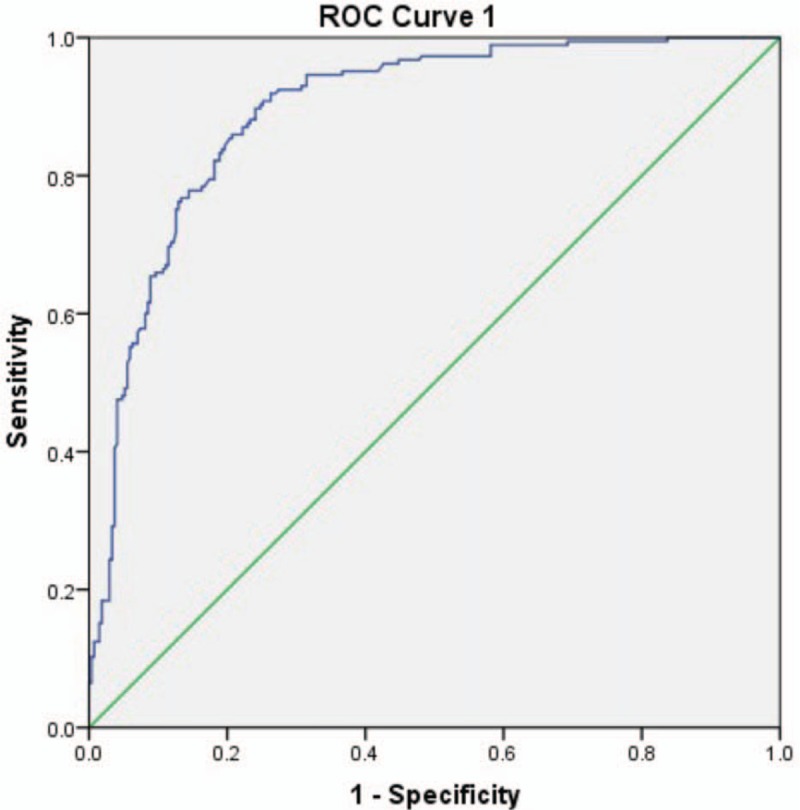
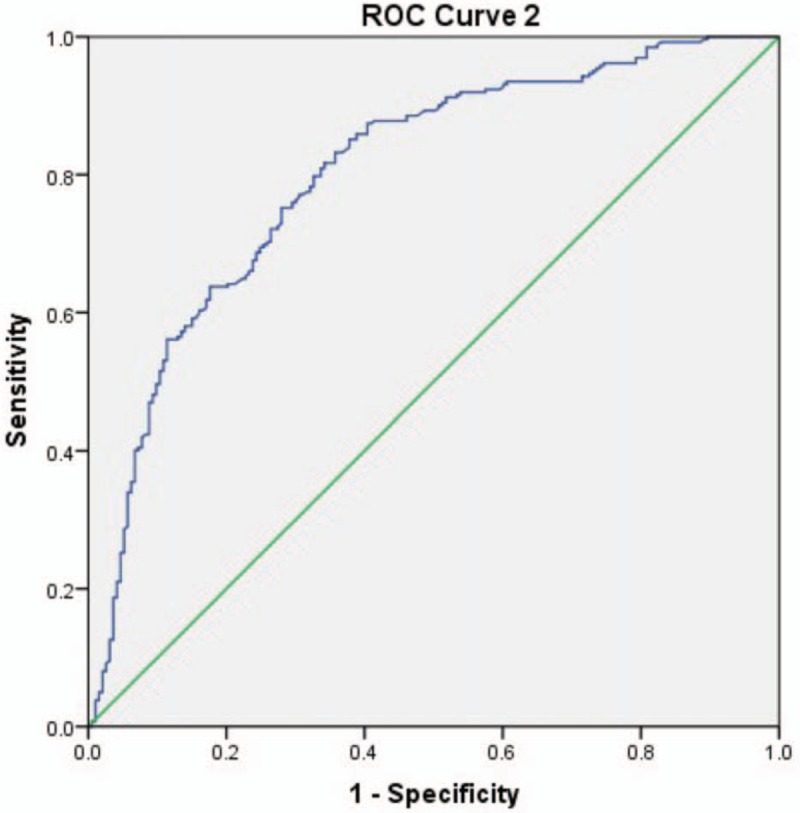
The WFmax area under ROC curve by Schafer contractility grade was 0.894 and WFmax OOP was interpreted at 11.1 W/m2 (Fig. 4). In addition, the area under ROC curve by BCI was 0.802 and WFmax OOP was interpreted at 9.8 W/m2 (Fig. 5).
Table 1.
Urodynamic parameters in 6 groups are expressed as medians (25% and 75% percentiles). The P value is based on Kruskal–Wallis test that compared different parameters in the 6 groups.

Figure 1.

The WFmax in relation to Schafer contractility grades. WFmax = maximum Watts factor.
Figure 2.

The BCI in relation to Schafer contractility grades. = bladder contractility index
Figure 3.

The scatter diagram between WFmax and BCI. BCI = bladder contractility index, WFmax = maximum Watts factor.
Figure 4.

ROC curve 1 for WFmax by reference standard of Schafer contractility grade. ROC = Receiver Operating Characteristic, WFmax = maximum Watts factor.
Figure 5.

ROC curve 2 for WFmax by reference standard of BCI. BCI = bladder contractility index, ROC = Receiver Operating Characteristic, WFmax = maximum Watts factor.
4. Discussion
As we know it, shortening of detrusor smooth muscles generates bladder contraction, and then bladder pressure increases and changes with the urine flow. The Pdet only reflects its contraction when there is no urine flow. Furthermore, higher Pdet is not essential for voiding when outlet resistance is much lower. Therefore, Pdet alone is not an accurate measure of detrusor contraction.[4]
Schafer nomogram, also known as the PURR, is a non-parametric indicator. Schafer nomogram consists of Schafer obstruction nomogram and Schafer contraction nomogram, which can only indicate the rough degree of contraction and bladder outlet obstruction (BOO). Obstruction is divided into 7 groups include 0, I, II, III, IV, V, and VI. Detrusor contraction is divided into 6 groups include VW, W−, W+, N−, N+, ST. Note that, it is not suitable for female patients, only limited to male.
BCI is a quantitative parameter, derived from Schafer nomogram. The formula is as follows: BCI = PdetQmax+5Qmax. BCI >150 indicates strong contraction, BCI between 100 and 150 normal contraction, and BCI <100 weak contraction.[14] According to the formula, Qmax is the major determinant of BCI. Then BCI is very sensitive to the change of Qmax, especially to artifact. Additionally, the slope may need to be adjusted for different populations, since the slope should be 1 cmH2O/ml/s for older women, that is, BCI = PdetQmax + Qmax.[10,15]
WF, or detrusor contraction strength, represents the mechanical power per unit area of bladder surface generated by detrusor contraction during the voiding phase.[16] Any muscle contraction can be described by the muscle length and shortening rate, and detrusor is no exception.[1] In other words, WF is calculated from Pdet in relation to the bladder volume (representing muscle length) and the flow rate (representing shortening velocity) at a given time point. The formula is as follows: WF = [(Pdet+a)(Vdet+b)-ab]/2π, where Vdet = Q/2[3 (V + Vt)/2π]2/3, a = 25 cmH2O, b = 6 mm/s, Vt = 10 ml, Q = uroflow, V = total bladder volume.[17] Because Pdet and Vdet change during voiding, the WF also varies throughout the entire micturition. WF graph is automatically generated on the basis of bladder volume (X-axis) and WF (Y-axis) by the computer program. Going toward the left over time, the curve starts at right side (full bladder) and ends at the left (emptied bladder). The length between the origin point and the starting point at right side of the curve can indicate the full bladder volume. What is more, residual volume can be determined from the length between the origin point and the end point on the left side of curve. In a word, WF integrates both Pdet, Vdet, uroflow, and bladder volume, other than Schafer nomogram and BCI only contain Pdet and Qmax. Therefore, we consider WF can reflect the detrusor function to some extent. WFmax is the most representative value. Moreover, different from Schafer nomogram, WF can be used in female.
In this study, Table 1 showed that median value of WFmax increased from 5.8 W/m2 in VW group to 19.5 W/m2 in ST group, while median value of BCI rose from 70 to 170. The box plot of Schafer contractility grade with WFmax or BCI in Figures 2 and 3 showed that both WFmax and BCI were positively correlated with Schafer contractility grade. Kruskal-Wallis test among the six groups showed statistically significant difference (P <.001). Second, correlation analysis exhibited that WFmax and BCI bore a strong positive correlation (Fig. 3). These all showed that WFmax has similar change trend with Schafer contractility grade and BCI. Third, from the above 2 ROC curves, we could conclude WFmax was 1 parameter to identify normal detrusor contraction from detrusor underactivity, but without standard cutoff value. All the 3 methods of comparison with each other suggested that WFmax can work as well as Schafer contractility grade and BCI as a measurement of the detrusor contraction.
Griffiths reported that WF can represent general trend of detrusor contraction, which was in line with our conclusion.[4] Additionally, Lecamwasam et al studied WFmax in a canine model of acute outlet obstruction and found that WFmax was independent of the degree of acute outlet obstruction and could be used to evaluate the detrusor function in patients with voiding dysfunction regardless of outlet resistance.[18] Oelke et al also identified a positive relation between BCI and WFmax in patients with LUTS suggestive of benign prostatic hyperplasia (BPH).[19] Ten DSC et al. also compared the Schäfer pressure-flow nomogram (LinPURR) with BCI and the maximum Watt factor (Wmax) in 1222 LUTS men (aged >50 years). They found that the Schäfer pressure-flow nomogram (LinPURR) and BCI, as well as LinPURR and Wmax, showed a high agreement of 97.5% and 80.9%, respectively. Therefore, they concluded both grading systems were meaningful to define clinically relevant patient groups.[20]All these 4 previous studies showed WFmax was a good parameter to evaluate detrusor contraction, which provided valuable evidence for our study.
Nonetheless, WF does not provide a measure of contraction sustainability and involves a complex calculation, limiting its use in clinical practice. What is more, threshold values for normal have not been validated? Some experts suggested a variety of cutoff value, such as 7 W/m2, 8 W/m2, 10 W/m2, 10.85 W/m2, and 12 W/m2.[21–26] Additionally, our study was only limited to male patients with LUTS and cannot be extrapolated to their female counterparts because of the differences in anatomical structure and micturition mode. Therefore, further study about WF is still warranted. Another limitation of this study was we did not provide standard control group according that there was no acknowledged golden standard of detrusor contraction at present.
5. Conclusions
Our findings suggestted that WFmax was a good parameter of evaluating detrusor contraction as well as Schafer contractility grade and BCI and should be widely used in clinical.
Acknowledgments
The authors would like to thank the staffs of Urodynamic center, Union Hospital, Tongji Medical College, Huazhong University of Science and Technology, for facilitating the patients in this study.
Author contributions
Conceptualization: Ying Li.
Data curation: Dandan Liu, Ying Li.
Formal analysis: Dandan Liu.
Investigation: Dandan Liu, Ying Li.
Methodology: Dandan Liu, Min Chen, Xiaomin Han.
Project administration: Min Chen.
Resources: Dandan Liu, Xiaomin Han.
Software: Dandan Liu, Xiaomin Han.
Supervision: Min Chen, Xiaomin Han.
Visualization: Min Chen.
Writing – original draft: Dandan Liu.
Writing – review & editing: Xiaomin Han.
Footnotes
Abbreviations: BCI = bladder contractility index, LUTS = lower urinary tract symptoms, OPP = Optimal Operating Point, Pdet = detrusor pressure, PURR = passive urethral resistance relation, Qmax = maximum flow rate, ROC = Receiver Operating Characteristic, UDS = urodynamics, UTI = urinary tract infection, WF = Watts factor, WFmax = maximum Watts factor.
All procedures performed in studies involving human participants were in accordance with the ethical standards of the institutional and/or national research committee and with the 1964 Helsinki declaration and its later amendments or comparable ethical standards.
Informed consent was obtained from all individual participants included in the study.
Comparative study of the maximum Watts factor (WFmax) and Schafer contractility grade, bladder contractility index (BCI) in male patients with lower urinary tract symptoms (LUTS)
The authors have no conflicts of interest to disclose.
References
- [1].Sullivan M, Yalla SV. Functional Studies to Assess Bladder Contractility. J Urologie Urogynakol 2007;14:7–9. [Google Scholar]
- [2].Stoffel JT. Non-neurogenic chronic urinary retention: what are we treating. Curr Urol Rep 2017;18:74. [DOI] [PubMed] [Google Scholar]
- [3].Zambon JP, Koslov DS, Mihai B, et al. Bladder and ureteral dysfunction leading to hydronephrosis/hydroureteronephrosis in adults. Urology 2018;117:1–8. [DOI] [PubMed] [Google Scholar]
- [4].Griffiths DJ. Assessment of detrusor contraction strength or contractility. Neurourol Urodynamics 1991;10:1–8. [Google Scholar]
- [5].Elmissiry MM, Ali AG, Abulfotooh A, et al. Factors determining the amount of residual urine in men with bladder outlet obstruction: Could it be a predictor for bladder contractility. Arab J Urol 2014;12:214–8. [DOI] [PMC free article] [PubMed] [Google Scholar]
- [6].Ahmed A, Farhan B, Vernez S, et al. The challenges in the diagnosis of detrusor underactivity in clinical practice: a mini-review. Arab J Urol 2016;14:223–7. [DOI] [PMC free article] [PubMed] [Google Scholar]
- [7].Xing L, Liao L. Updates of underactive bladder: a review of the recent literature. Int Urol Nephrol 2016;48:919–30. [DOI] [PubMed] [Google Scholar]
- [8].Fusco F, Groutz A, Blaivas JG, et al. Videourodynamic studies in men with lower urinary tract symptoms: a comparison of community based versus referral urological practices. J Urol 2001;166:910–3. [PubMed] [Google Scholar]
- [9].Rademakers KL, van Koeveringe GA, Oelke M. Detrusor underactivity in men with lower urinary tract symptoms/benign prostatic obstruction: characterization and potential impact on indications for surgical treatment of the prostate. Curr Opin Urol 2016;26:3–10. [DOI] [PubMed] [Google Scholar]
- [10].Mastrigt RV, Boevé ER, Groen J, et al. Urinary bladder contractility revisitedcorrelation of noninvasively and invasively measured contractility parameters in patients eligible for transurethral resection of the prostate. Urology 2015;86:128–32. [DOI] [PubMed] [Google Scholar]
- [11].Schäfer W. Analysis of bladder-outlet function with the linearized passive urethral resistance relation, linPURR, and a disease-specific approach for grading obstruction: from complex to simple. World J Urol 1995;13:47–58. [DOI] [PubMed] [Google Scholar]
- [12].Griffiths DJ. Detrusor contractility-order out of chaos. Scandinavian J Urol Nephrol Supplement 2004;215:93–100. [DOI] [PubMed] [Google Scholar]
- [13].Choo MS, Cho SY, Han JH, et al. The cutoff value of bladder voiding efficiency for predicting surgical outcomes after GreenLight HPS laser photoselective vaporization of the prostate. J Endourol 2014;28:969–74. [DOI] [PubMed] [Google Scholar]
- [14].Griffiths D, Abrams P, D’Ancona CA, et al. The urodynamic evaluation of lower urinary tract symptoms in men. Curr Bladder Dysfunct Rep 2008;3:49–57. [Google Scholar]
- [15].Tan TL, Bergmann MA, Griffiths D, et al. Stop test or pressure-flow study? Measuring detrusor contractility in older females. Neurourol Urodynamics 2004;23:184–9. [DOI] [PubMed] [Google Scholar]
- [16].Bsci KT, Ryuji S, Bsci AO, et al. Weak detrusor contractility correlates with motor disorders in Parkinson's disease. Mov Disord Off J Mov Disord Soc 2012;27:1775–80. [DOI] [PubMed] [Google Scholar]
- [17].Oelke M, Rademakers KL, Koeveringe GA. Unravelling detrusor underactivity: development of a bladder outlet resistance-bladder contractility nomogram for adult male patients with lower urinary tract symptoms. Neurourol Urodynamics 2016;35:980–6. [DOI] [PubMed] [Google Scholar]
- [18].Lecamwasam HS, Yalla SV, Cravalho EG, et al. The maximum watts factor as a measure of detrusor contractility independent of outlet resistance. Neurourol Urodynamics 1998;17:621–35. [DOI] [PubMed] [Google Scholar]
- [19].Oelke M, Rademakers KL, Koeveringe GA. Detrusor contraction power parameters (BCI and WFmax) rise with increasing bladder outlet obstruction grade in men with lower urinary tract symptoms: results from a urodynamic database analysis. World J Urology 2014;32:1177–783. [DOI] [PubMed] [Google Scholar]
- [20].Ten DSC, Rosier P, De Kort L. Comparison of three methods to analyze detrusor contraction during micturition in men over 50 years of age. Neurourol Urodynamics 2017;36:2153–9. [DOI] [PubMed] [Google Scholar]
- [21].Van Koeveringe GA, Vahabi B, Andersson KE, et al. Detrusor underactivity: a plea for new approaches to a common bladder dysfunction. Neurourol Urodynamics 2011;30:723–8. [DOI] [PubMed] [Google Scholar]
- [22].Noritoshi S. Bladder contractility and urethral resistance relation: what does a pressure flow study tell us? Int J Urol Off J Jpn Urol Assoc 2012;19:216–28. [DOI] [PubMed] [Google Scholar]
- [23].Watanabe T, Miyagawa I. Characteristics of detrusor contractility during micturition in diabetics. Neurourol Urodynamics 1999;18:163–71. [DOI] [PubMed] [Google Scholar]
- [24].Mitsui T, Tanaka H, Harabayashi T, et al. Changes in urodynamics and lower urinary tract symptoms after radical prostatectomy: implications of preoperative detrusor contractility. Low Urin Tract Symptoms 2012;4:82–6. [DOI] [PubMed] [Google Scholar]
- [25].Rosier PF, Wildt MJ, Rosette JJ, et al. Analysis of maximum detrusor contraction power in relation to bladder emptying in patients with lower urinary tract symptoms and benign prostatic enlargement. J Urol 1995;154:2137–42. [PubMed] [Google Scholar]
- [26].Cucchi A, Quaglini S, Guarnaschelli C, et al. Urodynamic findings suggesting two-stage development of idiopathic detrusor underactivity in adult men. Urology 2007;70:75–9. [DOI] [PubMed] [Google Scholar]


