Abstract
This study aimed to analyze the relationship between pathologic complete response (pCR) and changes in background parenchymal enhancement (BPE) levels in patients with human epidermal growth factor receptor 2 (HER2)-positive breast cancer and who received neoadjuvant chemotherapy (NAC).
The pre- and post-NAC magnetic resonance imaging results of 51 patients with confirmed unilateral HER2-positive breast cancer were retrospectively analyzed by 2 experienced radiologists. Pre- and post-NAC of contralateral BPE levels were classified into 4 categories (1 = minimal, 2 = mild, 3 = moderate, and 4 = marked). The 4 categories of BPE were defined by the visually estimated enhancement of fibroglandular tissue of the breast. Changes in BPE before and after NAC were compared between the premenopausal and postmenopausal groups and between the pCR and non-pCR groups. The associations between BPE and pCR and between BPE and tumor size were analyzed before and after NAC.
Twenty-three patients achieved pCR, and 28 patients achieved non-pCR. Premenopausal patients had significantly higher baseline BPE levels than postmenopausal women (P = .023). The post-NAC BPE levels of premenopausal patients significantly decreased relative to those of postmenopausal patients (P = .027). The baseline BPE levels of the pCR group were not significantly different from those of the non-pCR group (P = .892). However, the decrease in BPE levels in the pCR group was more drastic than that in the non-pCR group (P < .001). Decreased BPE levels were directly associated with pCR and tumor size reduction (P < .05). Women with hormone receptor (HR)-negative tumors were more likely to exhibit pCR than those with HR-positive tumors (P = .007).
Decreased BPE of patients with HER2-positive breast cancer may serve as an indicator of NAC effectiveness. Furthermore, women with HR-negative tumors were more likely to exhibit pCR than women with HR-positive tumors.
Keywords: background parenchymal enhancement, breast cancer, HER2-positive, MRI, neoadjuvant chemotherapy, pathologic complete response
1. Introduction
Breast cancer seriously affects the health of women worldwide and is the commonly reported malignant tumor among women. The prevalence of breast cancer has gradually increased in recent years. Human epidermal growth factor receptor 2 (HER2)-positive breast cancer has been shown to be 20% to 25% of all breast cancer cases.[1]
Neoadjuvant chemotherapy (NAC) is a treatment for operable breast cancer.[2] This method can induce pathologic complete response (pCR) and improve long-term prognosis among patients with HER2-positive breast cancer.[3,4] An accurate assessment of tumor response to NAC is important to determine and manage follow-up treatment. Dynamic contrast-enhanced magnetic resonance imaging (DCE-MRI) is used to monitor the post-NAC response of patients with breast cancer.[5,6] A breast MRI report should first describe the amount of fibroglandular tissues, and background parenchymal enhancement (BPE) is defined as the enhancement of normal breast tissues after contrast injection in DCE-MRI.[7] Research has shown that BPE does not decrease the cancer detection rate but increases the call-back rate, and it is recommended by breast imaging and reporting data system.[8]
BPE levels can be affected by age, menopausal status, menstrual cycle, and hormone therapy.[9–11] For example, the BPE levels of patients aged more than 50 years tend to be lower than those of patients aged less than 50 years.[12] The BPE levels of postmenopausal women are significantly lower than those of premenopausal women.[13] BPE is the lowest at the second week of the menstrual cycle.[10] The BPE level decreases following tamoxifen treatment and is increased by hormone replacement therapy (HRT) in postmenopausal women.[9,14] NAC can affect the BPE levels of normal breast and breast cancer tissues; thus, BPE levels may reflect the therapeutic response or prognosis of patients with cancer.[15–17] Patients with higher pre-NAC BPE levels have been shown to have poor recurrence-free survival.[16] The higher degree of BPE reduction after NAC is associated with good tumor response (Response Evaluation Criteria in Solid Tumors 1.1 criteria).[17] The reduction in the BPE levels during the early stage of NAC is positively associated with pCR, particularly in patients with hormone receptor (HR)-negative cancer.[18]
Previous studies mostly focused on the relationship between tumor size or pCR and change in BPE for various phenotypes of breast cancers.[19,20] Different phenotypes and pathological types of breast cancer may result in alteration in BPE. HER2-positive breast cancer is associated with higher metastases and mortality rates, shorter disease-free survival, and lower overall survival rate.[21] Thus, the effect of NAC is crucial to HER2-positive breast cancer. We studied unilateral invasive ductal breast cancer of HER2-positive breast cancer to develop a novel approach to BPE for predicting pCR.
This study aimed to analyze changes in the BPE levels of contralateral normal breast with HER2-positive breast cancer during NAC and investigate whether the change in BPE could serve as an indicator of NAC effectiveness.
2. Materials and methods
2.1. Study subjects and treatments
Our retrospective study was approved by the Ethics Committee at the Affiliated Hospital of Binzhou Medical University. The review of medical records or images does not require the consent of patient.
Patients who met the following inclusion criteria from August 2013 to February 2018 were retrospectively analyzed: underwent unilateral invasive ductal cancer (IDC) with HER2-positive tumor confirmed by preoperative core-needle biopsy and postoperative pathology of NAC; subjected to MRI examinations before and after NAC; and treated with neoadjuvant trastuzumab-based chemotherapy. The exclusion criteria are as follows: patients who did not undergo surgical treatment after NAC; patients with insufficient MRI data; and patients who had incomplete chemotherapy.
One hundred forty-five patients with breast cancer were treated with NAC and considered for the study. Of these, 8 patients were excluded; 3 patients did not undergo surgical treatment after NAC, 3 patients had insufficient MRI data, and 2 patients had incomplete chemotherapy. Of the remaining 137 patients, 89 patients had unilateral IDC with HER2-positive tumor, 59 patients were treated with neoadjuvant trastuzumab-based chemotherapy, and 51 patients underwent MRI examinations before and after NAC. Finally, 51 patients were included in the analysis. Our study sample included 51 patients with a mean age of 46.24 ± 8.79 years and an age range of 27 to 63 years (Fig. 1).
Figure 1.
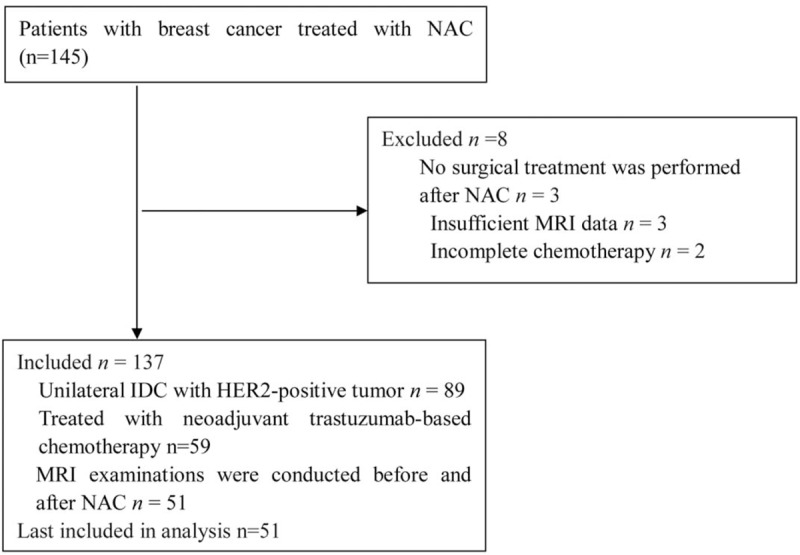
Patient selection.
The chemotherapy protocols were standardized as follows: docetaxel, carboplatin, and trastuzumab (n = 29); and doxorubicin, cyclophosphamide, docetaxel, and trastuzumab (n = 22). These patients received at least 6 or 8 cycles of NAC followed by surgical operation. No patients received HRT or radiation therapy prior to surgery.
2.2. Breast MRI
Breast MRI was performed with patients in the prone position by using a 3.0 T MRI (Skyra, Siemens, Munich, Germany) with a 4-channel dedicated breast coil. All patients underwent routine MRI sequences and DCE-MRI before and after NAC. The routine MRI sequences consisted of T1 gradient echo sequence (repetition time of 169.0 ms, echo time of 2.61 ms, field of view of 340 mm, matrix of 352 × 246, slice thickness of 4 mm, flip angle of 70°, and 2D SPGR) and T2-weighted fat-suppressed sequence (repetition time of 3630 ms, echo time of 68 ms, field of view of 340 mm, matrix of 320 × 240, slice thickness of 4 mm, and flip angle of 80°). DCE-MRI consisting of 1 phase before enhancement and 7 phases after enhancement was performed by using volumetric interpolated breath-hold examination sequence (repetition time of 4.49 ms, echo time of 1.68 ms, field of view of 340 mm, matrix of 352 × 260, slice thickness of 1.2 mm, and flip angle of 10°). At 12 s after the first phase, 0.2 mL/kg gadopentetate dimeglumine (Germany, Berlin, Schering Co, Ltd (SCHERING)) was injected at a rate of 2.5 mL/s into the median cubital vein by using an antecubital vein pressure injector. The injection was followed by a 20 mL saline flush. The enhancement parameters of the 5 phases after enhancement were identical to those of the first sequence. Subtraction and maximum intensity projection images were obtained. All images were acquired with bilateral axial views. Tumor size was measured at the first phase after injecting the contrast material. BPE was assessed using subtraction images, and the time point was the first phase after contrast material injection. To prevent treatment delay, cycle status was not taken into account when scheduling MRI; thus, we did not analyze the effect of the menstrual cycle on BPE levels.[17]
2.3. Data collection
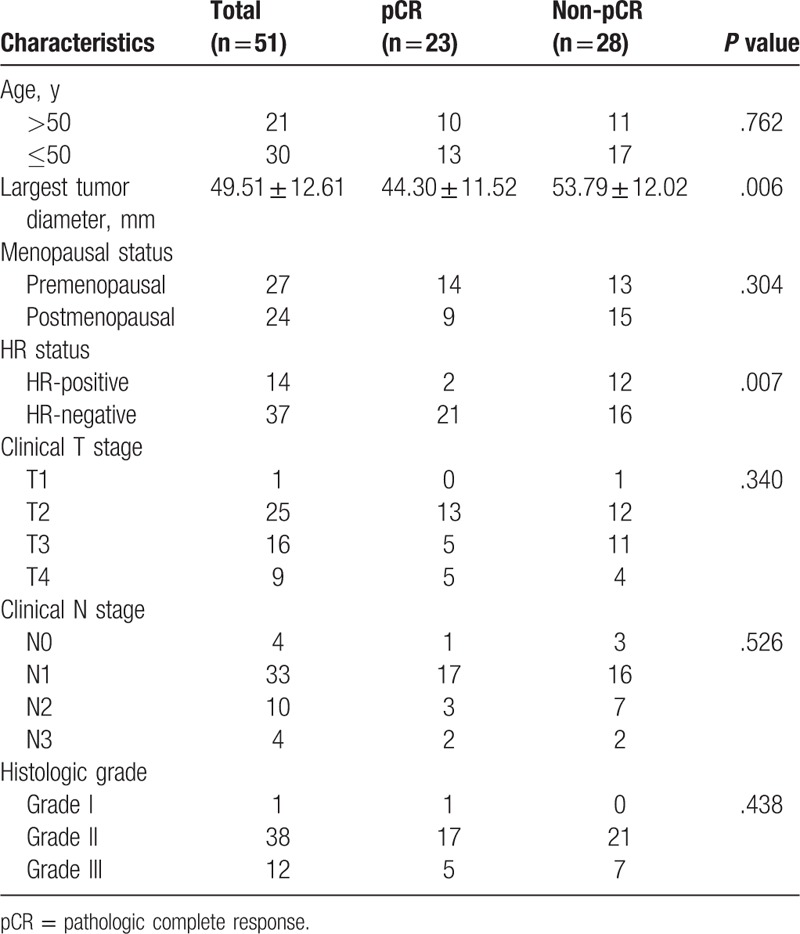
The baseline characteristics of the patients were noted; the following data were obtained: age, largest tumor diameter, menopausal status, HR status (estrogen (ER), progesterone (PR), clinical T stage, clinical N stage, and histologic grade (Table 1). HR-positive status was defined as ≥10% ER and/or PR expression; otherwise, the status is negative.[22]
Table 1.
Patient baseline characteristics in pCR and non-pCR groups.
A mass is 3D and occupies space structure. Nonmass enhancement (NME) is the enhancement of an area that is not a mass and may extend over small or large regions, whose internal enhancement characteristics can be described as a pattern discrete from the normal surrounding breast parenchyma.[7] The largest tumor diameter of mass and NME was measured. Post-NAC reduction in tumor size on MRI was calculated as follows: Δsize = (tumor sizepost-NAC − tumor sizepre-NAC)/tumor sizepre-NAC × 100%.
All images were reviewed by 2 radiologists who were blinded to the patients’ information. The 2 radiologists had 6 and 7 years of experience in assessing breast images. When opinions differed between the 2 radiologists, a consensus was reached on the overall assessment. The 4 categories of BPE are defined by the visually estimated enhancement of the fibroglandular tissue of the breast.[7] BPE levels were categorized as 1 = minimal, 2 = mild, 3 = moderate, and 4 = marked before and after NAC. The 2 radiologists evaluated the BPE categories of the contralateral breast before and after NAC and in premenopausal and postmenopausal women. After NAC, the BPE levels were divided into 2 groups: unchanged and decreased BPE (no BPE levels increased). According to the BPE levels before and after NAC, the decreased BPE levels were further divided into 3 categories: 1 level, 2 levels, and 3 levels (For example, the BPE level was 4 = marked before NAC and 1 = minimal after NAC, the decreased BPE levels should be 3 levels).
2.4. Pathologic assessment
The final surgical specimen (lumpectomy versus mastectomy) was used to assess pCR, which was defined as no residual tumor or only ductal carcinoma in situ.[23] HER2-positive was defined as standard immunohistochemical (IHC) 3+ or positive fluorescence in situ hybridization (FISH). If the IHC test of the patient was 3+, then the cancer was directly diagnosed as HER2-positive; if the IHC test result was 2+, then the result was confirmed through FISH. If the IHC test result was 1+ or 0, then the cancer was defined as HER2-negative.[24] The assessment was performed by 2 experienced pathologists.
2.5. Statistical analysis
Statistical Package for Social Sciences 19.0 software (IBM Company, Illinois) was used for data analysis. The baseline characteristics of pCR and non-pCR groups were compared using Pearson χ2 test and independent sample t test. Wilcoxon test was used to evaluate changes in BPE levels before and after NAC. Mann–Whitney U test was used to identify differences in BPE levels between premenopausal and postmenopausal groups and between pCR and non-pCR groups. Spearman rank correlation test was used to describe the correlation between changes in BPE levels and pCR, changes in BPE levels and tumor size, and tumor size reduction and pCR. All statistical tests were 2-sided, and P < .05 was considered statistically significant.
2.6. Interreader agreement
Κ-coefficient was used to evaluate the agreement between the 2 radiologists. The strength range of κ agreement was categorized as poor for < 0.00, slight for 0.00 to 0.20, fair for 0.21 to 0.40, moderate for 0.41 to 0.60, substantial for 0.61 to 0.81, and almost perfect for 0.81 to 1.00.[25]
3. Results
3.1. Patient characteristics
All the patients in the study were assigned to either the pCR group (n = 23) or the non-pCR group (n = 28). The largest tumor diameter observed in the pCR group was lower than that in the non-pCR group (t = −2.856, P = .006). Patients with HR-negative status were more likely to exhibit pCR than those with HR-positive status (χ2 = 7.399, P = .007). The remaining baseline characteristics of the 2 groups were not statistically significant (P > .05) (Table 1).
3.2. BPE levels in premenopausal and postmenopausal groups
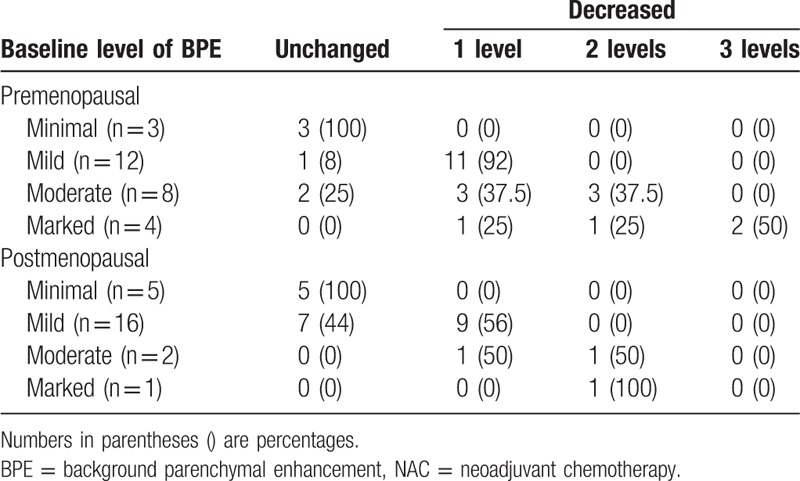
Premenopausal (n = 27) patients had higher baseline BPE levels (Z = −2.279, P = .023) than postmenopausal women (n = 24). The post-NAC BPE level decreased in 81.48% (21 out of 27) of premenopausal patients (Z = −4.289, P < .001) and in 50% (12 out of 24) of postmenopausal patients (Z = −3.276, P = .001). The post-NAC BPE levels of premenopausal patients significantly decreased relative to those of postmenopausal patients (Z = −2.207, P = .027) (Table 2).
Table 2.
Changes in BPE for premenopausal and postmenopausal status after NAC.
3.3. BPE levels in pCR and non-pCR groups
Twenty-three patients achieved pCR, and 28 patients achieved non-pCR. There was no significant difference in the baseline BPE of the pCR and non pCR groups (Z = −0.136, P = .892). The post-NAC BPE levels decreased in 86.96% (20 out of 23) of the patients in the pCR group (Z = −4.347, P < .001) and in 60.71% (17 out of 28) of the patients in the non-pCR group (Z = −3.900, P < .001). The BPE level did not increase in any patient after NAC. Additionally, the decrease in the BPE level was more dramatic in the pCR group than in the non-pCR group (Fig. 2) (Z = −2.013, P = .044) (Table 3).
Figure 2.
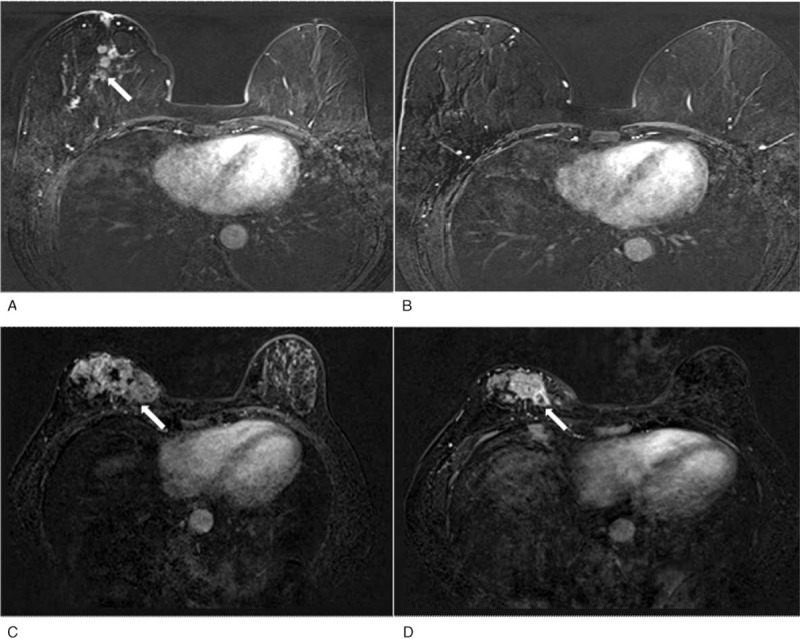
A 59-year-old woman with pCR after NAC. Before NAC, a 3.5 cm IDC in the right breast was noted (arrow). Subtraction image with minimal BPE before (A) and after (B) NAC. The mass completed MRI response to NAC. A 40-year-old patient with non-pCR after NAC, a 7.7 cm IDC in the right breast and 6.5 cm after NAC was noted (arrow). Subtraction image with mild BPE before (C) and minimal BPE after (D) NAC. IDC = invasive ductal cancer, NAC = neoadjuvant chemotherapy, pCR = pathologic complete response.
Table 3.
Changes in BPE levels before and after NAC in pCR and non-pCR groups.
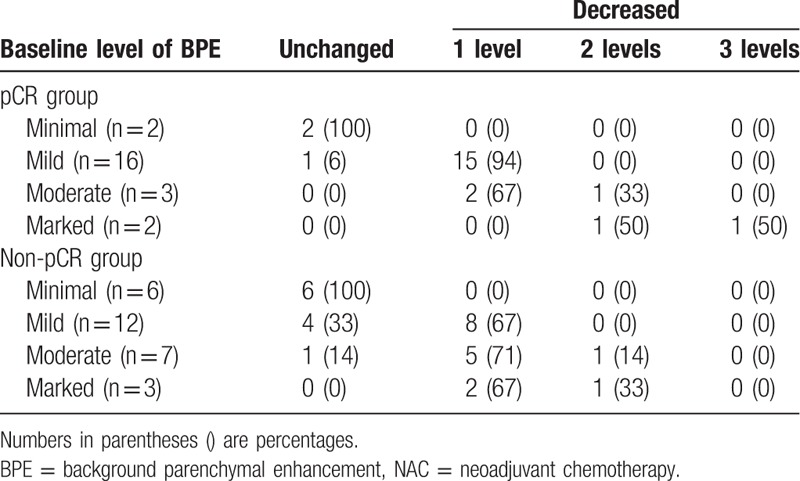
3.4. Correlation analysis
Baseline BPE levels and pCR were not significantly correlated (r = 0.019, P = .894). However, post-NAC BPE levels and pCR were significantly correlated (r = 0.322, P = .021). Specifically, the post-NAC decrease in the BPE level was correlated with pCR (r = −0.285, P = .043).
Baseline BPE levels and tumor size were not significantly correlated (r = 0.066, P = .644) but were significantly correlated after NAC (r = 0.389, P = .005). The decrease in the BPE level and the reduction in tumor size after NAC were significantly correlated (r = 0.333, P = .017). Tumor size reduction and pCR were also significantly correlated (r = 0.692, P < .001).
3.5. Interreader agreement
A substantial interreader agreement regarding BPE level was observed (κ = 0.773 at baseline; κ = 0.706 after NAC).
4. Discussion
We demonstrated that the decrease in the BPE levels after NAC is significantly related to pCR in 51 patients with HER2-positive breast cancer. Studies using qualitative analysis have demonstrated that the degree of change in BPE after NAC may predict tumor response.[17] Thus, the change in BPE could influence treatment protocols, adjusting NAC regimens, and surgical approach. However, whether the changes in BPE before and after NAC can be used to predict pCR in HER2-positive breast cancer remains unclear.
BPE does not decrease the cancer detection rate, but moderate and marked BPE levels are associated with inaccurate MRI-based estimation of tumor size.[26] Therefore, we evaluated BPE levels in the contralateral breasts of patients with HER2-positive breast cancer. However, given that our study is a retrospective study, we could not determine the menstrual cycle stage of the patients at the time of MRI and menstruation may affect the higher decrease in the premenopausal group. Although we were unable to analyze the effects of the menstrual cycle on BPE level, we considered the effect of menopausal status. The low baseline BPE levels in the postmenopausal group may be attributed to the low estrogen levels of the women. After NAC, the BPE levels of premenopausal and postmenopausal women decreased, and the decrease was more drastic in premenopausal women than in postmenopausal women. These results may be attributed to decreased hormone levels due to ovarian suppression induced by NAC.[27]
In a previous study, decreased BPE in breast MRI was correlated with pCR to NAC in patients with breast cancer, but no significant difference in post-NAC BPE and change in BPE were observed with molecular subtypes.[28] The present study focused on HER2-positive breast cancer and analyzed the relationship between pCR and baseline and post-NAC BPE levels. We did not find any correlation between baseline BPE level and pCR. The baseline BPE levels in the contralateral breasts of patients with pCR are not significantly higher than those in the non-pCR groups.[29] After NAC, however, the BPE levels in the pCR group significantly decreased, and the decreased BPE level was associated with pCR. A pathological study found that after 24 hours of NAC, the apoptosis of tumor cells increases and the proliferation of cells decreases.[30] Studies using qualitative analysis demonstrated that the degree of change in BPE after NAC may be a predictor of tumor response; however, baseline pre-NAC BPE levels cannot predict tumor response.[27] Therefore, the decrease in the BPE level may be a predictor of pCR. The association between decreased post-NAC BPE levels and pCR may be attributed to the following mechanism: chemotherapy via perfusion delivery increases breast vascular perfusion, enabling high amounts of drugs to reach the tumor and normal breast parenchyma. The drugs kill tumor cells and cause normal vascular injury, thereby decreasing the BPE level. Decrease in HER2-positive tumor size was associated with decreased BPE and with pCR. Tumor size on MRI could be used to predict pathological tumor response during NAC.[18] The decrease in the BPE level could be used to predict tumor outcome with NAC.[17,29] Hence, the change in tumor size may reflect the change in BPE levels during NAC.
We found that women with HR-negative tumors of HER2-positive breast cancer are more likely to attain pCR than those with HR-positive tumors. A possible explanation for this result is that HR status may be an important mechanism that mediates chemoresistance in HER2-positive breast cancer.[31] Therefore, future research should focus on HR status.
Our present study has some limitations. First, we qualitatively analyzed BPE. This method is easily influenced by the subjectivity of the readers even if the 2 readers provide concurrent qualitative analytical results for BPE. Thus, in future studies, the conclusions should be validated through quantitative analyses. Second, this retrospective study involves a small population. Studies with a large number of patients are needed to further investigate the changes in BPE during NAC. Third, the MRI was not timed in the premenopausal patients, and this could influence the BPE categories determined.
In conclusion, the post-NAC decrement in the BPE levels in the contralateral breast of patients with HER2-positive breast cancer may be a predictor of pCR. In addition, patients with HR-negative tumors are more likely to attain pCR than those with HR-positive tumors. The association between the decrease in the BPE level after NAC and the survival outcome of patients with HER2-positive positive breast cancer requires future investigation.
Acknowledgments
The authors thank Hai Rong Liu of the Affiliated Hospital of Binzhou Medical University and Pei Yuan Wang and Li Li Jing of the Yan Tai Affiliated Hospital of Binzhou Medical University for their assistance.
Author contributions
Conceptualization: Jing-Min Dong, Bin Wang.
Data curation: Jing-Min Dong, Lin Zhang, Bin Wang.
Formal analysis: Jing-Min Dong, Lin Zhang.
Investigation: Hong-Xia Wang, Kun Xu, Yan Feng, Xia Wang, De-Jing Ma.
Methodology: Hong-Xia Wang, Xiao-Fei Zhong, Kun Xu, Jia Bian, Yan Feng.
Project administration: Xiao-Fei Zhong, Kun Xu, Jia Bian, Liang Chen.
Resources: Jia Bian, Liang Chen, De-Jing Ma.
Software: Jing-Min Dong, Xiao-Fei Zhong, Jia Bian, De-Jing Ma.
Supervision: Bin Wang.
Validation: Jing-Min Dong, Liang Chen.
Visualization: Jing-Min Dong.
Writing – original draft: Jing-Min Dong.
Footnotes
Abbreviations: BPE = background parenchymal enhancement, DCE-MRI = dynamic contrast-enhanced magnetic resonance imaging, ER = estrogen, FISH = fluorescence in situ hybridization, HER2 = human epidermal growth factor receptor 2, HR = hormone receptor, HRT = hormone replacement therapy, IDC = invasive ductal cancer, IHC = immunohistochemical, NAC = neoadjuvant chemotherapy, NME = nonmass enhancement, pCR = pathologic complete response, PR = progesterone.
J-MD and H-XW are equal contributors.
The authors have no conflicts of interest to disclose.
References
- [1].Demonty G, Bernard-Marty C, Puglisi F, et al. Progress and new standards of care in the management of HER-2 positive breast cancer. Eur J Cancer 2007;43:497–509. [DOI] [PubMed] [Google Scholar]
- [2].Kuroi K, Toi M, Ohno S, et al. Comparison of different definitions of pathologic complete response in operable breast cancer: a pooled analysis of three prospective neoadjuvant studies of JBCRG. Breast Cancer 2015;22:586–95. [DOI] [PMC free article] [PubMed] [Google Scholar]
- [3].Baron P, Beitsch P, Boselli D, et al. Impact of tumor size on probability of pathologic complete response after neoadjuvant chemotherapy. Ann Surg Oncol 2016;23:1522–9. [DOI] [PMC free article] [PubMed] [Google Scholar]
- [4].Schneeweiss A, Chia S, Hickish T, et al. Pertuzumab plus trastuzumab in combination with standard neoadjuvant anthracycline-containing and anthracycline-free chemotherapy regimens in patients with HER2-positive early breast cancer: a randomized phase II cardiac safety study (TRYPHAENA). Ann Oncol 2013;24:2278–84. [DOI] [PubMed] [Google Scholar]
- [5].Londero V, Bazzocchi M, Del Frate C, et al. Locally advanced breast cancer: comparison of mammography, sonography and MR imaging in evaluation of residual disease in women receiving neoadjuvant chemotherapy. Eur Radiol 2004;14:1371–9. [DOI] [PubMed] [Google Scholar]
- [6].Nagashima T, Sakakibara M, Nakamura R, et al. Dynamic enhanced MRI predicts chemosensitivity in breast cancer patients. Eur J Radiol 2006;60:270–4. [DOI] [PubMed] [Google Scholar]
- [7].Morris E, Comstock C, Lee C, et al. ACR BI-RADS® magnetic resonance imaging. ACR BI-RADS® atlas, breast imaging reporting and data system Reston, VA: American College of Radiology; 2013. [Google Scholar]
- [8].Sippo DA, Warden GI, Andriole KP, et al. Automated extraction of BI-RADS final assessment categories from radiology reports with natural language processing. J Digit Imaging 2013;26:989–94. [DOI] [PMC free article] [PubMed] [Google Scholar]
- [9].Delille J-P, Slanetz PJ, Yeh ED, et al. Hormone replacement therapy in postmenopausal women: breast tissue perfusion determined with MR imaging—initial observations. Radiology 2005;235:36–41. [DOI] [PubMed] [Google Scholar]
- [10].Muller-Schimpfle M, Ohmenhauser K, Stoll P, et al. Menstrual cycle and age: influence on parenchymal contrast medium enhancement in MR imaging of the breast. Radiology 1997;203:145–9. [DOI] [PubMed] [Google Scholar]
- [11].Price E, Brooks J, Watson E, et al. The impact of bilateral salpingo-oophorectomy on breast MRI background parenchymal enhancement and fibroglandular tissue. Eur Radiol 2014;24:162–8. [DOI] [PubMed] [Google Scholar]
- [12].Kim MY, Choi N, Yang JH, et al. Background parenchymal enhancement on breast MRI and mammographic breast density: correlation with tumour characteristics. Clin Radiol 2015;70:706–10. [DOI] [PubMed] [Google Scholar]
- [13].King V, Gu Y, Kaplan JB, et al. Impact of menopausal status on background parenchymal enhancement and fibroglandular tissue on breast MRI. Europ Radiol 2012;22:2641–7. [DOI] [PubMed] [Google Scholar]
- [14].King V, Kaplan J, Pike MC, et al. Impact of tamoxifen on amount of fibroglandular tissue, background parenchymal enhancement, and cysts on breast magnetic resonance imaging. Breast J 2012;18:527–34. [DOI] [PubMed] [Google Scholar]
- [15].Dave RV, Millican-Slater R, Dodwell D, et al. Neoadjuvant chemotherapy with MRI monitoring for breast cancer. Br J Surg 2017;104:1177–87. [DOI] [PubMed] [Google Scholar]
- [16].Choi JS, Ko ES, Ko EY, et al. Background parenchymal enhancement on preoperative magnetic resonance imaging: association with recurrence-free survival in breast cancer patients treated with neoadjuvant chemotherapy. Medicine (Baltimore) 2016;95:e3000. [DOI] [PMC free article] [PubMed] [Google Scholar]
- [17].Preibsch H, Wanner L, Bahrs S, et al. Background parenchymal enhancement in breast MRI before and after neoadjuvant chemotherapy: correlation with tumour response. Europ Radiol 2016;26:1590–6. [DOI] [PubMed] [Google Scholar]
- [18].You C, Gu Y, Peng W, et al. Decreased background parenchymal enhancement of the contralateral breast after two cycles of neoadjuvant chemotherapy is associated with tumor response in HER2-positive breast cancer. Acta Radiol 2018;59:806–12. [DOI] [PubMed] [Google Scholar]
- [19].Cheung Y-C, Chen S-C, Su M-Y, et al. Monitoring the size and response of locally advanced breast cancers to neoadjuvant chemotherapy (weekly paclitaxel and epirubicin) with serial enhanced MRI. Breast Can Res Treat 2003;78:51–8. [DOI] [PubMed] [Google Scholar]
- [20].Hylton NM, Blume JD, Bernreuter WK, et al. Locally advanced breast cancer: MR imaging for prediction of response to neoadjuvant chemotherapy—results from ACRIN 6657/I-SPY TRIAL. Radiology 2012;263:663–72. [DOI] [PMC free article] [PubMed] [Google Scholar]
- [21].Perez EA, Romond EH, Suman VJ, et al. Trastuzumab plus adjuvant chemotherapy for human epidermal growth factor receptor 2-positive breast cancer: planned joint analysis of overall survival from NSABP B-31 and NCCTG N9831. J Clin Oncol 2014;32:3744–52. [DOI] [PMC free article] [PubMed] [Google Scholar]
- [22].van Ramshorst MS, Loo CE, Groen EJ, et al. MRI predicts pathologic complete response in HER2-positive breast cancer after neoadjuvant chemotherapy. Breast Cancer Res Treat 2017;164:99–106. [DOI] [PubMed] [Google Scholar]
- [23].Cortazar P, Zhang L, Untch M, et al. Pathological complete response and long-term clinical benefit in breast cancer: the CTNeoBC pooled analysis. Lancet 2014;384:164–72. [DOI] [PubMed] [Google Scholar]
- [24].Wolff AC, Hammond MEH, Schwartz JN, et al. American Society of Clinical Oncology/College of American Pathologists guideline recommendations for human epidermal growth factor receptor 2 testing in breast cancer. J Clin Oncol 2006;25:118–45. [DOI] [PubMed] [Google Scholar]
- [25].Chakrabarti S, Mandal P, Chowdhury AR, et al. Consequence of neo-adjuvant chemotherapy on morphology of breast carcinoma: a systematic evaluation. Ind J Cancer 2016;53:29. [DOI] [PubMed] [Google Scholar]
- [26].Archer C, Parton M, Smith I, et al. Early changes in apoptosis and proliferation following primary chemotherapy for breast cancer. Brit J Can 2003;89:1035–41. [DOI] [PMC free article] [PubMed] [Google Scholar]
- [27].You C, Peng W, Zhi W, et al. Association between background parenchymal enhancement and pathologic complete remission throughout the neoadjuvant chemotherapy in breast cancer patients. Translat Oncol 2017;10:786–92. [DOI] [PMC free article] [PubMed] [Google Scholar]
- [28].Oh SJ, Chae EY, Cha JH, et al. Relationship between background parenchymal enhancement on breast MRI and pathological tumor response in breast cancer patients receiving neoadjuvant chemotherapy. Br J Radiol 2018;91:20170550. [DOI] [PMC free article] [PubMed] [Google Scholar]
- [29].Chen JH, Hon JY, Hsu C, et al. Background parenchymal enhancement of the contralateral normal breast: association with tumor response in breast cancer patients receiving neoadjuvant chemotherapy. Transl Oncol 2015;8:204–9. [DOI] [PMC free article] [PubMed] [Google Scholar]
- [30].Davis DW, Buchholz TA, Hess KR, et al. Automated quantification of apoptosis after neoadjuvant chemotherapy for breast cancer. Clin Can Res 2003;9:955–60. [PubMed] [Google Scholar]
- [31].Chen J-H, Yu H, Lin M, et al. Background parenchymal enhancement in the contralateral normal breast of patients undergoing neoadjuvant chemotherapy measured by DCE-MRI. Magn Reson Imag 2013;31:1465–71. [DOI] [PMC free article] [PubMed] [Google Scholar]


