Supplemental Digital Content is available in the text
Keywords: kidney cancer risk, meta-analysis, obesity
Abstract
Objective:
Obesity is considered as one of the risk factors of kidney cancer. However, the results are not consistent in reported original studies, as well as in published meta-analysis. This study aims to clarify the relationship between overweight/obesity and kidney cancer by an updated overall and dose-response meta-analysis.
Methods:
This meta-analysis was conducted in accordance with PRISMA guideline. Relevant studies were searched using PubMed, Embase, and Web of Science databases. The studies were limited to human cohort studies in English and Chinese language. Random-effect models and dose-response meta-analysis were used to synthesize the results. Subgroup analyses were also conducted based on the characteristics of participants.
Results:
Twenty-four cohort studies with 8,953,478 participants were included in our meta-analysis. Compared to the normal weight, the pooled RRs of kidney cancer was 1.35 (1.27–1.43) in overweight and 1.76 (1.61–1.91) in obese participants. An increased kidney cancer risk of 1.06 (1.05–1.06) for each 1 kg/m2 increase in BMI was showed in dose-response meta-analysis. No significant heterogeneity was found across studies with I2 = 39.4% for overweight, and I2 = 43.3% for obesity.
Conclusion:
The overall and dose-response meta-analysis suggested that overweight/obesity increases the risk of kidney cancer both in men and women.
1. Introduction
Kidney cancer is a common urinary system malignant tumor, which accounts for about 2–3% of adult malignant neoplasms.[1] In the last 20 years, the incidence of kidney cancer has notably increased with about 2% rise annually.[2] Epidemiological investigations have documented that the onsets of kidney cancer differentiate in regions and ethnicities, with the highest incidence in North America.[3–4] Referring to the data from the American Cancer Society, there were 63,990 new cases of kidney cancer in the United States in 2017.[5] Traditionally, 30% to 40% of kidney cancer patients died from the disease.[6]
Overweight/obesity has become the major public health problem that challenges both developed and developing countries.[7–9] It has been widely reported that overweight/obesity increases the risk of kidney cancer,[10,11] which is attributable to abnormal secretion of adipokines, insulin resistance, higher estrogen level among overweight/obesity individuals.[12–17]
Although the relationship between obesity and kidney cancer has been reported in previous systematic reviews and meta-analysis, the results are not consistent. Bergstrom et al[10] reported that obesity-related risks for kidney cancer are equal between men and women, while Wang et al[11] found a lower risk in men than women. Dose-response meta-analysis is a common method that synthesized the quantitative measurements of relationship between causes and outcomes. As 3 original cohort studies, with 409,487 participants, were published in recent years, an updated dose-response meta-analysis is needed to further clarify the quantitative relationship between overweight/obesity and kidney cancer. We therefore conducted this updated overall and dose-response meta-analysis.
2. Materials and methods
This meta-analysis was conducted according to the Preferred Reporting Items for Systematic Reviews and Meta-Analyses (PRISMA) guideline. Since this study is a meta-analysis of published studies, ethical approval is not necessary.
2.1. Search strategy
We systematically searched PubMed, Embase, and Web of Science databases for articles published up to December 31, 2017. Our core search consisted of terms related to “kidney cancer, kidney neoplasm, kidney carcinoma” combined with “BMI, overweight, obesity, or body weight” to identify relevant studies. The studies were limited to human cohort studies in English and Chinese language. As conducting an updated systematic review, we reviewed the published meta-analysis by Wang et al[11] to further identify eligible relevant studies. We also manually scanned the references listed in the retrieved articles.
2.2. Study selection
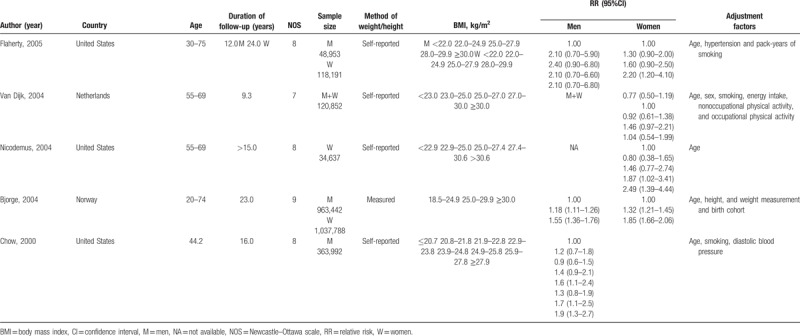
Studies satisfied the following criteria were included in our meta-analysis: cohort study design; kidney cancer as outcome; overweight and obesity defined by BMI; relative risk (RR) and 95% confidence intervals (CIs) available or can be calculated based on published data; the dose-response analysis was performed on 3 or more classifications of BMI levels. When more than one study reported the same or duplicated data, only the most recent publication or study with the completed database was included. We assessed the methodological quality of original studies using Newcastle-Ottawa Scale, in which the star system ranges from 0 to 9.[18] Studies awarded 7 or more stars were considered eligible and were included in our meta-analysis.[19] The detailed information of quality assessment was provided in Table 1 .
Table 1.
Characteristics of included studies.
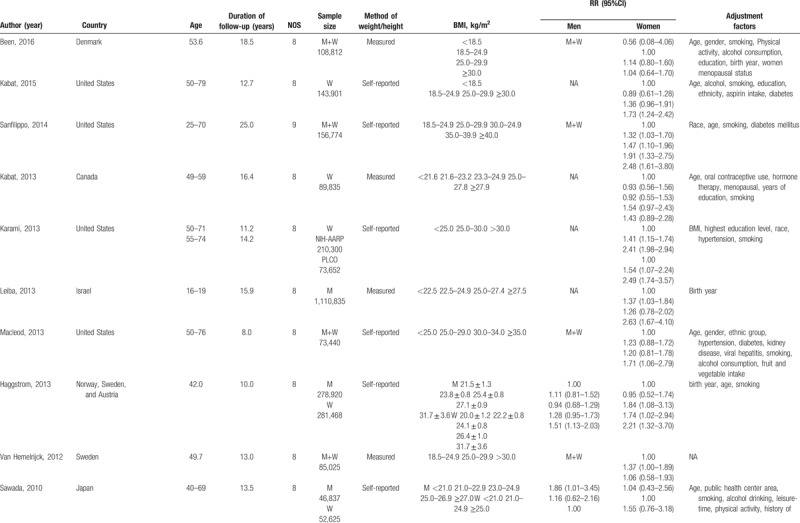
Table 1 (Continued).
Characteristics of included studies.
2.3. Data extraction
Data were extracted independently by 2 investigators and any disagreements were resolved through consensus from the third author. The following variables were obtained from each of the eligible publications: first author's name, publication year, age of participants, study sample size, number of cases, duration of follow-up, location where the study was performed, measurement of BMI (self-reported or measured by investigator), BMI category and the corresponding risk estimate, and confounding factors adjusted for multivariable analysis. We reported all results as RR for convenience under the premise that both the rate ratio and the risk ratio can be used as effective estimates of relative risks. To reduce the impact of confounders, we used the RRs that adjusted covariates in multivariable model.
The midpoint of the upper and lower limits of each category of BMI was defined as the average BMI level to each corresponding RR. If there was no upper limit or the lower limit, we just assumed that the limit and adjacent category had the same amplitude. For studies that provided only total number of cases and person years, we used the method of Aune et al[20] to estimate the stratified number of cases and person years in each group.
2.4. Statistical analysis
We used the WHO category to compare risk estimates for abnormal weight with normal weight, and the BMI in adults was classified by WHO[21] as follows: underweight (<18.50); normal weight (18.50–24.90); overweight (25.0–29.90); obesity (≥30.00). In case there was no standard classifications of BMI were used, we applied the most similarity to WHO's taxonomy. We performed a logarithmic transformation of the relative risks and the corresponding standard errors which were extracted in the studies to stabilize the variances and normalize the distributions. We used a random-effect model to analyze and report the results.[22] Taking into account the heterogeneity between studies, we performed a 2-stage random-effect dose-response meta-analysis to calculate the trend based on relevant logRR estimated across BMI levels.[23] In the first stage, a generalized least squares regression was used to estimate the restricted cubic spline model distributed at the 10%, 50%, and 90% percentiles taking into account the correlation within each set of published RRs. Then, we used the GLST command to carry out the dose-response meta-analysis, which required cases, person-years and dose converted from BMI, as well as BMI level-specific RRs with variance estimated for at least 3 quantitative classifications of each article.[24] We calculated the nonlinear P-value by testing the null hypothesis that the second spline coefficient is equal to zero.[25]
We used the I2 statistic and Q-test to assess heterogeneity across studies,[26] and the no, low, moderate and high heterogeneity corresponded to the cut-points of 0%, 25%, 50% and 75%, respectively. To further investigate whether the relationship between BMI and kidney cancer was biased by study-specific factors (e.g., sex, study location, assessment method of BMI, duration of follow-up, age, smoking, alcohol), we conducted the subgroup analysis based on these factors. Additionally, a sensitivity analysis was performed to estimate the stability of our meta- analysis, in which one study was removed at a time and the rest studies were pooled. Publication bias was evaluated by the funnel plots and Egger's regression test,[27] and the trim-fill analysis was also applied. Statistical analyses were performed by Stata 12.0 (Stata Corporation, College Station, TX). A P value < .05 was considered statistically significant.
3. Results
3.1. Literature search and study characteristics
Our meta-analysis included 24 cohort studies,[28–51] which involved 15,535cases and 8,953,478 participants (Fig. 1). The follow-up period ranged from 5.4 to 25 years. Besides the 20 original studies ever enrolled by Wang et al, our literature search identified 4 more studies with 773,479 participants,[28–30,51] in which 3 studies[28–30] were published later than Wang's meta-analysis. An original study[52] that reported the mortality of renal cell carcinoma was excluded due to discrepant outcome of the disease with our study design. Among the included studies, 11[29–32,34,38,40,42,47,49,51] were conducted in the North America, 4[33,37,39,46] in Asia, and nine[28,35,36,41,43–45,48,50] in Europe. Four studies[33,45,46,51] and 6 studies[29,31,32,39,42,49] only reported separated outcomes in men and women while 14 studies[28,30,34,35–38,40,41,43,44,47,48,50] reported outcomes of both sex. Of the 14 studies, eight[35,37,38,40,43,44,47,50] reported outcomes in men and women separately, and six[28,30,34,36,41,48] offered data of both sex combined. Nine (37.50%) studies controlled alcohol-use habit and 20 (83.33%) adjusted for smoking. The main features of the included studies were shown in Table 1 .
Figure 1.
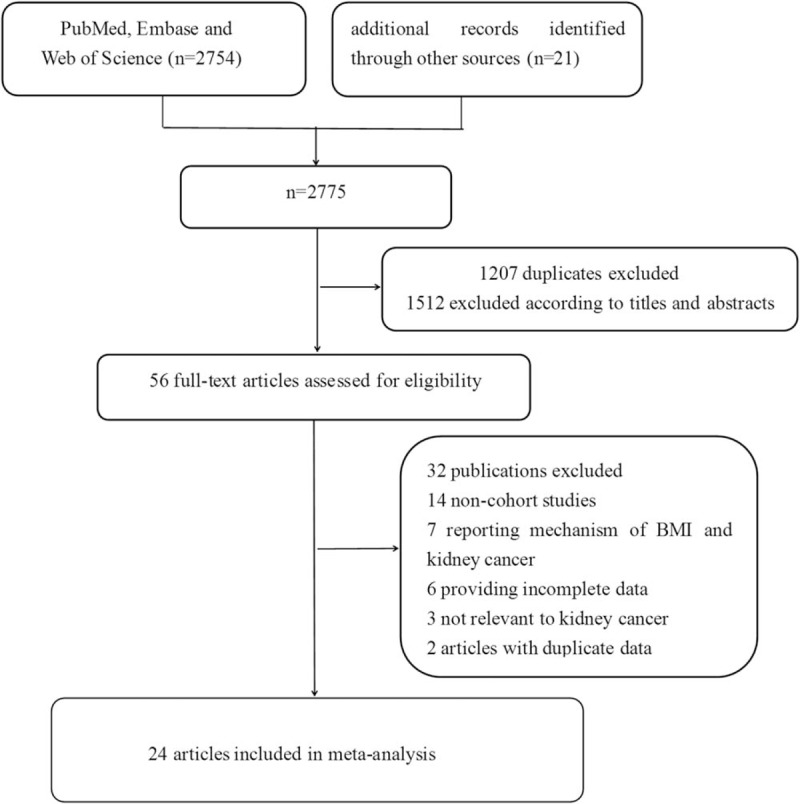
Flowchart of the selection of studies for inclusion in this meta-analysis.
3.2. Abnormal BMI and risk of kidney cancer
Compared to the normal weight, the pooled RRs of kidney cancer was 1.35 (1.27–1.43) in overweight and 1.76 (1.61–1.91) in obese participants (see Figs. 2 and 3). No significant heterogeneity was found across studies (overweight: I2 = 39.4%; obesity: I2 = 43.3%).
Figure 2.
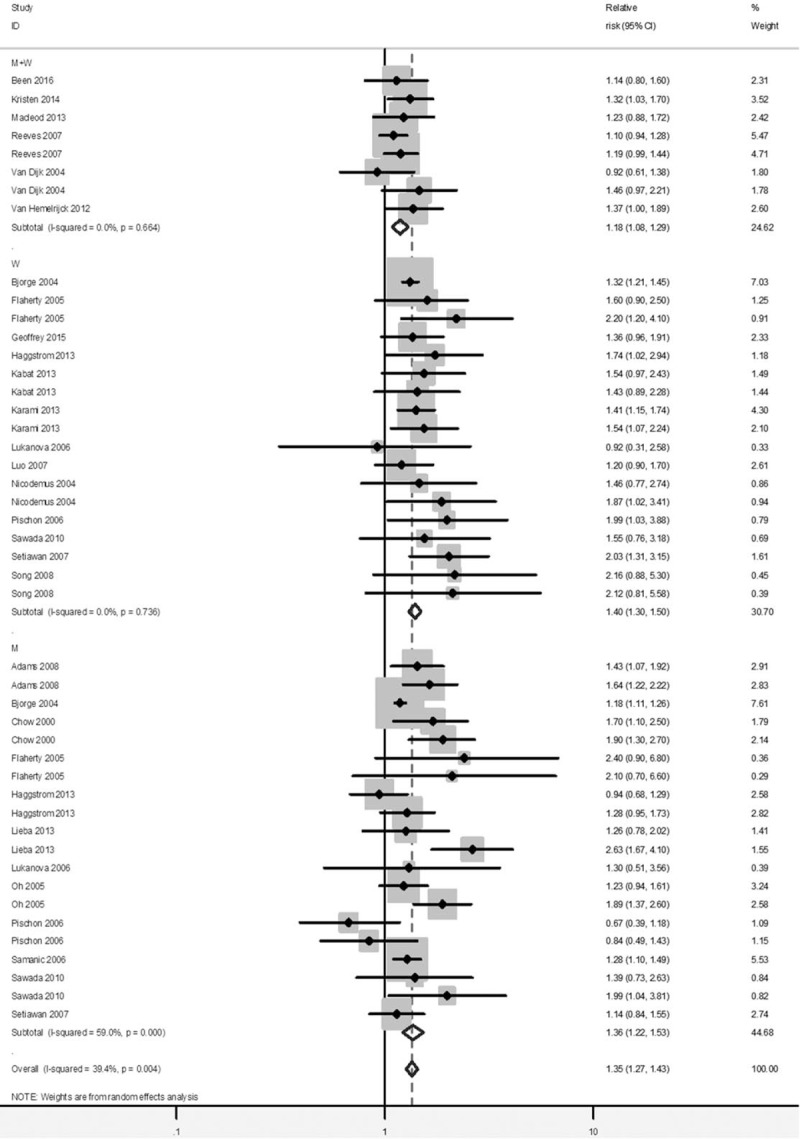
Forest plot of RRs of overweight versus Normal weight for BMI with kidney cancer risk. BMI = body mass index, CI = confidence interval, RR = relative risk.
Figure 3.
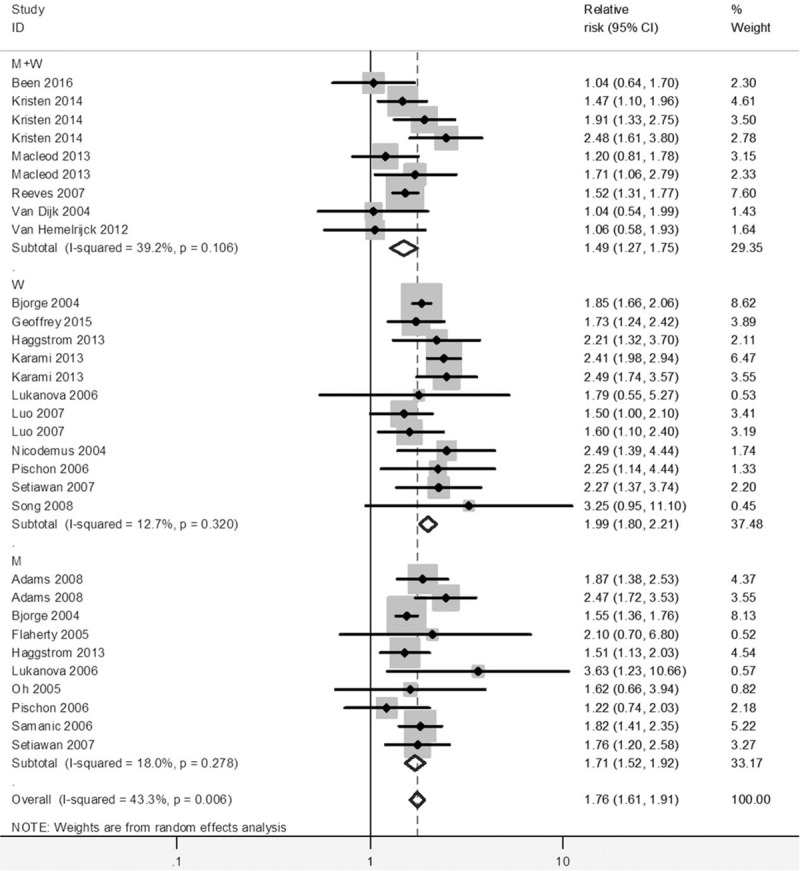
Forest plot of RRs of obesity versus normal weight for BMI with kidney cancer risk. BMI = body mass index, CI = confidence interval, RR = relative risk.
3.3. Subgroup analysis
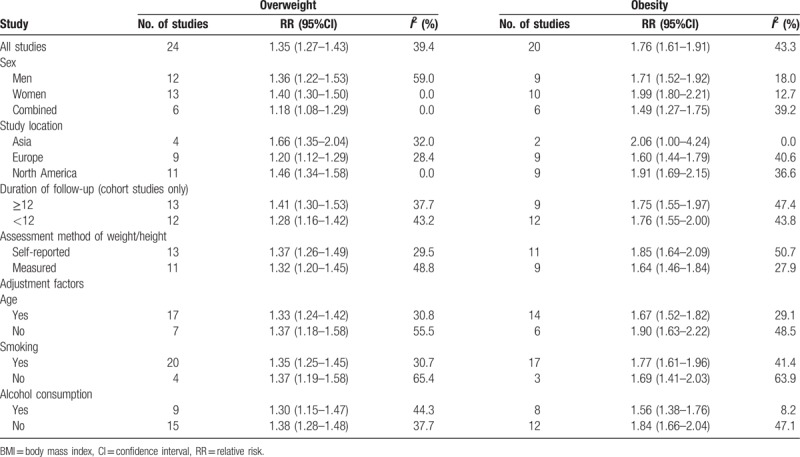
There was a basically consistent result between subgroup analysis and overall analysis for the category of overweight and obesity (Table 2). The RR of kidney cancer among obese women was 1.99 (95% CI = 1.80–2.21) compared to women with normal BMI, and the RR among obese men was 1.71 (95% CI = 1.52–1.92) compared to men with normal BMI. Meanwhile, the risk of kidney cancer was also significant among overweight women compare to women with normal BMI, with RR of 1.40 (95% CI = 1.30–1.50), and the risk of kidney cancer among overweight men was significant with the RR of 1.36 (95% CI = 1.22–1.53) compare to those with normal BMI. No significant effect differences were observed for gender, for duration of follow-up and for other adjustment factors (e.g. age, smoking, assessment method). It is noted that the pooled association of kidney cancer with obesity (RR = 1.84, 95% CI = 1.66–2.04) was significantly higher in studies not adjusting alcohol consumption, than that in studies adjusting alcohol consumption (RR = 1.56, 95% CI = 1.38–1.76).
Table 1 (Continued).
Characteristics of included studies.
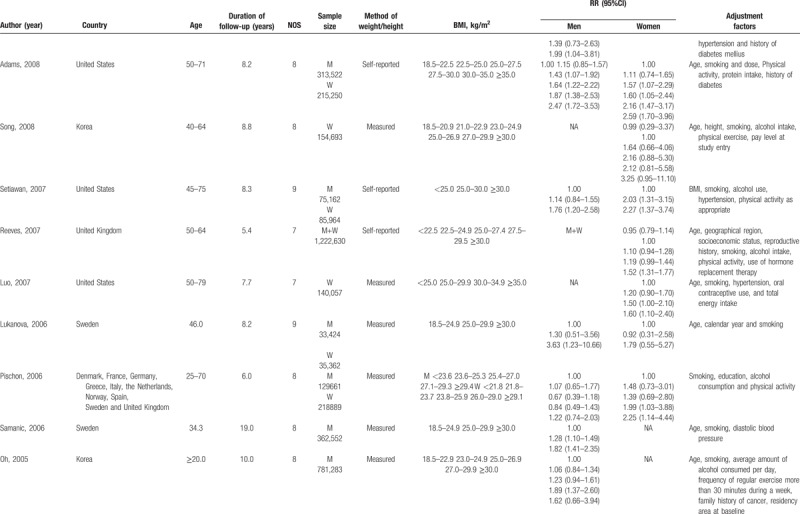
Table 2.
Subgroup analyses of BMI and kidney cancer risk.
3.4. Dose-response meta-analysis
A total of 24 studies[28–51] were included in the dose-response meta-analysis. It was found that there was a linear relationship between BMI and risk of kidney cancer (P < .001). An increased kidney cancer risk of 1.06 (1.05–1.06) for each 1 kg/m2 increase in BMI was showed in this meta-analysis as shown in Figure 4. The risk of kidney cancer for men and women increased by 5% (RR = 1.05, 95%CI: 1.04–1.06) and 6% (RR = 1.06, 95%CI: 1.05–1.08), respectively, per 1 kg/m2 increase (Fig. 5).
Figure 4.
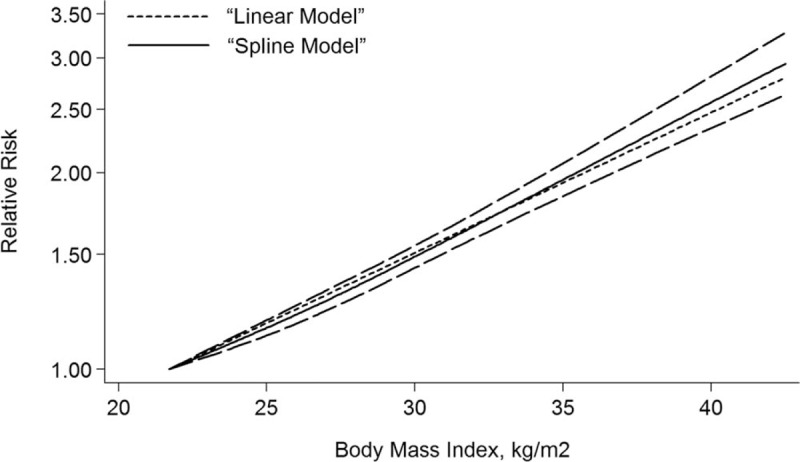
The dose-response analysis between BMI and kidney cancer risk in cohort studies with restricted cubic splines in a multivariate random-effects dose-response model. The solid line and the long dash line represent the estimated RR and its 95% CI. Short dash line represents the linear relationship (per 1 kg/m2 increment). BMI = body mass index, CI = confidence interval, RR = relative risk.
Figure 5.

The dose-response analysis between BMI and kidney cancer risk by adjustment of sex, smoking and alcohol consumption. (A) Men; (B) women; (C) adjustment of smoking; (D) nonadjustment of smoking; (E) adjustment of alcohol consumption; (F) nonadjustment of alcohol consumption. The solid line and the long dash represented RR and it's 95% CI. Short dash line represents the linear relationship (per 1 kg/m2 increment). BMI = body mass index, CI = confidence interval, RR = relative risk.
As shown in Figure 5, When adjusted the possibly influencing factors (e.g., sex, smoking and alcohol consumption), the evidence of significant nonlinear relationship was observed in men (P = .028) and in studies which not adjusted for smoking (P = .015). Compared to BMI = 22.35 kg/m2, the summary RRs (95%CIs) of kidney cancer among men were 1.10 (1.07–1.14), 1.35 (1.28–1.42), 1.72 (1.60–1.85), 2.26 (2.02–2.53) for BMI = 25, 30, 35 and 40 kg/m2, respectively. At the points of BMI = 25, 30, 35 kg/m2, the corresponding RRs (95%CIs) were 1.07 (1.04–1.11), 1.36 (1.29–1.43) and 1.70 (1.57–1.85) for studies not adjusted for smoking.
3.5. Publication bias
The Egger's regression test showed that there was no publication bias in the literature on BMI and kidney cancer risk in obesity group (P = .671) and dose-response group (P = .265). For the document on BMI and kidney cancer risk in the overweight group, the Egger's test showed the probability of publication bias (P = .031) (Fig. 6). In view of this, we undertook the trim and fill analysis and the result was unchanged, indicating that the effect of publication bias could be omitted.
Figure 6.

Funnel plot corresponding to the randon-effects meta-analysis of the relationship between (A) overweight and kidney cancer risk (P = .031, by Egger's test); (B) obesity and kidney cancer risk (P = .671, by Egger’ test); (C) funnel plot corresponding to the dose-response meta-analysis of the relationship between BMI and kidney cancer risk (P = .265, by Egger's test). BMI = body mass index.
3.6. Sensitivity analysis
In a sensitivity analysis in which one study at a time was removed and the rest analyzed, the pooled RRs ranged from 1.31 to 1.36 for overweight, from 1.67 to 1.77 for obesity and from 1.37 to 1.40 for dose-response analysis, which demonstrated that the pooled estimates were steady.
4. Discussion
In our meta-analysis, we discovered an increase of 35% risk of kidney cancer in overweight participants and an increase of 76% risk in obese participants compared with the normal participants. When the analysis was stratified by gender, it was observed that the significant association between higher BMI levels and increased risk of kidney cancer existed both in men and women, and the gender differences were not statistically significant. Dose-response meta-analysis identified a linear dose-response relationship between BMI and the risk of kidney cancer (P < .001), and an increased risk of 6% (RR = 1.06, 95% CI = 1.05–1.06) was aroused per 1 kg/m2 increase of BMI. The pooled RR of kidney cancer among men and women increased by 5% (RR = 1.05, 95%CI: 1.04–1.06) and 6% (RR = 1.06, 95%CI: 1.05–1.08) for each unit increase of BMI respectively. A statistically nonlinear relationship between BMI and kidney cancer risk was also observed in men.
A previous meta-analysis by Wang et al[11] reported the summary of overweight and obese individuals in men and women, respectively. Although they included 21 cohort studies, one original study with a large number of participants was included in their meta-analysis that reported the mortality of renal cancer. Furthermore, it showed that the association between BMI and kidney cancer risk was much stronger in women, which was not completely consistent with the results of our study. In Bergström et al[10] study, a positive association between BMI and increased kidney cancer risk was reported and they found that the pooled risk was equally among men and women. Nevertheless, most of the studies they included were case-control studies and cohort studies only accounted for a small number. Our results, based on 24 cohort studies, and were generally consistent with the results of previous meta-analysis.[10] Moreover, the statistically nonlinear dose-response association about BMI increase and kidney cancer risk was found among men, and was also established for studies, in which smoking was not adjusted. In addition, we conducted subgroup analyses based on possible confounding factors (e.g., sex, study location, assessment method of BMI, duration of follow-up, age, smoking, and alcohol consumption). The results showed that alcohol consumption might be a risk factor for kidney cancer, consistent with the results reported in the Hu et al[52] study that drinking can increase the risk of kidney cancer.
Obesity might be associated with increased risk of kidney cancer through several mechanisms. Adipose tissue dysfunction caused by obesity can lead to abnormal secretion of adipokines (e.g., leptin, TNF-α, and IL-6), which contribute to the onset and development of kidney cancer.[12–13] Obesity is usually accompanied by insulin resistance, which increases insulin-like growth factor (IGF)-1.[14–15] High IGF-1 is reported to be a risk factor for tumorigenesis.[16] Additionally, obese individuals were known with higher estrogen levels, which promotes the carcinogenic effect of IGF, resulting in high risk of kidney cancer.[17] We found, in this meta-analysis of cohort studies, overweight/obesity is a risk factor in overall analysis, as well as dose-response analysis.
Advantages of our study were the inclusion of more comprehensive cohort studies, a large number of participants and cases, and the evaluation of the possibility of potential nonlinear relationships. In addition, our study excluded an original cohort study[52] included in the previous meta-analysis[11] because the original study reported the mortality of kidney cancer, which made our results more authentic and more in line with the study design. Although this meta-analysis included more cohort studies than previous studies, it also has several potential limitations. Firstly, overweight/obesity is closed to unhealthy diet, as we all know, which is also related to kidney cancer, but diet habit was only adjusted in very few included studies, which made the subgroup analysis more difficult to interpret. Meanwhile, some unknown confounding factors that may affect the risk of kidney cancer had not been adjusted in most original studies, which may make the real association between BMI levels and kidney cancer risk estimated. Secondly, it was reported that people with visceral obesity were more likely to have fatty liver than those without visceral obesity, and it was also found that the liver lipid accumulation was related to kidney cancer.[53] Unfortunately, our study only explored the relationship between BMI and kidney cancer risk due to the absence of information of visceral obesity in the original studies. Thirdly, it is impossible to completely exclude the potential publication bias because our meta-analysis only included the published studies. However, some studies with invalid results tend not to be published. Interestingly, the trim and fill analysis showed that publication bias could be negligible.
5. Conclusion
In conclusion, our overall and dose-response meta-analysis suggested that overweight/obesity is related to increased risk of kidney cancer both in men and women. The measures of weight control are necessary for people to prevent kidney cancer, especially for those who have family history of kidney cancer.
Author contributions
Conceptualization: Long Ji, Dong Li.
Data curation: Kai Zhu, Qian Wang, Huamin Liu, Qianqian Zhang.
Investigation: Kai Zhu, Qian Wang, Huamin Liu, Qianqian Zhang.
Methodology: Kai Zhu, Qian Wang, Huamin Liu, Qianqian Zhang.
Writing – original draft: Xuezhen Liu, Qi Sun, Haifeng Hou.
Writing review & editing: Xuezhen Liu, Qi Sun, Haifeng Hou.
Conceptualization: Long Ji, Dong Li.
Formal analysis: Kai Zhu, Qian Wang, Huamin Liu, Qianqian Zhang.
Methodology: Kai Zhu, Qian Wang, Huamin Liu, Qianqian Zhang.
Writing – original draft: Xuezhen Liu, Qi Sun, Haifeng Hou.
Writing – review & editing: Xuezhen Liu, Haifeng Hou.
Supplementary Material
Footnotes
Abbreviations: BMI = body mass index, CI = confidence interval, RR = relative risk, WHO = World Health Organization.
XL and QS contributed equally to this work.
Competing interests: The authors declare that they have no competing interests.
The authors have no funding and no conflicts of interest to disclose.
Supplemental Digital Content is available for this article.
Supplementary Files
References
- [1].Labochka D, Moszczuk B, Kukwa W, et al. Mechanisms through which diabetes mellitus influences renal cell carcinoma development and treatment: a review of the literature. Int J Mol Med 2016;38:1887–94. [DOI] [PubMed] [Google Scholar]
- [2].Ljungberg B, Bensalah K, Canfield S, et al. EAU guidelines on renal cell carcinoma: 2014 update. Eur Urol 2015;67:913–24. [DOI] [PubMed] [Google Scholar]
- [3].Chow WH, Dong LM, Devesa SS. Epidemiology and risk factors for kidney cancer. Nat Rev Urol 2010;7:245–57. [DOI] [PMC free article] [PubMed] [Google Scholar]
- [4].Ljungberg B, Campbell SC, Choi HY, et al. The epidemiology of renal cell carcinoma. Eur Urol 2011;60:615–21. [DOI] [PubMed] [Google Scholar]
- [5].Siegel RL, Miller KD, Jemal A. Cancer statistics, 2017. CA Cancer J Clin 2017;67:7–30. [DOI] [PubMed] [Google Scholar]
- [6].Campbell SC, Lane BR. Wein AJ, Kavoussi LR, Novick AC, Peters CA. Malignant renal tumors. Campbell-Wash Urology 10th ednPhiladelphia: WB Saunders, Inc; 2011. 1414–75. [Google Scholar]
- [7].Gundogan K, Bayram F, Gedik V, et al. Metabolic syndrome prevalence according to ATP III and IDF criteria and related factors in Turkish adults. Arch Med Sci 2013;9:243–53. [DOI] [PMC free article] [PubMed] [Google Scholar]
- [8].Januszek-Trzciąkowska A, Małecka-Tendera E, Klimek K, et al. Obesity risk factors in a representative group of Polish prepubertal children. Arch Med Sci 2014;10:880–5. [DOI] [PMC free article] [PubMed] [Google Scholar]
- [9].Kyriazis I, Rekleiti M, Saridi M, et al. Prevalence of obesity in children aged 6–12 years in Greece: nutritional behaviour and physical activity. Arch Med Sci 2012;8:859–64. [DOI] [PMC free article] [PubMed] [Google Scholar]
- [10].Bergström A, Hsieh CC, Lindblad P, et al. Obesity and renal cell cancer—a quantitative review. Br J Cancer 2001;85:984–90. [DOI] [PMC free article] [PubMed] [Google Scholar]
- [11].Wang F, Xu Y. Body mass index and risk of renal cell cancer: a dose-response meta-analysis of published cohort studies. Int J Cancer 2014;135:1673–86. [DOI] [PubMed] [Google Scholar]
- [12].Gati A, Kouidhi S, Marrakchi R, et al. Obesity and renal cancer: Role of adipokines in the tumor-immune system conflict. Oncoimmunology 2014;3:e27810. [DOI] [PMC free article] [PubMed] [Google Scholar]
- [13].Danhe Zhao. Research progress on the correlation between obesity related factors and cancer. Cancer Res Clin 2016;28:426–9. [Google Scholar]
- [14].Koskinen J, Magnussen CG, Sabin MA, et al. Youth overweight and metabolic disturbances in predicting carotid intima-media thickness, type 2 diabetes, and metabolic syndrome in adulthood: the Cardiovascular Risk in Young Finns study. Diabetes Care 2014;37:1870–7. [DOI] [PubMed] [Google Scholar]
- [15].Solarek W, Czarnecka AM, Escudier B, et al. Insulin and IGFs in renal cancer risk and progression. Endocr Relat Cancer 2015;22:R253–64. [DOI] [PubMed] [Google Scholar]
- [16].Zhang B, Deng X, Zhu P. Research progress on the correlation between obesity and renal cancer. J Mod Urol 2017;22:962–6. [Google Scholar]
- [17].Clarke RB, Howell A, Anderson E. Type I insulin-like growth factor receptor gene expression in normal human breast tissue treated with oestrogen and progesterone. Br J Cancer 1997;75:251–7. [DOI] [PMC free article] [PubMed] [Google Scholar]
- [18].Wu QJ, Yang Y, Vogtmann E, et al. Cruciferous vegetables intake and the risk of colorectal cancer: a meta-analysis of observational studies. Ann Oncol 2013;24:1079–87. [DOI] [PMC free article] [PubMed] [Google Scholar]
- [19].Li ZM, Wu ZX, Han B, et al. The association between BMI and gallbladder cancer risk: a meta-analysis. Oncotarget 2016;7:43669–79. [DOI] [PMC free article] [PubMed] [Google Scholar]
- [20].Aune D, Greenwood DC, Chan DS, et al. Body mass index, abdominal fatness and pancreatic cancer risk: a systematic review and non-linear dose-response meta-analysis of prospective studies. Ann Oncol 2012;23:843–52. [DOI] [PubMed] [Google Scholar]
- [21].Organization WH. Global database on body mass index. WHO. Available at: http://www.assessment psychology.com/icbmi.htm 2014. [Google Scholar]
- [22].DerSimonian R, Laird N. Meta-analysis in clinical trials. Control Clin Trials 1986;7:177–88. [DOI] [PubMed] [Google Scholar]
- [23].Orsini N, Li R, Wolk A, et al. Meta-analysis for linear and nonlinear dose-response relations: examples, an evaluation of approximations, and software. Am J Epidemiol 2012;175:66–73. [DOI] [PMC free article] [PubMed] [Google Scholar]
- [24].Orsini N, ellocco R, Greenland S. Generalized least squares for trend estimation of summarized dose-response data. Stata J 2006;6:40–7. [Google Scholar]
- [25].Desquilbet L, Mariotti F. Dose-response analyses using restricted cubic spline functions in public health research. Stat Med 2010;29:1037–57. [DOI] [PubMed] [Google Scholar]
- [26].Higgins JP, Thompson SG. Quantifying heterogeneity in a meta-analysis. Stat Med 2002;21:1539–58. [DOI] [PubMed] [Google Scholar]
- [27].Egger M, Davey Smith G, Schneider M, et al. Bias in meta-analysis detected by a simple, graphical test. BMJ 1997;315:629–34. [DOI] [PMC free article] [PubMed] [Google Scholar]
- [28].Benn M, Tybjærg-Hansen A, Smith GD, et al. High body mass index and cancer risk—a Mendelian randomisation study. Eur J Epidemiol 2016;31:879–92. [DOI] [PubMed] [Google Scholar]
- [29].Kabat GC, Xue X, Kamensky V, et al. Risk of breast, endometrial, colorectal, and renal cancers in postmenopausal women in association with a body shape index and other anthropometric measures. Cancer Causes Control 2015;26:219–29. [DOI] [PubMed] [Google Scholar]
- [30].Sanfilippo KM, McTigue KM, Fidler CJ, et al. Hypertension and obesity and the risk of kidney cancer in 2 large cohorts of US men and women. Hypertension 2014;63:934–41. [DOI] [PMC free article] [PubMed] [Google Scholar]
- [31].Kabat GC, Heo M, Miller AB, et al. Scaling of weight for height in relation to risk of cancer at different sites in a cohort of Canadian women. Am J Epidemiol 2013;177:93–101. [DOI] [PubMed] [Google Scholar]
- [32].Karami S, Daugherty SE, Schonfeld SJ, et al. Reproductive factors and kidney cancer risk in 2 US cohort studies, 1993–2010. Am J Epidemiol 2013;177:1368–77. [DOI] [PMC free article] [PubMed] [Google Scholar]
- [33].Leiba A, Kark JD, Afek A, et al. Adolescent obesity and paternal country of origin predict renal cell carcinoma: a cohort study of 1.1 million 16 to 19-year-old males. J Urol 2013;189:25–9. [DOI] [PubMed] [Google Scholar]
- [34].Macleod LC, Hotaling JM, Wright JL, et al. Risk factors for renal cell carcinoma in the VITAL study. J Urol 2013;190:1657–61. [DOI] [PMC free article] [PubMed] [Google Scholar]
- [35].Häggström C, Rapp K, Stocks T, et al. Metabolic factors associated with risk of renal cell carcinoma. PLoS One 2013;8:e57475. [DOI] [PMC free article] [PubMed] [Google Scholar]
- [36].Van Hemelrijck M, Garmo H, Hammar N, et al. The interplay between lipid profiles, glucose, BMI and risk of kidney cancer in the Swedish AMORIS study. Int J Cancer 2012;130:2118–28. [DOI] [PubMed] [Google Scholar]
- [37].Sawada N, Inoue M, Sasazuki S, et al. JPHC Study Group Body mass index and subsequent risk of kidney cancer: a prospective cohort study in Japan. Ann Epidemiol 2010;20:466–72. [DOI] [PubMed] [Google Scholar]
- [38].Adams KF, Leitzmann MF, Albanes D, et al. Body size and renal cell cancer incidence in a large US cohort study. Am J Epidemiol 2008;168:268–77. [DOI] [PMC free article] [PubMed] [Google Scholar]
- [39].Song YM, Sung J, Ha M. Obesity and risk of cancer in postmenopausal Korean women. J Clin Oncol 2008;26:3395–402. [DOI] [PubMed] [Google Scholar]
- [40].Setiawan VW, Stram DO, Nomura AM, et al. Risk factors for renal cell cancer: the multiethnic cohort. Am J Epidemiol 2007;166:932–40. [DOI] [PubMed] [Google Scholar]
- [41].Reeves GK, Pirie K, Beral V, et al. Million Women Study Collaboration Cancer incidence and mortality in relation to body mass index in the Million Women Study: cohort study. BMJ 2007;335:1134. [DOI] [PMC free article] [PubMed] [Google Scholar]
- [42].Luo J, Margolis KL, Adami HO, et al. Women's Health Initiative Investigators Body size, weight cycling, and risk of renal cell carcinoma among postmenopausal women: the Women's Health Initiative (United States). Am J Epidemiol 2007;166:752–9. [DOI] [PubMed] [Google Scholar]
- [43].Lukanova A, Björ O, Kaaks R, et al. Body mass index and cancer: results from the Northern Sweden Health and Disease Cohort. Int J Cancer 2006;118:458–66. [DOI] [PubMed] [Google Scholar]
- [44].Pischon T, Lahmann PH, Boeing H, et al. Body size and risk of renal cell carcinoma in the European Prospective Investigation into Cancer and Nutrition (EPIC). Int J Cancer 2006;118:728–38. [DOI] [PubMed] [Google Scholar]
- [45].Samanic C, Chow WH, Gridley G, et al. Relation of body mass index to cancer risk in 362,552 Swedish men. Cancer Causes Control 2006;17:901–9. [DOI] [PubMed] [Google Scholar]
- [46].Oh SW, Yoon YS, Shin SA. Effects of excess weight on cancer incidences depending on cancer sites and histologic findings among men: Korea National Health Insurance Corporation Study. J Clin Oncol 2005;23:4742–54. [DOI] [PubMed] [Google Scholar]
- [47].Flaherty KT, Fuchs CS, Colditz GA, et al. A prospective study of body mass index, hypertension, and smoking and the risk of renal cell carcinoma (United States). Cancer Causes Control 2005;16:1099–106. [DOI] [PubMed] [Google Scholar]
- [48].van Dijk BA, Schouten LJ, Kiemeney LA, et al. Relation of height, body mass, energy intake, and physical activity to risk of renal cell carcinoma: results from the Netherlands Cohort Study. Am J Epidemiol 2004;160:1159–67. [DOI] [PubMed] [Google Scholar]
- [49].Nicodemus KK, Sweeney C, Folsom AR. Evaluation of dietary, medical and lifestyle risk factors for incident kidney cancer in postmenopausal women. Int J Cancer 2004;108:115–21. [DOI] [PubMed] [Google Scholar]
- [50].Bjørge T, Tretli S, Engeland A. Relation of height and body mass index to renal cell carcinoma in two million Norwegian men and women. Am J Epidemiol 2004;160:1168–76. [DOI] [PubMed] [Google Scholar]
- [51].Chow WH, Gridley G, Fraumeni JF, Jr, et al. Obesity, hypertension, and the risk of kidney cancer in men. N Engl J Med 2000;343:1305–11. [DOI] [PubMed] [Google Scholar]
- [52].Hu J, Chen Y, Mao Y, et al. Canadian Cancer Registries Epidemiology Research Group Alcohol drinking and renal cell carcinoma in Canadian men and women. Cancer Detect Prev 2008;32:7–14. [DOI] [PubMed] [Google Scholar]
- [53].Watanabe D, Horiguchi A, Tasaki S, et al. Clinical implication of ectopic liver lipid accumulation in renal cell carcinoma patients without visceral obesity. Sci Rep 2017;7:12795. [DOI] [PMC free article] [PubMed] [Google Scholar]
Associated Data
This section collects any data citations, data availability statements, or supplementary materials included in this article.


