Abstract
Small renal masses are increasingly detected incidentally at imaging. They vary widely in histology and aggressiveness, and include benign renal tumors and renal cell carcinomas that can be either indolent or aggressive. Imaging plays a key role in the characterization of these small renal masses. While a confident diagnosis can be made in many cases, some renal masses are indeterminate at imaging and can present as diagnostic dilemmas for both the radiologists and the referring clinicians. This article will summarize the current evidence of imaging features that correlate with the biology of small solid renal masses, and discuss key approaches in imaging characterization of these masses using CT and MRI.
Introduction
Renal tumors are incidentally discovered at an increasing frequency due to the widespread use of cross-sectional imaging.1, 2 Many of these are 4 cm or less in diameter (clinical stage T1a) and termed small renal masses (SRMs). They vary widely in biological aggressiveness, ranging from benign tumors to high grade renal cell carcinomas (RCCs). As a result, management options for these tumors have evolved over time and range from surgical resection to active surveillance.
Imaging is crucial to characterize renal masses and guide management. It is used to differentiate benign tumors from RCCs, and predict RCC histological subtype and grade where possible. Imaging is also used to stage RCC, and provide pre-operative planning. CT is currently the most commonly used modality for initial diagnosis and staging. MRI can provide additional characterization in some cases that may aid in management decision.
Dedicated renal mass CT and MRI protocols, where images are acquired before and after the administration of intravenous contrast material at prescribed timings, are usually performed to optimize renal mass characterization. However, evidence shows not all incidentally detected renal masses require such a complete assessment. For example, a homogenous hyperdense renal mass that measures greater than 70 Hounsfield units (HU) on a non-enhanced CT represents a benign hyperdense cyst in 99% of cases,3 and likely does not require additional imaging with contrast. Similarly, a homogeneous low attenuation lesion measuring between −10 and 20 HU is presumed to be a benign cyst without the need for additional imaging.4 While ultrasound can be useful in assessing whether a mass is cystic or solid, its use for renal mass characterization is limited by low sensitivity for small lesions, operator dependence, and other technical limitations. Though contrast enhanced ultrasound with microbubble agents is emerging as a useful modality to characterize previously indeterminate renal lesions,5–7 it is not currently widely available. In this review, we will summarize the current evidence of the biology of small solid renal masses, and discuss key approaches in imaging characterization of these masses using CT and MRI. Our discussion will focus on the well-circumscribed renal cortical tumors, and not tumors exhibiting clearly aggressive features.
Renal pseudotumors
Before establishing a diagnosis of a renal tumor, one should always consider the possibility of tumor mimics, since misdiagnosis could result in inappropriate management such as surgical resection. Renal pseudotumors can usually be correctly diagnosed by noting several imaging features as well as the clinical history.
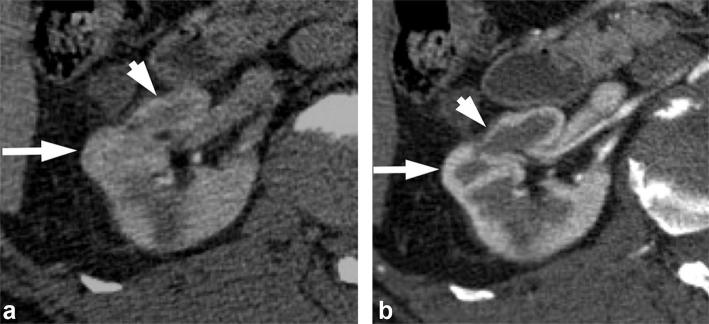
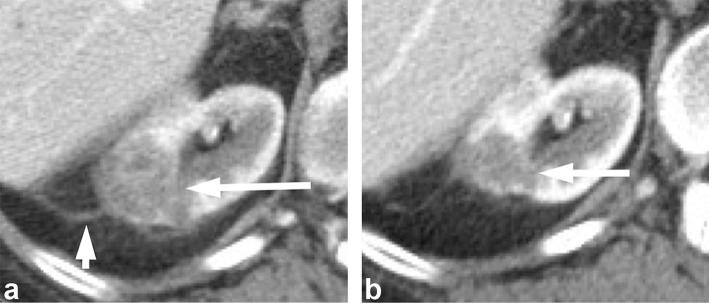
Focal hypertrophy of the renal parenchyma can be properly identified by noting that the “tumor” and normal renal parenchyma demonstrate the same enhancement pattern, and by recognizing adjacent parenchymal scarring. Images obtained during the corticomedullary phase may be particularly helpful in these cases to demonstrate the normal corticomedullary differentiation in the hypertrophied renal parenchyma (Figure 1). Focal pyelonephritis can be differentiated from a renal tumor by noting the presence of a striated or heterogeneous nephrogram, edema in the renal parenchyma adjacent to the lesion, and perinephric fat stranding. Acute renal infarcts can be distinguished from tumors based on the lack of renal contour deformity, wedge-shaped lesions with sharply demarcated straight margins, lack of contrast enhancement, and presence of a cortical rim nephrogram over the infarct. Infarcts usually occur when patients have known risk factors, such as atrial fibrillation, and symptoms of pain (Figure 2). When the differentiation of focal pyelonephritis or acute infarct from a tumor is uncertain, a short-interval follow-up scan can be obtained as these pseudotumors should evolve fairly rapidly, while a tumor is less likely to change significantly over a short time interval. Renal pseudoaneurysms can be diagnosed by observing an enhancement pattern that follows that of the vasculature.
Figure 1. .
A 68-year-old female with renal pseudotumor secondary to focal parenchymal hypertrophy. (a) Nephrographic phase image shows a bulge in the right lateral renal contour (long arrow) that mimics a tumor. There is adjacent renal cortical scarring (short arrow). (b) Corticomedullary image confirms the bulge in the renal contour represents normal renal parenchyma (long arrow), which appears more prominent due to adjacent scarring (short arrow).
Figure 2. .
A 63-year-old female with renal infarct. (a) Initial contrast-enhanced CT performed for abdominal pain shows an ill-defined right renal lesion (long arrow) and small amount of perinephric fat stranding (short arrow). Patient also had history of atrial fibrillation. Given the history, renal infarct was suspected. (b) Contrast-enhanced CT performed 3 months later shows evolution of the right renal lesion with decrease in its size, confirming that the lesion is not a tumor, and is more consistent with renal infarct given clinical history.
Renal tumor subtypes and biology of small renal masses
Clear cell RCC is the most common subtype and accounts for 70–80% of all RCCs. It is followed by papillary RCC (~10%), chromophobe RCC (~5%), and other rare subtypes of RCCs.8 Clear cell RCCs are usually considered the most aggressive of the more common subtypes.9 Yet, some studies have shown that tumor stage, grade and clinical performance, but not histology, were independent predictors of overall survival.10
Among renal masses 4 cm or less, approximately 80% are RCCs, with clear cell subtype accounting for the majority of the cases.11, 12 With decreasing tumor size, the percentage of clear cell RCCs decreases and the percentage of papillary RCCs increases.13 Benign renal tumors also increase in prevalence as tumor size decreases. Approximately 20% of solid tumors that measure between 1 and 4 cm in diameter are benign.14 The prevalence of benign tumors rises to more than 40% when the tumor measures less than 1 cm12. Approximately, 70–80% of RCCs measuring 4 cm or less in diameter are low grade tumors that are unlikely to metastasize.11, 15,16 The remaining are potentially aggressive lesion with high Fuhrman grade (Grades 3 and 4). Locally advanced and metastatic disease have been reported in 6.3 and 3% of patients with SRMs at diagnosis, respectively.17
Tumor size is one of the most important predictors of malignancy and aggressive histology, with increasing odds of clear cell histology and higher grade with increasing tumor size.12, 18 Interestingly, data from active surveillance show that tumor size at presentation does not predict the overall growth rate, and that the growth rate of benign oncocytomas is similar to that of RCCs.19 Therefore, growth rate of SRMs on surveillance imaging is not a reliable predictor of malignancy. However, none of the tumors that exhibited zero growth under surveillance progressed to metastasis.16
Given the increasing detection of SRMs and the recognition of the biological heterogeneity in these masses, a wide variety of treatment options exist, including surgery (radical or nephron sparing), thermal ablations, and active surveillance. Imaging characterization of these SRMs is essential in rationally guiding the selection of different management options.
CT characterization of renal masses
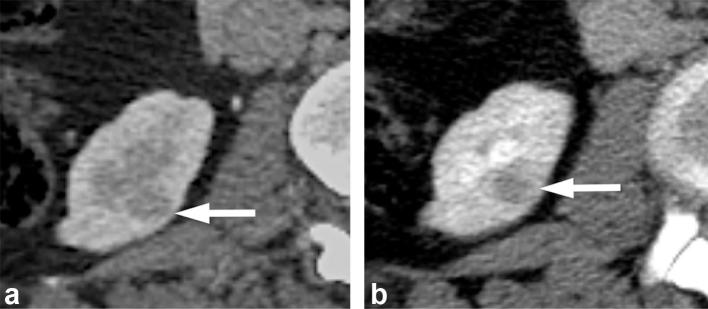
CT is the imaging modality that is most commonly used to evaluate renal masses. A dedicated CT renal mass protocol should include a non-enhanced phase, and a nephrographic phase obtained at approximately 90–120 s following intravenous contrast administration. During the nephrographic phase, there is maximal and homogenous enhancement of the renal parenchyma, which allows for the identification of small hypovascular masses that may be obscured during the corticomedullary phase due to their similar CT attenuation when compared to the relatively unenhanced renal medulla (Figure 3). The corticomedullary and excretory phases can be optionally acquired, and may be useful in subtyping RCC, differentiating RCC from urothelial cancer, or assessing potential involvement of the collecting system by the tumor.20 Another important parameter of a renal mass CT protocol is the slice thickness. Thin slices, i.e. 2–3 mm, should be prescribed to minimize partial volume artifact that may impact the characterization of SRMs.
Figure 3.
A 65-year-old female with a renal mass. (a) Contrast enhanced CT in the corticomedullary phase shows a small hypodense right renal lesion (arrow) which is obscured by the relatively unenhanced adjacent renal medulla. (b) CT image in the nephrographic phase shows the same lesion (arrow) to a much better advantage surrounded by the homogenously enhancing renal parenchyma. The patient underwent active surveillance for this lesion, which remained stable for one year. The patient was then lost to follow up.
Assessing the presence of fat
The presence of macroscopic or bulk fat in a non-calcified renal mass is virtually diagnostic of a benign angiomyolipoma (AML). Most AMLs do not need to be treated, unless they are large (usually >4 cm), that increases the risk of bleeding, or are symptomatic.
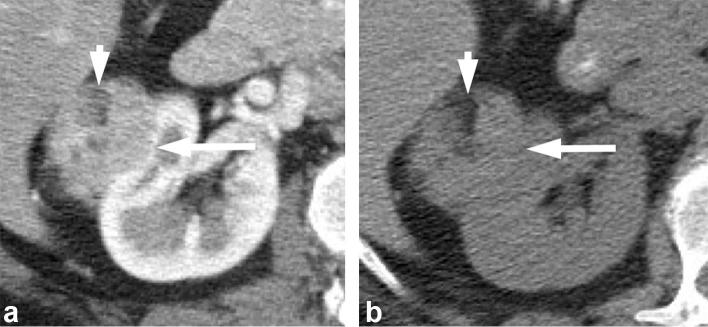
On CT, macroscopic fat is defined as having attenuation less than −10 HU.21, 22 In most cases, the presence of macroscopic fat in a renal mass is readily apparent. However, small amounts may be obscured on a contrast-enhanced scan (Figure 4). Therefore, an unenhanced scan with thin slice sections (preferably at 1.25 mm) should be obtained to look for small amounts of macroscopic fat in a renal mass22 (Figure 4). AMLs that do not demonstrate macroscopic or visible fat on imaging are termed lipid-poor AMLs, and they mimic RCCs. Lipid-poor AMLs are uncommon; in one series, biopsies of 351 SRMs detected by CT or MRI revealed only 1% to be lipid-poor AMLs.23 Several investigators have reported CT histogram analysis of percentages of pixels measuring fat attenuation to be useful in diagnosing lipid-poor AML,24, 25 however, others have not found this to be reliable.26, 27
Figure 4.
A 60-year-old female with an angiomyolipoma. (a) Contrast enhanced CT image demonstrates an enhancing mass (long arrow) in the right kidney with questionable area of macroscopic fat (short arrow). (b) Unenhanced CT image demonstrates definite macroscopic fat (short arrow) in the mass (long arrow), allowing a confident diagnosis of an angiomyolipoma.
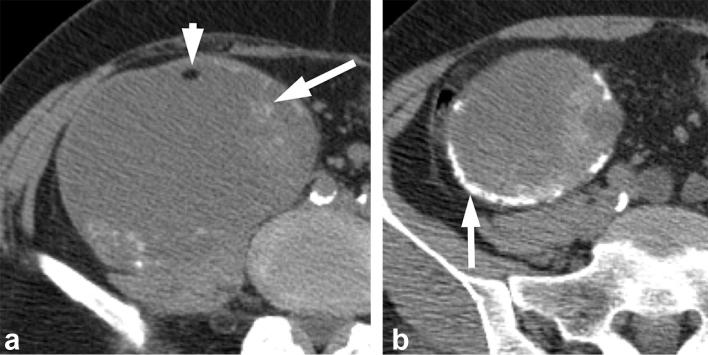
In very rare cases, macroscopic fat can be seen in RCCs. The fat may be secondary to engulfment of adjacent fat, osseous metaplasia,28 or cholesterol necrosis.29 A “fat containing” RCC may potentially be mistaken as a benign AML. A feature that is helpful in differentiating between the two is the presence of calcifications, as calcifications are rarely seen in AMLs.30 If a renal mass contains calcifications and fat, then it is suspicious for a RCC (Figure 5). Occasionally, an ablated renal tumor can been surrounded by fat and a thin rim of peritumoral soft tissue attenuation,31 and may potentially mimic an AML (Figure 6). This post-procedural appearance can be easily recognized based on the history and review of prior scans.
Figure 5. .
A 60-year-old male with a rare papillary RCC containing macroscopic fat and calcification. (a) Unenhanced CT image demonstrates an exophytic right renal mass with a focus of macroscopic fat (short arrow) and amorphous calcifications (long arrow). (b) Image of the more inferior aspect of the renal mass shows dense calcifications (long arrow).
Figure 6. .
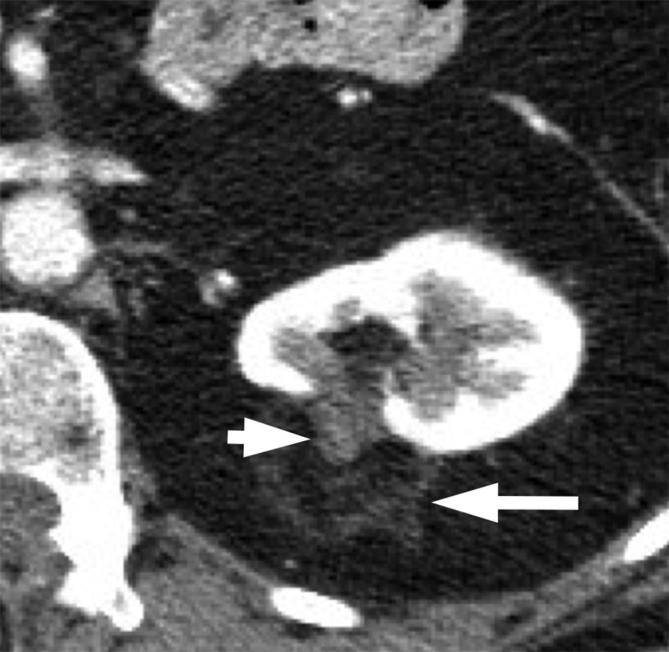
A 48-year-old female post-ablation of a left renal mass. Contrast-enhanced CT shows the ablated renal tumor (short arrow) surrounded by fat and a thin rim of peritumoral soft tissue attenuation (long arrow).
Assessing the presence of enhancement
On CT, a renal mass is generally considered to be non-enhancing if the change in attenuation is ≤10 HU between the unenhanced and contrast-enhanced scans, and enhancing if the change is >20 HU. If the change is between 10 and 20 HU, the enhancement is considered borderline, equivocal or indeterminate.32, 33 It is important to note that pseudoenhancement can occur when small cysts are seen against the background of intense enhancement of the renal parenchymal.34 Additionally, it may be challenging to determine the presence or absence of enhancement in small (i.e. ≤1.5 cm in diameter) renal masses due to volume-averaging. When assessing HU changes in a renal mass, it is important to compare the same region of interest on the unenhanced and contrast enhanced images. It may also be necessary to place several regions of interest in lesions that are heterogeneous to be certain that focal areas of enhancement are not missed.
Most renal tumors enhance avidly and the diagnosis of an enhancing mass can be made unequivocally. However, a minority of small RCCs, in particular papillary RCCs, have low-level enhancement. The changes in HU in these tumors following contrast administration sometimes do not reach the usual enhancement thresholds, and these RCCs might be misinterpreted as hyperdense cysts.35
Dual energy CT (DECT) has been shown to be useful for assessing renal lesion enhancement in several ways. For example, DECT with reconstruction of virtual monochromatic image can reduce or eliminate renal cyst pseudoenhancement.36 Several studies have also reported improved differentiation between non-enhancing cysts and low-level enhancing tumors.37–40 Other studies have shown that DECT can distinguish solid tumors from hyperdense cysts incidentally discovered on a single phase post-contrast CT,41–43 and can be valuable when a comprehensive multiphase renal protocol CT is not available. Several DECT artifacts, however, may limit interpretation of a renal lesion enhancement. These include persistent iodine contrast on the virtual unenhanced image due to failed spectral cancellation, and the factitious color-coded voxels on the iodine maps due to the presence of calcium or iron in a lesion.44 MRI may be considered in cases where the presence of enhancement is equivocal or uncertain on CT.
Differentiating renal tumor subtypes at CT
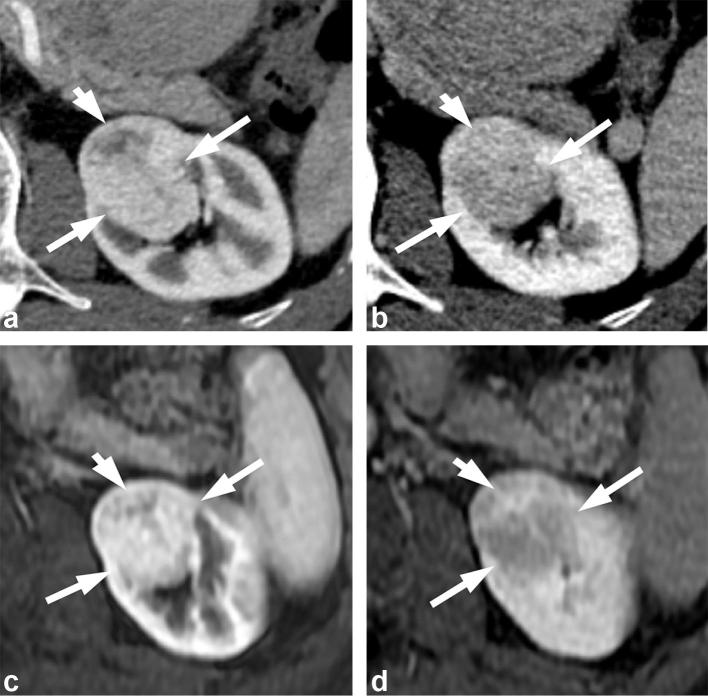
It is challenging to reliably differentiate RCCs from some benign tumors such as oncocytomas and lipid-poor AMLs. Multiple studies have evaluated whether enhancement characteristics can predict tumor histology. Oncocytomas have been reported to demonstrate a “segmental enhancement inversion” pattern during corticomedullary and early excretory phase45, 46 (Figure 7). However, this finding is also seen in RCCs.47–49 A central scar has been associated with oncocytomas (Figure 8), but this feature is also seen in RCC (Figure 9). In a retrospective study of RCCs and oncocytomas evaluated with four phase CT, multiphasic enhancement thresholds differentiated clear cell RCC from oncocytoma with a moderate accuracy of 77%.50 However, the absolute tumor enhancement values may be influenced by factors such as tumor size, contrast medium concentration and scanning protocols. These multiphasic enhancement thresholds have not been validated in larger studies.
Figure 7. .
A 71-year-old male with renal oncocytoma. (a) CMP CT image shows enhancing left renal mass with two areas of differential enhancement: high enhanced (long arrows) and less enhanced (short arrow). (b) Early excretory phase CT image shows inversion of the enhancement pattern with the highly enhanced area on the CMP becoming less enhancing (long arrows), and the less enhancing area on the CMP highly enhancing (short arrow). (c, d) Show similar findings on contrast-enhanced MRI. CMP, corticomedullar phase.
Figure 8.
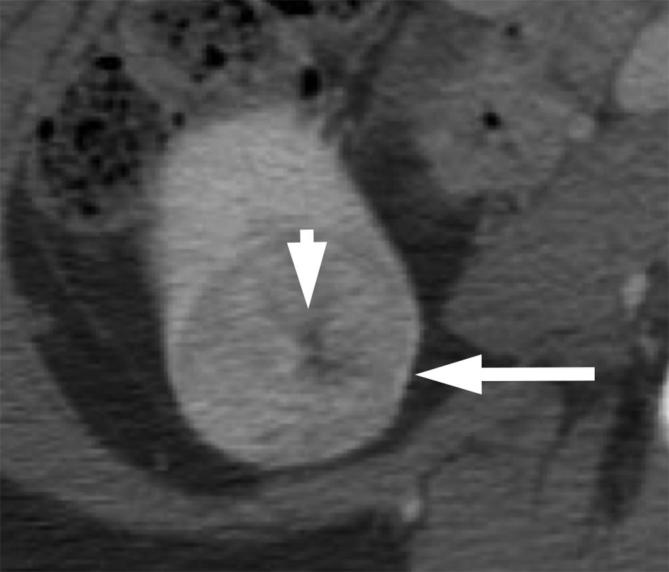
A 57-year-old female with renal oncocytoma. Contrast enhanced CT shows an enhancing right renal mass (long arrow) with a central scar (short arrow).
Figure 9.
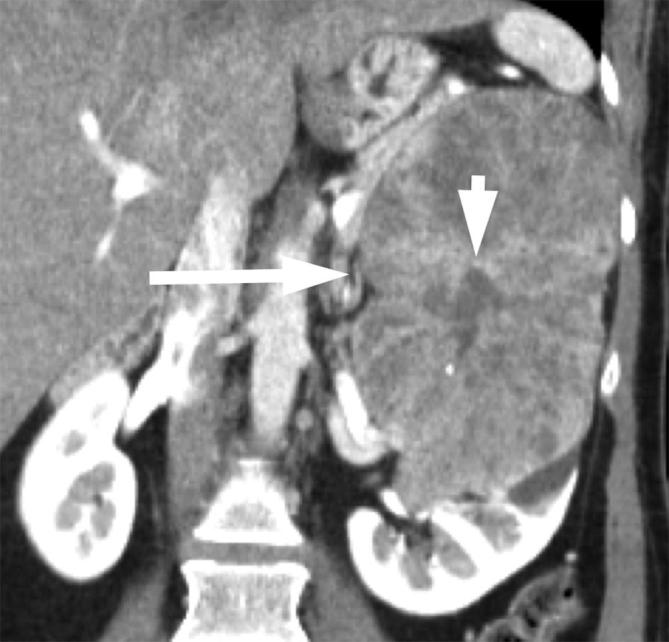
A 46-year-old female with chromophobe RCC. Contrast-enhanced CT shows a large heterogeneously enhancing left renal mass (long arrow) with central scar (short arrow). RCC, renal cell carcinoma.
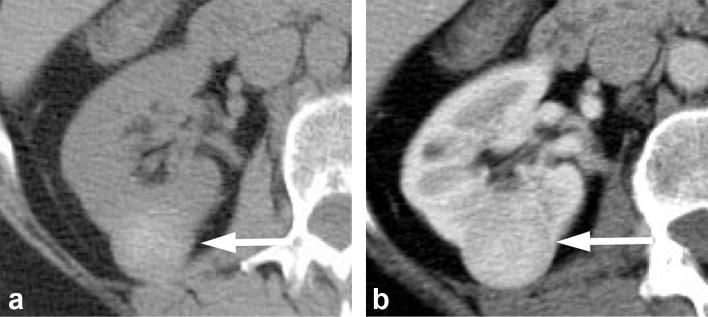
Lipid-poor AML is another common mimic of RCC at imaging. High tumor attenuation on unenhanced CT and homogenous enhancement have been reported to suggest lipid-poor AMLs51–53 (Figure 10). Though definitive differentiation between these types of AMLs from RCCs on imaging is not yet possible, when these features are present, biopsy may be appropriate to make a definitive diagnosis.33
Figure 10.
A 63-year-old male with an incidentally detected renal mass. (a) Unenhanced CT shows an hyperattenuating right renal mass (arrow). (b) Contrast-enhanced CT shows the mass to be homogenously enhancing. The imaging features suggest but are not diagnostic for a lipid-poor angiomyolipoma. The patient subsequently underwent a percutaneous renal biopsy which confirmed the diagnosis of a lipid-poor angiomyolipoma.
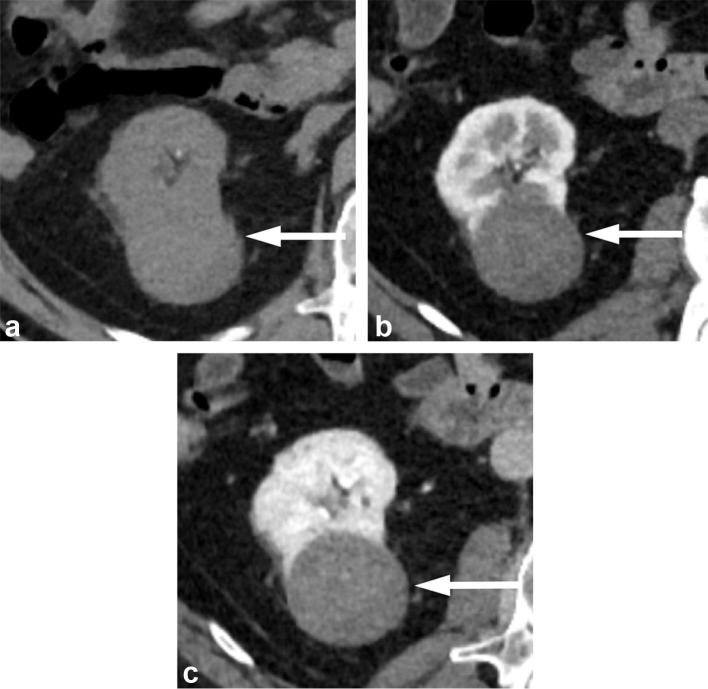
Clear cell and papillary tend to be the most and least enhancing subtypes of RCCs, respectively. In one study comparing clear cell and papillary RCCs, tumor attenuation less than 100 HU in the corticomedullary phase was 95.7% specific for papillary RCCs after normalization for aortic enhancement.54 Qualitatively, in contrast to other RCC subtypes, papillary RCCs are commonly hypovascular and show progressive enhancement which peaks in the nephrographic phase55 (Figure 11). Given that papillary RCC is usually considered a less aggressive subtype, lesions with such imaging features may be managed conservatively, e.g. with active surveillance, especially in patients who are poor surgical candidates. It is important to note, however, that there are two different subtypes of papillary RCCs (Types 1 and 2), with the less common Type 2 being more aggressive. The overlap of imaging features between the two subtypes prevents reliable differentiation.56
Figure 11. .
A 65-year-old male with papillary RCC. (a) Unenhanced CT image shows an exophytic right renal mass that is intermediate in attenuation measuring 40 HU. (b) Corticomedullary phase and (c) nephrographic phase images show the mass to have progressive low-level enhancement with attenuation increase to 58 HU in corticomedullary phase, and to 77 HU in nephrographic phase. RCC, renal cell carcinoma.
Overall, several CT features related to tumor density on unenhanced images as well as enhancement pattern following contrast may be helpful to gauge the likelihood of certain histology, though definitive diagnosis remains difficult except for AML with macroscopic fat. In cases of equivocal enhancement in a renal mass on CT, MRI should be considered.
MRI characterization of renal masses
MRI is frequently used as a problem-solving tool when indeterminate renal lesions are seen on CT, but can be used as the initial dedicated study for the workup of a renal mass seen on ultrasound. MRI provides multiple forms of soft tissue contrast as well as functional parameters, and permits a comprehensive evaluation of renal masses.
A typical renal mass MRI protocol should include a T2 weighted sequence, which is helpful in detecting and characterizing cystic renal masses. The T2 signal intensity of a solid renal mass is also helpful in suggesting certain histology, as described below. T1 weighted gradient echo in- and opposed-phase imaging should be included to allow better detection of macroscopic or microscopic/intracytoplasmic fat, as well as hemosiderin in a renal mass. T1 weighted three-dimensional fat suppressed gradient-echo imaging should be performed before and following administration of gadolinium-based contrast material in corticomedullary, nephrographic, and excretory phases. The enhancement pattern in a renal mass on multiphase MRI has been reported to be useful in determining RCC subtypes.57 Diffusion-weighted (DW) MRI is an optional but frequently included sequence in a renal mass protocol. Several studies have suggested the potential utility of apparent diffusion coefficient (ADC) values to provide further characterization of a renal mass as described below.
Assessing the presence of fat
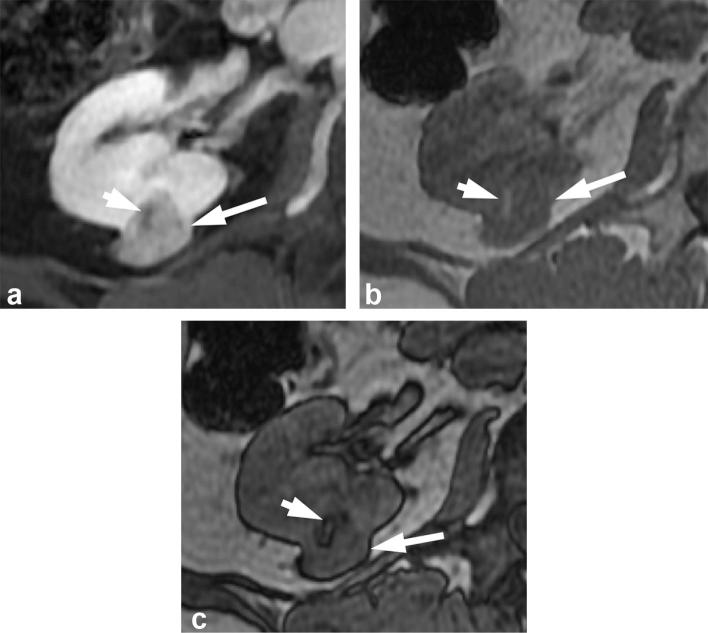
An AML with macroscopic fat can be definitively diagnosed on MRI by observing the loss of signal on fat suppressed images. However, small amounts of macroscopic fat can be subtle and missed on fat suppressed sequences. With chemical shift imaging, signal loss occurs at fat-water interfaces on the opposed-phase images, creating the india-ink artefact. The small amount of fat may be more easily visualized as a small dark ring (Figure 12). The presence of such a rim of signal loss on the opposed-phase images at a renal mass-kidney interface or within a renal mass has been shown to be indicative of an AML.58
Figure 12. .
A 55-year-old female with renal angiomyolipoma. (a) Post-gadolinium enhanced image shows a well-defined enhancing right renal mass (long arrow) with a small area of hypointensity (short arrow). In-phase (b) and opposed-phase (c) images confirm the presence of macroscopic fat (short arrow) in the mass with T1 hyperintensity on the in-phase image, and rim of signal loss on the opposed-phase image.
It is important to note that microscopic/intracytoplasmic fat is detected as more diffuse or ill-defined areas of signal loss, rather than a rim loss of signal on opposed phase MRI. The diffuse pattern of signal loss on opposed phased MRI occurs when there is intermixing of fat with other soft tissue elements within a voxel in the case of lipid-poor AML or when there is intracellular fat in the case of clear cell subtype of RCC. Therefore, the presence of microscopic fat cannot be used to differentiate between AML and RCC.59, 60
Assessing the presence of enhancement
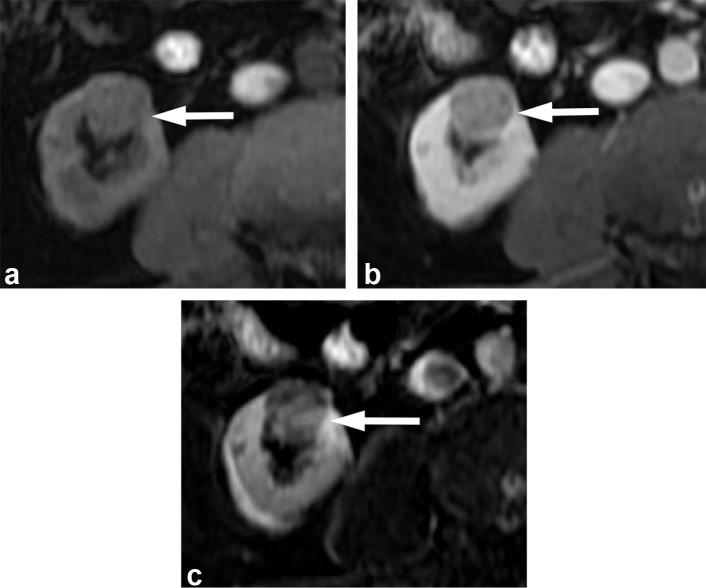
MRI is not subject to pseudoenhancement as in CT. Quantitatively on MRI, a renal mass is considered enhancing if there is greater than 15% signal intensity increase following gadolinium-based contrast administration. This has shown 100% sensitivity and 94% specificity for the detection of enhancement on MRI.61 Qualitatively, a renal mass is enhancing if there is a perceptible increase in signal intensity after contrast administration. If a lesion has intrinsic T1 hyperintensity, which may limit visual assessment of enhancement, subtraction imaging can be helpful in differentiating between hemorrhagic/proteinaceous cysts from renal tumors62 (Figure 13). A potential limitation of subtraction imaging is misregistration between the unenhanced and enhanced images, and this can create regions of artifactual enhancement within a lesion. Therefore, it is important to only use source images that are without motion and are well-aligned to generate accurate subtraction images.
Figure 13. .
A 70-year-old male with papillary RCC. (a) T1 weighted fat saturated pre-contrast image shows a right renal mass (arrow) with intermediate T1 intensity. (b) T1 weighted fat saturated post-contrast image shows the mass with indeterminate enhancement. (c) Subtraction image shows clear enhancement in the mass consistent with a tumor which was later resected and proven to a papillary RCC.
MRI has been shown to be more sensitive to contrast enhancement for renal masses with indeterminate enhancement at CT.56, 63 This is helpful in the case of papillary RCCs which can have low-level enhancement that may be missed at CT. Another advantage of MRI over CT in the assessment of enhancement is for calcified masses. On CT, enhancing soft tissue in a renal mass can be obscured by coarse calcifications. In those instances, MRI can be helpful because calcification would appear hypointense and the adjacent enhancing tumor tissue can be better visualized.
Multiparametric MRI in characterizing renal masses
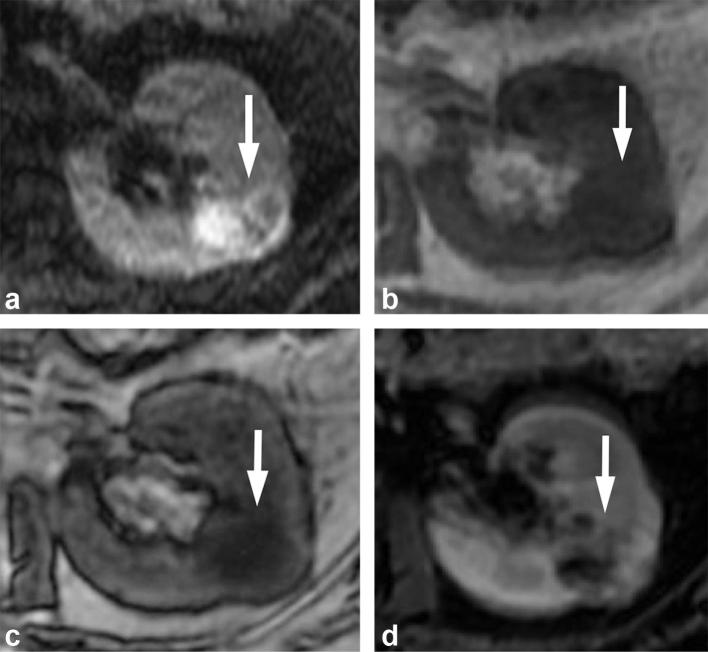
Similar to CT, other than AMLs with macroscopic fat, MRI cannot yet reliably differentiate benign and malignant renal tumors. However, the availability of multiple forms of soft-tissue contrast on multiparametric MRI can suggest subtypes of renal tumors that have different prognosis and aid in clinical management. For example, clear cell RCCs, the most common and generally more aggressive subtype, typically show intermediate to high signal intensity on T2 weighted images and hypervascularity following intravenous contrast administration.57 In addition, some clear cell RCCs have microscopic/intravoxel fat that is evident on dual echo T1 weighted images. While these features are non-specific individually, the combination of tumor hypervascularity, intermediate to high T2 signal, and intravoxel lipid is highly suggestive of clear cell RCCs64 (Figures 14 and 15).
Figure 14.
A 71-year-old male with clear cell RCC. (a) T2 weighted, fat suppressed image shows the mass (arrow) has heterogeneous high T2 signal. (b) T1 weighted dual echo in-phase and (c) opposed-phase images show a left renal mass (arrows) that demonstrates signal drop in the opposed-phase image (b), consistent with the presence of microscopic fat. (d) Gadolinium-enhanced image shows avid enhancement of the mass. The combination of findings is suggestive of a clear cell renal cell carcinoma, and was proven at pathology.
Figure 15. .
A 73-year-old female with a clear cell RCC. (a) T2 weighted, fat suppressed image shows the mass (arrow) has heterogeneous high T2 signal. (b) T1 weighted dual echo in-phase and (c opposed-phase (c) images show the mass (arrows) demonstrating signal drop in the opposed-phase image, consistent with the presence of microscopic fat. (d) Gadolinium-enhanced image shows heterogeneous enhancement of the mass. The combination of findings is suggestive of a clear cell RCC, and was proven at pathology.
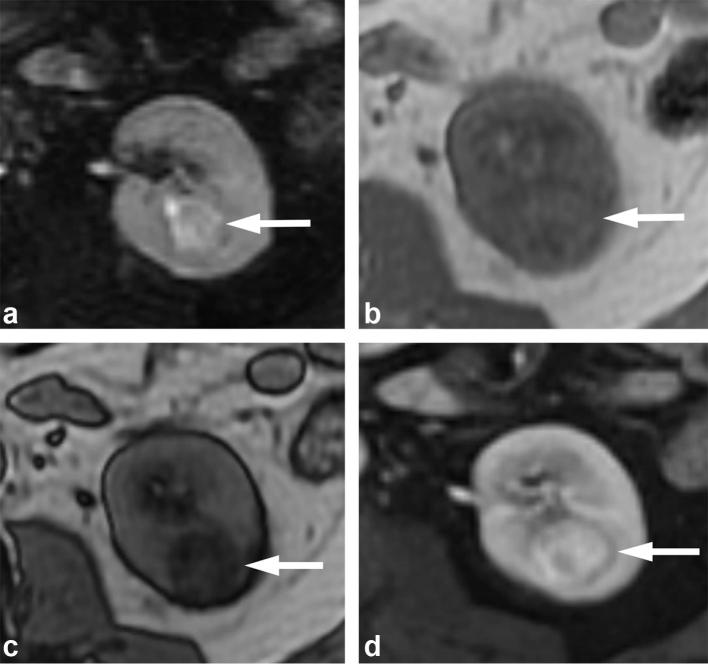
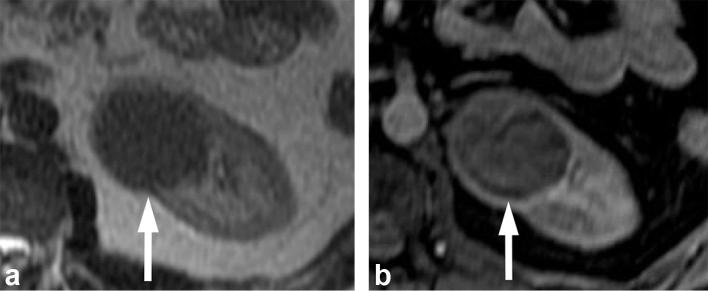
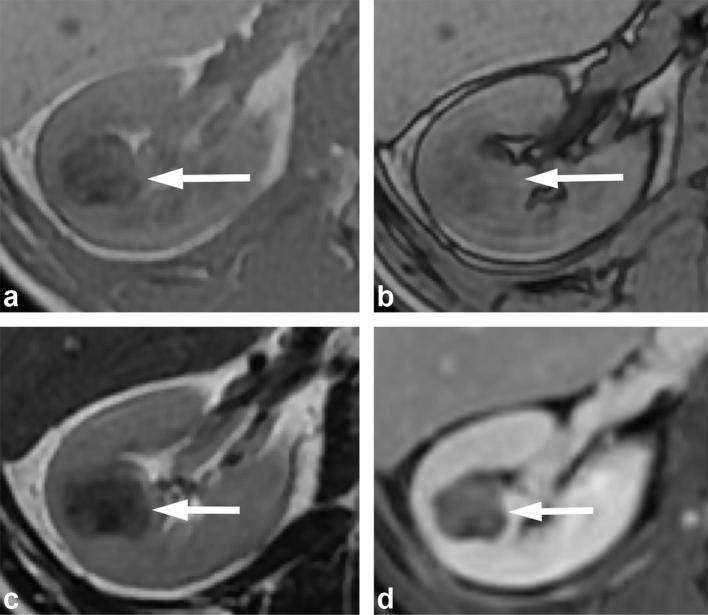
In comparison, papillary RCCs typically are noted for their low-level of enhancement, which becomes more apparent on later phases of MRI.56 In addition, papillary RCCs usually have lower signal intensity compared to normal renal parenchyma on T2 weighted images, thought to be secondary to the papillary architecture and presence of hemosiderin.65 Hemosiderin, which can also be seen in other malignant renal tumors, is more commonly associated with papillary RCCs,66–68 and manifests as areas of signal loss on in-phase images when compared to opposed-phased images. The presence of low-level enhancement, low signal on T2 weighted images, and the presence of hemosiderin would suggest a papillary RCC64, 66 (Figures 16 and 17). Because papillary RCCs tend to a be a less aggressive subtype compared to clear cell RCCs, the presence of these imaging features may influence the management to active surveillance rather than resection in appropriately selected patients.
Figure 16. .
A 38-year-old male with papillary RCC. (a) T2 weighted image shows a hypointense mass (arrow). (b) T1 weighted post-contrast image shows low-level enhancement in the mass (arrow). The combination of findings is suggestive of a papillary RCC, which was proven at pathology. RCC, renal cell carcinoma.
Figure 17. .
A 55-year-old male with papillary RCC. (a) In-phase and (b) opposed-phase images show a right renal mass (arrow) with loss of signal on the in-phase (longer TE sequence) when compared to opposed-phase, consistent with presence of hemosiderin in the mass. (c) T2 weighted MR image shows the mass to be T2 hypointense (arrow). (d) T1 weighted post-contrast image obtained in the nephrographic phase shows the mass with low-level enhancement. The combination of the findings is highly suggestive of a papillary RCC, and was proven at pathology. RCC, renal cell carcinoma.
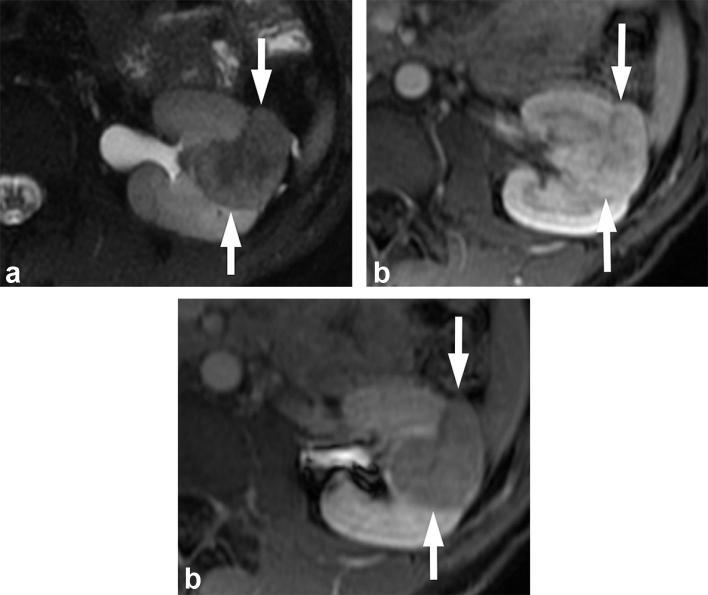
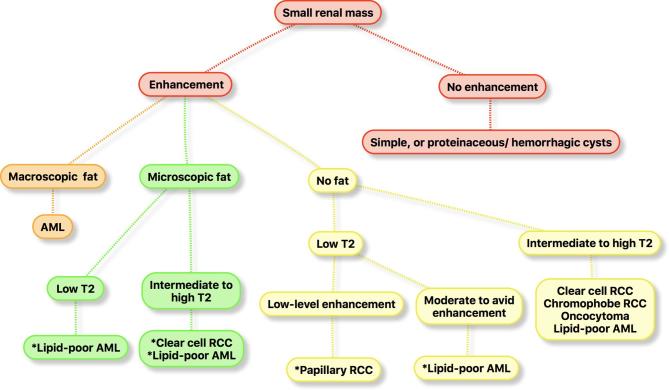
Lipid-poor AMLs are also commonly hypointense on T2 weighted sequences, similar to papillary RCCs. The low T2 signal of lipid-poor AML is thought to reflect the presence of abundant smooth muscle.69, 70 Unlike the low-level enhancement seen in papillary RCCs, lipid-poor AMLs usually have a high level of enhancement with a higher arterial to delayed enhancement ratio, a feature used to differentiate from papillary RCCs (Figure 18).59, 71 As previously discussed, both clear cell RCCs and lipid-poor AMLs can demonstrate diffuse signal loss on opposed-phase relative to in-phase images due to the presence of microscopic or intravoxel fat. The presence of low T2 signal would favor a lipid poor AML, and the presence of intermediate to high T2 signal or necrosis would favor a clear cell RCC. Although the features described above for lipid-poor AMLs are not sufficiently specific, their presence may warrant a biopsy for a definitive diagnosis. Similar to CT, there are no consistently reliable MRI features that can differentiate between oncocytomas from RCCs. The multiparametric MRI features that can be used to diagnose or to suggest histology of the more common renal tumors are summarized in Figure 19.
Figure 18. .
A 32-year-old male with lipid poor angiomyolipoma. (a) T2 weighted, fat-suppressed image shows the mass (arrows) to be hypointense. T1 weighted post-gadolinium image shows the mass (arrows) to be avidly enhancing in the corticomedullary phase (b), and washing out in the early excretory phase (c).
Figure 19.
Algorithm that can be used to diagnose or suggest histology of the more common subtypes of RCCs and benign renal tumors using multiparametric MRI features. *, the imaging features are suggestive but not diagnostic. AML, angiomyolipoma; RCC, renal cell carcinoma.
Diffusion weighted MRI
Multiple studies have investigated the value of DW MRI for renal tumor characterization. For example, one retrospective study showed that the mean ADC values derived with DW MRI were higher in oncocytomas compared to RCCs.72 Other studies have reported that ADC values were useful in differentiating between clear cell RCCs from non-clear cell RCCs, with papillary RCCs have the lowest ADC values.72–74 Mean ADC values of high grade clear cell RCCs were also shown to be lower than those of low grade clear cell RCCs.74, 75 These studies show the potential of DW MRI to provide useful information in renal tumor characterization, and may be particularly helpful when gadolinium-based contrast material cannot be administered. However, the routine use of DW MRI in renal mass evaluation is currently limited by the significant variability in acquisition with different b-values, variability in ADC measurements, and the overlap in ADC values among the different tumor subtypes.
Management of indeterminate small solid renal masses
Despite the advances in CT and MRI, a proportion of the incidentally detected small solid renal masses remain indeterminate on imaging due to overlap in imaging features between RCCs and benign tumors.76 Given the increased recognition of the higher likelihood of benign renal tumors and indolent RCCs among the SRMs, their management has evolved over time to include both surgery and less invasive approaches such as ablation and active surveillance. The American College of Radiology has also provided consensus expert opinions on the management of incidentally detected solid renal masses that do not contain macroscopic fat and are indeterminate at imaging in an updated white paper in 2017.77 For solid masses measuring <1 cm, surveillance is recommended either with MRI or CT, beginning at 6–12 months, and yearly for 5 years. For masses with growth (defined by ≥4 mm per year) or change in morphology (i.e. degree of heterogeneity) on surveillance imaging or masses that measure 1 cm or greater, patient should be referred for management, with management options including biopsy, definitive treatment, or surveillance. Biopsy should be strongly considered for masses that are hyperattenuating on unenhanced CT or hypointense on T2 weighted MRI as these have a higher probability of being a lipid-poor AML.77
The role of renal mass biopsy is evolving, and it has been recommended for the characterization of all SRMs when the results may alter management.78 Studies have suggested that it can guide treatment decisions for small incidentally detected renal tumors and can prevent unnecessary surgery.79, 80 Renal mass biopsy may also assist management in patients with limited life expectancy or significant comorbidities. Limitations of renal mass biopsy include non-diagnostic results in approximately 10–20% of the cases,23, 81 overlap of histological features between oncocytoma and chromophobe RCC,82 and undergrading of small RCCs.83
Conclusion
Due to the widespread utilization of imaging, there is increasing incidental detection of small solid renal masses which have heterogeneous oncological behavior. CT, and especially MRI, can provide useful information on the histological subtype of the renal masses. While considerable challenges remain in the definitive imaging characterization of some of these masses, careful analysis of the imaging features can help narrow the differential diagnoses and guide patient management.
Contributor Information
Zhen J Wang, Email: Zhen.wang@ucsf.edu.
Antonio C Westphalen, Email: antonio.westphalen@ucsf.edu.
Ronald J Zagoria, Email: ron.zagoria@ucsf.edu; Ronald.Zagoria@ucsf.edu.
REFERENCES
- 1.Hollingsworth JM, Miller DC, Daignault S, Hollenbeck BK. Rising incidence of small renal masses: a need to reassess treatment effect. J Natl Cancer Inst 2006; 98: 1331–4. doi: 10.1093/jnci/djj362 [DOI] [PubMed] [Google Scholar]
- 2.Leone AR, Diorio GJ, Spiess PE, Gilbert SM. Contemporary issues surrounding small renal masses: evaluation, diagnostic biopsy, nephron sparing, and novel treatment modalities. Oncology 2016; 30: 507–14. [PubMed] [Google Scholar]
- 3.Jonisch AI, Rubinowitz AN, Mutalik PG, Israel GM. Can high-attenuation renal cysts be differentiated from renal cell carcinoma at unenhanced CT? Radiology 2007; 243: 445–50. doi: 10.1148/radiol.2432060559 [DOI] [PubMed] [Google Scholar]
- 4.O’Connor SD, Pickhardt PJ, Kim DH, Oliva MR, Silverman SG. Incidental finding of renal masses at unenhanced CT: prevalence and analysis of features for guiding management. AJR Am J Roentgenol 2011; 197: 139–45. doi: 10.2214/AJR.10.5920 [DOI] [PubMed] [Google Scholar]
- 5.Zarzour JG, Lockhart ME, West J, Turner E, Jackson BE, Thomas JV, et al. Contrast-enhanced ultrasound classification of previously indeterminate renal lesions. J Ultrasound Med 2017; 36: 1819–27. doi: 10.1002/jum.14208 [DOI] [PubMed] [Google Scholar]
- 6.Barr RG, Peterson C, Hindi A. Evaluation of indeterminate renal masses with contrast-enhanced US: a diagnostic performance study. Radiology 2014; 271: 133–42. doi: 10.1148/radiol.13130161 [DOI] [PubMed] [Google Scholar]
- 7.Di Vece F, Tombesi P, Ermili F, Sartori S. Management of incidental renal masses: Time to consider contrast-enhanced ultrasonography. Ultrasound 2016; 24: 34–40. doi: 10.1177/1742271X15626194 [DOI] [PMC free article] [PubMed] [Google Scholar]
- 8.Reuter VE. The pathology of renal epithelial neoplasms. Semin Oncol 2006; 33: 534–43. doi: 10.1053/j.seminoncol.2006.06.009 [DOI] [PubMed] [Google Scholar]
- 9.Cheville JC, Lohse CM, Zincke H, Weaver AL, Blute ML. Comparisons of outcome and prognostic features among histologic subtypes of renal cell carcinoma. Am J Surg Pathol 2003; 27: 612–24. [DOI] [PubMed] [Google Scholar]
- 10.Patard JJ, Leray E, Rioux-Leclercq N, Cindolo L, Ficarra V, Zisman A, et al. Prognostic value of histologic subtypes in renal cell carcinoma: a multicenter experience. J Clin Oncol 2005; 23: 2763–71. doi: 10.1200/JCO.2005.07.055 [DOI] [PubMed] [Google Scholar]
- 11.Rothman J, Egleston B, Wong YN, Iffrig K, Lebovitch S, Uzzo RG. Histopathological characteristics of localized renal cell carcinoma correlate with tumor size: a SEER analysis. J Urol 2009; 181: 29–34. doi: 10.1016/j.juro.2008.09.009 [DOI] [PMC free article] [PubMed] [Google Scholar]
- 12.Frank I, Blute ML, Cheville JC, Lohse CM, Weaver AL, Zincke H. Solid renal tumors: an analysis of pathological features related to tumor size. J Urol 2003; 170: 2217–20. doi: 10.1097/01.ju.0000095475.12515.5e [DOI] [PubMed] [Google Scholar]
- 13.Pahernik S, Ziegler S, Roos F, Melchior SW, Thüroff JW. Small renal tumors: correlation of clinical and pathological features with tumor size. J Urol 2007; 178: 414–7. doi: 10.1016/j.juro.2007.03.129 [DOI] [PubMed] [Google Scholar]
- 14.Corcoran AT, Russo P, Lowrance WT, Asnis-Alibozek A, Libertino JA, Pryma DA, et al. A review of contemporary data on surgically resected renal masses-benign or malignant? Urology 2013; 81: 707–13. doi: 10.1016/j.urology.2013.01.009 [DOI] [PubMed] [Google Scholar]
- 15.Thompson RH, Hill JR, Babayev Y, Cronin A, Kaag M, Kundu S, et al. Metastatic renal cell carcinoma risk according to tumor size. J Urol 2009; 182: 41–5. doi: 10.1016/j.juro.2009.02.128 [DOI] [PMC free article] [PubMed] [Google Scholar]
- 16.Smaldone MC, Kutikov A, Egleston BL, Canter DJ, Viterbo R, Chen DY, et al. Small renal masses progressing to metastases under active surveillance: a systematic review and pooled analysis. Cancer 2012; 118: 997-1006. doi: 10.1002/cncr.26369 [DOI] [PMC free article] [PubMed] [Google Scholar]
- 17.Kates M, Korets R, Sadeghi N, Pierorazio PM, McKiernan JM. Predictors of locally advanced and metastatic disease in patients with small renal masses. BJU Int 2012; 109: 1463–7. doi: 10.1111/j.1464-410X.2011.10553.x [DOI] [PubMed] [Google Scholar]
- 18.Thompson RH, Kurta JM, Kaag M, Tickoo SK, Kundu S, Katz D, et al. Tumor size is associated with malignant potential in renal cell carcinoma cases. J Urol 2009; 181: 2033–6. doi: 10.1016/j.juro.2009.01.027 [DOI] [PMC free article] [PubMed] [Google Scholar]
- 19.Chawla SN, Crispen PL, Hanlon AL, Greenberg RE, Chen DY, Uzzo RG. The natural history of observed enhancing renal masses: meta-analysis and review of the world literature. J Urol 2006; 175: 425–31. doi: 10.1016/S0022-5347(05)00148-5 [DOI] [PubMed] [Google Scholar]
- 20.Wang ZJ, Davenport MS, Silverman SG. CT renal mass protocls v1.0; Society of abdominal radiology disease focused panel on eenal cell carcinoma. 2017. Available from: http://c.ymcdn.com/sites/www.abdominalradiology.org/resource/resmgr/education_dfp/RCC/RCC.CTprotocolsfinal-7-15-17.pdf [Accessed December, 25, 2017].
- 21.Simpson E, Patel U. Diagnosis of angiomyolipoma using computed tomography-region of interest < or =-10 HU or 4 adjacent pixels < or =-10 HU are recommended as the diagnostic thresholds. Clin Radiol 2006; 61: 410–6. doi: 10.1016/j.crad.2005.12.013 [DOI] [PubMed] [Google Scholar]
- 22.Davenport MS, Neville AM, Ellis JH, Cohan RH, Chaudhry HS, Leder RA. Diagnosis of renal angiomyolipoma with hounsfield unit thresholds: effect of size of region of interest and nephrographic phase imaging. Radiology 2011; 260: 158–65. doi: 10.1148/radiol.11102476 [DOI] [PubMed] [Google Scholar]
- 23.Parks GE, Perkins LA, Zagoria RJ, Garvin AJ, Sirintrapun SJ, Geisinger KR. Benefits of a combined approach to sampling of renal neoplasms as demonstrated in a series of 351 cases. Am J Surg Pathol 2011; 35: 827–35. doi: 10.1097/PAS.0b013e31821920c8 [DOI] [PubMed] [Google Scholar]
- 24.Simpfendorfer C, Herts BR, Motta-Ramirez GA, Lockwood DS, Zhou M, Leiber M, et al. Angiomyolipoma with minimal fat on MDCT: can counts of negative-attenuation pixels aid diagnosis? AJR Am J Roentgenol 2009; 192: 438–43. doi: 10.2214/AJR.08.1180 [DOI] [PubMed] [Google Scholar]
- 25.Kim JY, Kim JK, Kim N, Cho KS. CT histogram analysis: differentiation of angiomyolipoma without visible fat from renal cell carcinoma at CT imaging. Radiology 2008; 246: 472–9. doi: 10.1148/radiol.2462061312 [DOI] [PubMed] [Google Scholar]
- 26.Chaudhry HS, Davenport MS, Nieman CM, Ho LM, Neville AM. Histogram analysis of small solid renal masses: differentiating minimal fat angiomyolipoma from renal cell carcinoma. AJR Am J Roentgenol 2012; 198: 377–83. doi: 10.2214/AJR.11.6887 [DOI] [PubMed] [Google Scholar]
- 27.Catalano OA, Samir AE, Sahani DV, Hahn PF. Pixel distribution analysis: can it be used to distinguish clear cell carcinomas from angiomyolipomas with minimal fat? Radiology 2008; 247: 738–46. doi: 10.1148/radiol.2473070785 [DOI] [PubMed] [Google Scholar]
- 28.Richmond L, Atri M, Sherman C, Sharir S. Renal cell carcinoma containing macroscopic fat on CT mimics an angiomyolipoma due to bone metaplasia without macroscopic calcification. Br J Radiol 2010; 83: e179–81. doi: 10.1259/bjr/46452134 [DOI] [PMC free article] [PubMed] [Google Scholar]
- 29.Lesavre A, Correas JM, Merran S, Grenier N, Vieillefond A, Hélénon O. CT of papillary renal cell carcinomas with cholesterol necrosis mimicking angiomyolipomas. AJR Am J Roentgenol 2003; 181: 143–5. doi: 10.2214/ajr.181.1.1810143 [DOI] [PubMed] [Google Scholar]
- 30.Strotzer M, Lehner KB, Becker K. Detection of fat in a renal cell carcinoma mimicking angiomyolipoma. Radiology 1993; 188: 427–8. doi: 10.1148/radiology.188.2.8327690 [DOI] [PubMed] [Google Scholar]
- 31.Wile GE, Leyendecker JR, Krehbiel KA, Dyer RB, Zagoria RJ. CT and MR imaging after imaging-guided thermal ablation of renal neoplasms. Radiographics 2007; 27: 325–39. doi: 10.1148/rg.272065083 [DOI] [PubMed] [Google Scholar]
- 32.Israel GM, Bosniak MA. How I do it: evaluating renal masses. Radiology 2005; 236: 441–50. doi: 10.1148/radiol.2362040218 [DOI] [PubMed] [Google Scholar]
- 33.Silverman SG, Israel GM, Trinh QD. Incompletely characterized incidental renal masses: emerging data support conservative management. Radiology 2015; 275: 28–42. doi: 10.1148/radiol.14141144 [DOI] [PubMed] [Google Scholar]
- 34.Patel J, Davenport MS, Khalatbari S, Cohan RH, Ellis JH, Platt JF. In vivo predictors of renal cyst pseudoenhancement at 120 kVp. AJR Am J Roentgenol 2014; 202: 336–42. doi: 10.2214/AJR.13.10915 [DOI] [PMC free article] [PubMed] [Google Scholar]
- 35.Al Harbi F, Tabatabaeefar L, Jewett MA, Finelli A, O’Malley M, Atri M. Enhancement threshold of small (< 4 cm) solid renal masses on CT. AJR Am J Roentgenol 2016; 206: 554–8. doi: 10.2214/AJR.15.14806 [DOI] [PubMed] [Google Scholar]
- 36.Mileto A, Nelson RC, Samei E, Jaffe TA, Paulson EK, Barina A, et al. Impact of dual-energy multi-detector row CT with virtual monochromatic imaging on renal cyst pseudoenhancement: in vitro and in vivo study. Radiology 2014; 272: 767–76. doi: 10.1148/radiol.14132856 [DOI] [PubMed] [Google Scholar]
- 37.Marin D, Davis D, Roy Choudhury K, Patel B, Gupta RT, Mileto A, et al. Characterization of small focal renal lesions: diagnostic accuracy with single-phase contrast-enhanced dual-energy CT with material attenuation analysis compared with conventional attenuation measurements. Radiology 2017; 284: 737–47. doi: 10.1148/radiol.2017161872 [DOI] [PubMed] [Google Scholar]
- 38.Kaza RK, Caoili EM, Cohan RH, Platt JF. Distinguishing enhancing from nonenhancing renal lesions with fast kilovoltage-switching dual-energy CT. AJR Am J Roentgenol 2011; 197: 1375–81. doi: 10.2214/AJR.11.6812 [DOI] [PubMed] [Google Scholar]
- 39.Mileto A, Marin D, Ramirez-Giraldo JC, Scribano E, Krauss B, Mazziotti S, et al. Accuracy of contrast-enhanced dual-energy MDCT for the assessment of iodine uptake in renal lesions. AJR Am J Roentgenol 2014; 202: W466–74. doi: 10.2214/AJR.13.11450 [DOI] [PubMed] [Google Scholar]
- 40.Ascenti G, Mileto A, Krauss B, Gaeta M, Blandino A, Scribano E, et al. Distinguishing enhancing from nonenhancing renal masses with dual-source dual-energy CT: iodine quantification versus standard enhancement measurements. Eur Radiol 2013; 23: 2288–95. doi: 10.1007/s00330-013-2811-4 [DOI] [PubMed] [Google Scholar]
- 41.Cha D, Kim CK, Park JJ, Park BK. Evaluation of hyperdense renal lesions incidentally detected on single-phase post-contrast CT using dual-energy CT. Br J Radiol 2016; 89: 20150860. doi: 10.1259/bjr.20150860 [DOI] [PMC free article] [PubMed] [Google Scholar]
- 42.Mileto A, Allen BC, Pietryga JA, Farjat AE, Zarzour JG, Bellini D, et al. Characterization of incidental renal mass with dual-energy CT: diagnostic accuracy of effective atomic number maps for discriminating nonenhancing cysts from enhancing masses. AJR Am J Roentgenol 2017; 209: W221–W230. doi: 10.2214/AJR.16.17325 [DOI] [PubMed] [Google Scholar]
- 43.Liu X, Zhou J, Zeng MS, Ma Z, Ding Y. Homogeneous high attenuation renal cysts and solid masses-differentiation with single phase dual energy computed tomography. Clin Radiol 2013; 68: e198–205. doi: 10.1016/j.crad.2012.11.008 [DOI] [PubMed] [Google Scholar]
- 44.Mileto A, Sofue K, Marin D. Imaging the renal lesion with dual-energy multidetector CT and multi-energy applications in clinical practice: what can it truly do for you? Eur Radiol 2016; 26: 3677–90. doi: 10.1007/s00330-015-4180-7 [DOI] [PubMed] [Google Scholar]
- 45.Kim JI, Cho JY, Moon KC, Lee HJ, Kim SH. Segmental enhancement inversion at biphasic multidetector CT: characteristic finding of small renal oncocytoma. Radiology 2009; 252: 441–8. doi: 10.1148/radiol.2522081180 [DOI] [PubMed] [Google Scholar]
- 46.Woo S, Cho JY, Kim SH, Kim SY. Comparison of segmental enhancement inversion on biphasic MDCT between small renal oncocytomas and chromophobe renal cell carcinomas. AJR Am J Roentgenol 2013; 201: 598–604. doi: 10.2214/AJR.12.10372 [DOI] [PubMed] [Google Scholar]
- 47.O’Malley ME, Tran P, Hanbidge A, Rogalla P. Small renal oncocytomas: is segmental enhancement inversion a characteristic finding at biphasic MDCT? AJR Am J Roentgenol 2012; 199: 1312–5. doi: 10.2214/AJR.12.8616 [DOI] [PubMed] [Google Scholar]
- 48.McGahan JP, Lamba R, Fisher J, Starshak P, Ramsamooj R, Fitzgerald E, et al. Is segmental enhancement inversion on enhanced biphasic MDCT a reliable sign for the noninvasive diagnosis of renal oncocytomas? AJR Am J Roentgenol 2011; 197: W674–9. doi: 10.2214/AJR.11.6463 [DOI] [PubMed] [Google Scholar]
- 49.Rosenkrantz AB, Hindman N, Fitzgerald EF, Niver BE, Melamed J, Babb JS. MRI features of renal oncocytoma and chromophobe renal cell carcinoma. AJR Am J Roentgenol 2010; 195: W421–7. doi: 10.2214/AJR.10.4718 [DOI] [PubMed] [Google Scholar]
- 50.Young JR, Margolis D, Sauk S, Pantuck AJ, Sayre J, Raman SS. Clear cell renal cell carcinoma: discrimination from other renal cell carcinoma subtypes and oncocytoma at multiphasic multidetector CT. Radiology 2013; 267: 444–53. doi: 10.1148/radiol.13112617 [DOI] [PubMed] [Google Scholar]
- 51.Kim JK, Park SY, Shon JH, Cho KS. Angiomyolipoma with minimal fat: differentiation from renal cell carcinoma at biphasic helical CT. Radiology 2004; 230: 677–84. doi: 10.1148/radiol.2303030003 [DOI] [PubMed] [Google Scholar]
- 52.Takahashi N, Leng S, Kitajima K, Gomez-Cardona D, Thapa P, Carter RE, et al. Small (< 4 cm) renal masses: differentiation of angiomyolipoma without visible fat from renal cell carcinoma using unenhanced and contrast-enhanced CT. AJR Am J Roentgenol 2015; 205: 1194–202. doi: 10.2214/AJR.14.14183 [DOI] [PubMed] [Google Scholar]
- 53.Jinzaki M, Tanimoto A, Narimatsu Y, Ohkuma K, Kurata T, Shinmoto H, et al. Angiomyolipoma: imaging findings in lesions with minimal fat. Radiology 1997; 205: 497–502. doi: 10.1148/radiology.205.2.9356635 [DOI] [PubMed] [Google Scholar]
- 54.Ruppert-Kohlmayr AJ, Uggowitzer M, Meissnitzer T, Ruppert G. Differentiation of renal clear cell carcinoma and renal papillary carcinoma using quantitative CT enhancement parameters. AJR Am J Roentgenol 2004; 183: 1387–91. doi: 10.2214/ajr.183.5.1831387 [DOI] [PubMed] [Google Scholar]
- 55.Lee-Felker SA, Felker ER, Tan N, Margolis DJ, Young JR, Sayre J, et al. Qualitative and quantitative MDCT features for differentiating clear cell renal cell carcinoma from other solid renal cortical masses. AJR Am J Roentgenol 2014; 203: W516–24. doi: 10.2214/AJR.14.12460 [DOI] [PubMed] [Google Scholar]
- 56.Egbert ND, Caoili EM, Cohan RH, Davenport MS, Francis IR, Kunju LP, et al. Differentiation of papillary renal cell carcinoma subtypes on CT and MRI. AJR Am J Roentgenol 2013; 201: 347–55. doi: 10.2214/AJR.12.9451 [DOI] [PubMed] [Google Scholar]
- 57.Sun MR, Ngo L, Genega EM, Atkins MB, Finn ME, Rofsky NM, et al. Renal cell carcinoma: dynamic contrast-enhanced MR imaging for differentiation of tumor subtypes-correlation with pathologic findings. Radiology 2009; 250: 793–802. doi: 10.1148/radiol.2503080995 [DOI] [PubMed] [Google Scholar]
- 58.Israel GM, Hindman N, Hecht E, Krinsky G. The use of opposed-phase chemical shift MRI in the diagnosis of renal angiomyolipomas. AJR Am J Roentgenol 2005; 184: 1868–72. doi: 10.2214/ajr.184.6.01841868 [DOI] [PubMed] [Google Scholar]
- 59.Hindman N, Ngo L, Genega EM, Melamed J, Wei J, Braza JM, et al. Angiomyolipoma with minimal fat: can it be differentiated from clear cell renal cell carcinoma by using standard MR techniques? Radiology 2012; 265: 468–77. doi: 10.1148/radiol.12112087 [DOI] [PMC free article] [PubMed] [Google Scholar]
- 60.Outwater EK, Bhatia M, Siegelman ES, Burke MA, Mitchell DG. Lipid in renal clear cell carcinoma: detection on opposed-phase gradient-echo MR images. Radiology 1997; 205: 103–7. doi: 10.1148/radiology.205.1.9314970 [DOI] [PubMed] [Google Scholar]
- 61.Ho VB, Allen SF, Hood MN, Choyke PL. Renal masses: quantitative assessment of enhancement with dynamic MR imaging. Radiology 2002; 224: 695–700. doi: 10.1148/radiol.2243011048 [DOI] [PubMed] [Google Scholar]
- 62.Hecht EM, Israel GM, Krinsky GA, Hahn WY, Kim DC, Belitskaya-Levy I, et al. Renal masses: quantitative analysis of enhancement with signal intensity measurements versus qualitative analysis of enhancement with image subtraction for diagnosing malignancy at MR imaging. Radiology 2004; 232: 373–8. doi: 10.1148/radiol.2322031209 [DOI] [PubMed] [Google Scholar]
- 63.Dilauro M, Quon M, McInnes MD, Vakili M, Chung A, Flood TA, et al. Comparison of contrast-enhanced multiphase renal protocol CT versus MRI for diagnosis of papillary renal cell carcinoma. AJR Am J Roentgenol 2016; 206: 319–25. doi: 10.2214/AJR.15.14932 [DOI] [PubMed] [Google Scholar]
- 64.Campbell N, Rosenkrantz AB, Pedrosa I. MRI phenotype in renal cancer: is it clinically relevant? Top Magn Reson Imaging 2014; 23: 95–115. doi: 10.1097/RMR.0000000000000019 [DOI] [PMC free article] [PubMed] [Google Scholar]
- 65.Oliva MR, Glickman JN, Zou KH, Teo SY, Mortelé KJ, Rocha MS, et al. Renal cell carcinoma: t1 and t2 signal intensity characteristics of papillary and clear cell types correlated with pathology. AJR Am J Roentgenol 2009; 192: 1524–30. doi: 10.2214/AJR.08.1727 [DOI] [PubMed] [Google Scholar]
- 66.Murray CA, Quon M, McInnes MD, van der Pol CB, Hakim SW, Flood TA, et al. Evaluation of T1-weighted MRI to detect intratumoral hemorrhage within papillary renal cell carcinoma as a feature differentiating from angiomyolipoma without visible fat. AJR Am J Roentgenol 2016; 207: 585–91. doi: 10.2214/AJR.16.16062 [DOI] [PubMed] [Google Scholar]
- 67.Childs DD, Clingan MJ, Zagoria RJ, Sirintrapun J, Tangtiang K, Anderson A, et al. In-phase signal intensity loss in solid renal masses on dual-echo gradient-echo MRI: association with malignancy and pathologic classification. AJR Am J Roentgenol 2014; 203: W421–8. doi: 10.2214/AJR.13.11113 [DOI] [PubMed] [Google Scholar]
- 68.Yoshimitsu K, Kakihara D, Irie H, Tajima T, Nishie A, Asayama Y, et al. Papillary renal carcinoma: diagnostic approach by chemical shift gradient-echo and echo-planar MR imaging. J Magn Reson Imaging 2006; 23: 339–44. doi: 10.1002/jmri.20509 [DOI] [PubMed] [Google Scholar]
- 69.Jinzaki M, Silverman SG, Akita H, Nagashima Y, Mikami S, Oya M. Renal angiomyolipoma: a radiological classification and update on recent developments in diagnosis and management. Abdom Imaging 2014; 39: 588–604. doi: 10.1007/s00261-014-0083-3 [DOI] [PMC free article] [PubMed] [Google Scholar]
- 70.Hakim SW, Schieda N, Hodgdon T, McInnes MD, Dilauro M, Flood TA. Angiomyolipoma (AML) without visible fat: ultrasound, CT and MR imaging features with pathological correlation. Eur Radiol 2016; 26: 592–600. doi: 10.1007/s00330-015-3851-8 [DOI] [PubMed] [Google Scholar]
- 71.Sasiwimonphan K, Takahashi N, Leibovich BC, Carter RE, Atwell TD, Kawashima A. Small (<4 cm) renal mass: differentiation of angiomyolipoma without visible fat from renal cell carcinoma utilizing MR imaging. Radiology 2012; 263: 160–8. doi: 10.1148/radiol.12111205 [DOI] [PubMed] [Google Scholar]
- 72.Taouli B, Thakur RK, Mannelli L, Babb JS, Kim S, Hecht EM, et al. Renal lesions: characterization with diffusion-weighted imaging versus contrast-enhanced MR imaging. Radiology 2009; 251: 398–407. doi: 10.1148/radiol.2512080880 [DOI] [PubMed] [Google Scholar]
- 73.Wang H, Cheng L, Zhang X, Wang D, Guo A, Gao Y, et al. Renal cell carcinoma: diffusion-weighted MR imaging for subtype differentiation at 3.0 T. Radiology 2010; 257: 135–43. doi: 10.1148/radiol.10092396 [DOI] [PubMed] [Google Scholar]
- 74.Yu X, Lin M, Ouyang H, Zhou C, Zhang H. Application of ADC measurement in characterization of renal cell carcinomas with different pathological types and grades by 3.0T diffusion-weighted MRI. Eur J Radiol 2012; 81: 3061–6. doi: 10.1016/j.ejrad.2012.04.028 [DOI] [PubMed] [Google Scholar]
- 75.Rosenkrantz AB, Niver BE, Fitzgerald EF, Babb JS, Chandarana H, Melamed J. Utility of the apparent diffusion coefficient for distinguishing clear cell renal cell carcinoma of low and high nuclear grade. AJR Am J Roentgenol 2010; 195: W344–51. doi: 10.2214/AJR.10.4688 [DOI] [PubMed] [Google Scholar]
- 76.Kutikov A, Fossett LK, Ramchandani P, Tomaszewski JE, Siegelman ES, Banner MP, et al. Incidence of benign pathologic findings at partial nephrectomy for solitary renal mass presumed to be renal cell carcinoma on preoperative imaging. Urology 2006; 68: 737–40. doi: 10.1016/j.urology.2006.04.011 [DOI] [PubMed] [Google Scholar]
- 77.Herts BR, Silverman SG, Hindman NM, Uzzo RG, Hartman RP, Israel GM, et al. Management of the incidental renal mass on CT: a white paper of the ACR incidental findings committee. J Am Coll Radiol 2018; 15: 264-273. doi: 10.1016/j.jacr.2017.04.028 [DOI] [PubMed] [Google Scholar]
- 78.Finelli A, Ismaila N, Bro B, Durack J, Eggener S, Evans A, et al. Management of small renal masses: american society of clinical oncology clinical practice guideline. J Clin Oncol 2017; 35: 668–80. doi: 10.1200/JCO.2016.69.9645 [DOI] [PubMed] [Google Scholar]
- 79.Pandharipande PV, Gervais DA, Hartman RI, Harisinghani MG, Feldman AS, Mueller PR, et al. Renal mass biopsy to guide treatment decisions for small incidental renal tumors: a cost-effectiveness analysis. Radiology 2010; 256: 836–46. doi: 10.1148/radiol.10092013 [DOI] [PMC free article] [PubMed] [Google Scholar]
- 80.Heilbrun ME, Yu J, Smith KJ, Dechet CB, Zagoria RJ, Roberts MS. The cost- effectiveness of immediate treatment, percutaneous biopsy and active surveillance for the diagnosis of the small solid renal mass: evidence from a Markov model. J Urol 2012; 187: 39–43. doi: 10.1016/j.juro.2011.09.055 [DOI] [PubMed] [Google Scholar]
- 81.Leveridge MJ, Finelli A, Kachura JR, Evans A, Chung H, Shiff DA, et al. Outcomes of small renal mass needle core biopsy, nondiagnostic percutaneous biopsy, and the role of repeat biopsy. Eur Urol 2011; 60: 578–84. doi: 10.1016/j.eururo.2011.06.021 [DOI] [PubMed] [Google Scholar]
- 82.Yusenko MV. Molecular pathology of renal oncocytoma: a review. Int J Urol 2010; 17: 602–12. doi: 10.1111/j.1442-2042.2010.02574.x [DOI] [PubMed] [Google Scholar]
- 83.Harris CR, Whitson JM, Meng MV. Under-grading of <4 cm renal masses on renal biopsy. BJU Int 2012; 110: 794–7. doi: 10.1111/j.1464-410X.2012.10944.x [DOI] [PubMed] [Google Scholar]


