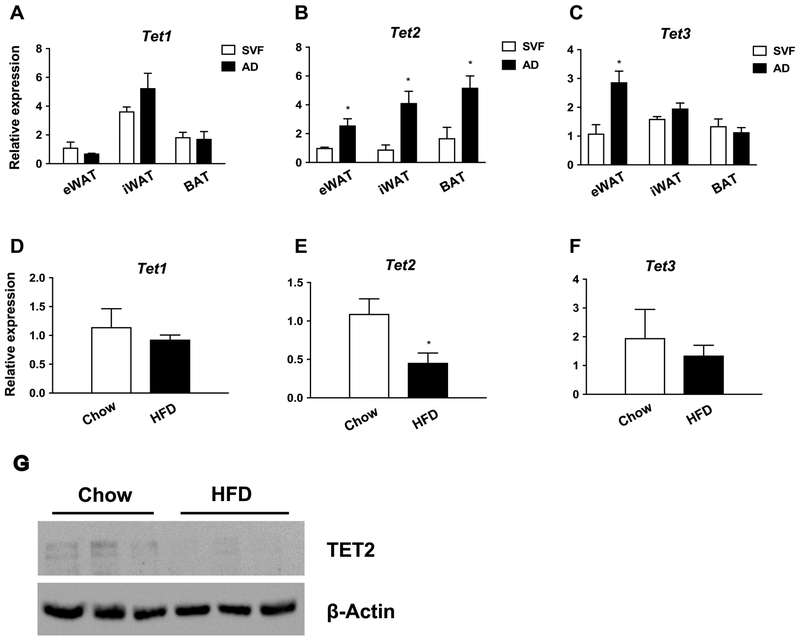
Figure 1. Tet2 expression is enriched in adipocytes, and adipocyte Tet2 levels are reduced in obesity.
(A-C) Tet expression was measured by q-PCR in the stromal vascular fraction (SVF) and adipose fraction (AD) of the eWAT, iWAT, and BAT of chow-fed C57BI/6 mice (n= 3, p < 0.05, Student’s t-test, mean ± s.e.m.); (D-F) Tet expression in fractionated adipocytes from chow- and high fat diet–fed (HFD) C57Bl/6 mice (n = 3, p < 0.05, Student’s t-test, mean ± s.e.m.); (G) Western blot showing TET2 protein levels in fractionated adipocytes from chow vs. HFD mice. eWAT: epididymal WAT; iWAT: inguinal WAT; BAT: brown adipose tissue.

