

SUMMARY
Clear cell renal cell carcinoma (ccRCC) is the most common form of human kidney cancer. Histological and molecular analyses suggest that ccRCCs have significantly altered metabolism. Recent human studies of lung cancer and intracranial malignancies demonstrated an unexpected preservation of carbohydrate oxidation in the tricarboxylic acid (TCA) cycle. To test the capacity of ccRCC to oxidize substrates in the TCA cycle, we infused 13C-labeled fuels in ccRCC patients and compared labeling patterns in tumors and adjacent kidney. After infusion with [U-13C]glucose, ccRCCs displayed enhanced glycolytic intermediate labeling, suppressed pyruvate dehydrogenase flow, and reduced TCA cycle labeling, consistent with the Warburg effect. Comparing 13C labeling among ccRCC, brain, and lung tumors revealed striking differences. Primary ccRCC tumors demonstrated the highest enrichment in glycolytic intermediates and lowest enrichment in TCA cycle intermediates. Among human tumors analyzed by intraoperative 13C infusions, ccRCC is the first to demonstrate a convincing shift towards glycolytic metabolism.
INTRODUCTION
The most extensively studied metabolic alteration in cancer cells is the Warburg effect, the intrinsic propensity to oxidize glucose incompletely in the presence of oxygen and favor the conversion of glucose to lactate in malignant tissues (Warburg, 1956; Warburg et al., 1924). Indeed, many human tumors display enhanced glucose uptake relative to adjacent tissue in vivo, which makes it possible to image tumors via 18-fluoro-2-deoxyglucose positron emission tomography (FDG-PET) (Lee et al., 2017; Wang et al., 2012). Several recent studies using intra-operative infusion of [U-13C]glucose in human subjects with FDG-PET-positive tumors in the brain and lung have revealed robust glucose oxidation, sometimes in excess of adjacent tissue (Fan et al., 2009; Hensley et al., 2016; Maher et al., 2012; Sellers et al., 2015). These reports indicate an uncoupling between high rates of glucose uptake and suppressed glucose oxidation, suggesting that the tricarboxylic acid (TCA) cycle retains its ability to produce energy via oxidative metabolism in aggressive tumors. Other studies have highlighted the role of alternative respiratory fuels, including acetate and lactate, in complementing glucose oxidation to support biomass and energy production in living tumors (Faubert et al., 2017; Hensley et al., 2016; Hui et al., 2017; Kennedy et al., 2013; Mashimo et al., 2014).
Metabolic alterations are especially prominent in kidney cancer, specifically clear cell renal cell carcinoma (ccRCC), the most common and most frequently lethal subtype of human renal cancer. ccRCC accounts for approximately 75% of diagnosed primary kidney tumors (Hakimi et al., 2016) and an estimated 83–88% of metastatic renal cancer cases (Hsieh et al., 2017). The major genetic driver in ccRCC is loss of the von Hippel-Lindau (VHL) tumor suppressor gene through somatic mutations, epigenetic silencing or loss of heterozygosity. VHL encodes an E3 ubiquitin ligase that normally targets hypoxia inducible factor α (HIFα) proteins for degradation under conditions of normal oxygen tension. Suppression of VHL activity under hypoxia allows HIFα subunits to accumulate. Consequently, loss of VHL leads to a pseudo-hypoxic state in the cell stemming from aberrant accumulation of HIF-1α and −2α (Hsieh et al., 2017), and HIFα transcriptionally controlled downstream pathways are permutated. Many of these pathways—glycolysis, fatty acid synthesis, glycogen synthesis—are metabolic in nature (Benita et al., 2009; Semenza, 2013).
Because of these extensive metabolic changes, ccRCC has been described as a “disease of cell metabolism” (Linehan et al., 2010). Several lines of evidence support this characterization. The 2013 TCGA “Kidney Renal Clear Cell Carcinoma” (KIRC) analysis highlighted broad alterations in the transcriptome and proteome related to metabolic enzymes, including many enzymes whose altered protein levels correlated with clinical outcome (Cancer Genome Atlas Research, 2013). Metabolomics analysis from several cohorts comparing ccRCC tissue to adjacent kidney revealed alterations in glycolysis, the TCA cycle, redox homeostasis, one-carbon metabolism and other pathways (Hakimi et al., 2016; Li et al., 2014; Zhang et al., 2017). Overall, these findings in human tumors, coupled with mechanistic studies revealing the effects of VHL loss on metabolism in vitro, suggest that ccRCC may demonstrate a classical Warburg effect in vivo.
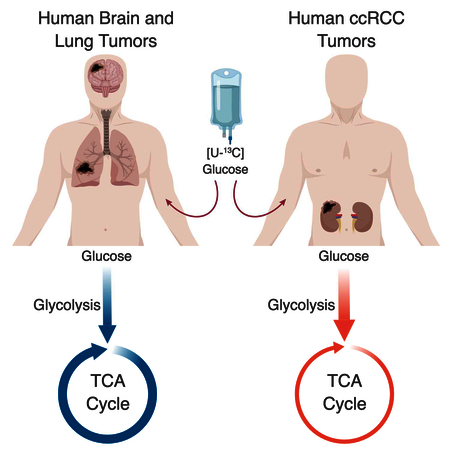
To assess metabolic reprogramming in human ccRCC, we intraoperatively infused [U-13C]glucose into patients with primary ccRCC tumors undergoing nephrectomy or partial nephrectomy. We found evidence of enhanced glycolysis and suppressed glucose oxidation in the tumors compared to matched, adjacent kidney tissue. Furthermore, ccRCC displayed markedly suppressed glucose oxidation when compared to human tumors in the brain or lung, underscoring the apparent prominence of aerobic glycolysis in human ccRCC.
RESULTS AND DISCUSSION
[U-13C]glucose infusions in patients with tumors containing classical ccRCC clinical characteristics
Five patients with ccRCC were intraoperatively infused with [U-13C]glucose (i.e. all six carbons in glucose labeled with 13C) at the time of nephrectomy or partial nephrectomy. We used a similar clinical protocol previously used to analyze human tumors from the brain and lung (Hensley et al., 2016; Maher et al., 2012). The ccRCC tumors differed according to American Joint Committee on Cancer (AJCC) primary tumor staging and had Fuhrman nuclear grades of either 2 or 3 (Figure 1A). Matched adjacent kidney and tumor tissues were removed from each patient (Figure 1B). Characteristic ccRCC imaging and histopathology were verified in all patients (Figure 1C, D). The infusion generated persistent enrichment in plasma glucose in the range of 30–50% (Figure 1E,F). Although we have previously demonstrated that this infusion method can produce complex labeling patterns in human tumors indicative of prolonged 13C exposure (Hensley et al., 2016), it is important to note that persistent enrichment in plasma glucose does not ensure isotopic steady state in the resected tissue. Nevertheless, neither our 1H decoupled 13C NMR nor mass spectrometry analysis assumes isotopic steady state in the tissues. For our mass spectrometry analysis, we normalized enrichment in the tissue metabolites to the steady-state enrichment in plasma glucose. This normalization made it simpler to compare data among the patients despite the steady-state plasma glucose ranging from 30–50%.
Figure 1: Clinical features of infused patients.

(A) Demographic and clinical characteristics of the profiled human clear cell renal cell carcinoma patients. (B) Image of resected kidney from patient RCC3. (C) Pathology section of patient RCC5 exhibiting the ccRCC hallmark of “clear cell” cytoplasm. (D) CT scan of patient RCC2 showing renal mass in left kidney, indicated by arrow. (E) Glucose infusion curves for each patient. (F) Fractional enrichment of glucose in patient blood plasma at the time of tumor resection.
[U-13C]glucose infused ccRCC tumors show differential labeling relative to adjacent kidney
A schematic of labeling from [U-13C]glucose is shown in Figure 2A, and a representative 1H decoupled 13C NMR spectrum of metabolites extracted from a ccRCC tumor is shown in Figure 2B. The ccRCC spectrum is dominated by the carbon 2–3 doublet at the lactate C3 resonance (Figure 2B), as expected for glycolytic tissue. The prominence of lactate signal in the ccRCC spectrum is consistent with previously published reports of high lactate levels in ccRCC tumors (Hakimi et al., 2013; Sudarshan et al., 2013). The prominent 2–3 doublet in alanine C3 is also consistent with anaerobic glucose metabolism, when pyruvate is converted to alanine through a transamination reaction catalyzed by alanine aminotransferase (ALT) (Figure 2B). Other features in the ccRCC spectrum include a small C4–5 doublet in glutamate C4 (i.e. Glu4D45; Figure 2B inset). This doublet arises from the PDH-dependent production of [1,2-13C]acetyl-CoA followed by entry of this acetyl-CoA into the TCA cycle and conversion to [4,5-13C]α-ketoglutarate and [4,5-13C]glutamate (Figure 2A). Some spectra revealed small quartets in glutamate C4 (Glu4Q); this feature arises when [4,5-13C]α-ketoglutarate proceeds around the TCA cycle to oxaloacetate, followed by condensation with [1,2-13C]acetyl-CoA and conversion to [3,4,5-13C]α-ketoglutarate and [3,4,5-13C]glutamate. The ratio of the GluQ to GluD45 provides a surrogate for enrichment in the acetyl-CoA pool used to supply the TCA cycle. The estimated acetyl-CoA enrichment in tumors infused with [U-13C]glucose was less than 5% (Figure 2C), consistent with low levels of PDH activity in the tumors. In contrast, glioblastoma tumors had an average fractional enrichment of 11% in the acetyl CoA pool when infused with [U-13C]glucose (Maher et al., 2012). Despite detectable multiplets in glutamate C3 and C4, essentially no label was detected in glutamine, indicating a paucity of glutamine synthetase activity in the tumors, another marked difference from human tumors in the brain (Maher et al., 2012).
Figure 2: In vivo labeling from ccRCC tumors and adjacent kidney infused with [U-13C]glucose.

(A) Schematic for metabolism of [U-13C]glucose. “Labeled” 13C carbons are colored circles and “unlabeled” 12C carbons are white circles. Labeling in the first turn of the TCA cycle are blue circles. Labeling in the second turn of the TCA cycle are light blue circles. The positional carbons notated on the NMR spectrum are labeled in the metabolites glutamate and lactate. (B) Representative 1H-decoupled 13C NMR tumor spectrum from patient RCC2. The inset is a magnification of the peaks from glutamate (Glu) at carbon 4 (C4). The number after the indicated metabolite refers to the carbon position in the metabolite. D45 refers to the doublet formed from glutamate labeled at both C4 and C5. Q refers to the quartet formed from glutamate labeled at C3, C4, and C5. Glu = Glutamate, Gln = Glutamine, Glu = Glutamate, Lac = Lactate, Ala = Alanine. (C) Fractional enrichment of labeled acetyl CoA from each patient calculated from glutamate labeling on NMR. The Acetyl CoA fractional enrichment from glioblastoma (GBM) patients published by Maher et al 2012., is shown for comparison. (D) Total labeling of indicated metabolite as analyzed by mass spectrometry and normalized to 13C Glucose enrichment in patient plasma. A full isotopologue distribution is provided in Supplemental Table 1. P values: ns = P > 0.05; * =P ≤ 0.05; ** = P ≤ 0.01; *** = P ≤ 0.001; **** = P ≤ 0.0001. Unpaired t tests were used in panel D, and the data is shown as mean ± standard deviation
Mass spectrometry analysis of the same samples provided a broader view of metabolite labeling. Mass spectrometry was used to analyze metabolism in both the tumors and adjacent kidney. For this analysis, we considered all labeled forms of each metabolite together (i.e. [1.0-(m+0)]), and normalized this overall enrichment value to plasma glucose enrichment from the corresponding patient at the time of resection. Complete analysis of all isotopologues from each tissue fragment is in Supplemental Table 1. Labeling of all measured glycolytic intermediates in the tumors exceeded labeling in adjacent kidney, whereas labeling of metabolites related to the TCA cycle was generally suppressed (Figure 2D). This analysis indicates that human primary ccRCCs have prominent glycolytic metabolism in vivo, but that labeling of TCA cycle intermediates is suppressed, consistent with low activity of PDH and glucose oxidation.
Primary human ccRCC tumors are metabolically distinct from human tumors in the brain and lung
Previous studies published by our group have shown that primary brain tumors (anaplastic ependymoma, anaplastic astrocytomas and glioblastomas), brain metastases and primary non-small cell lung cancers (NSCLC) (mostly adenocarcinoma), have significant levels of glucose oxidation (Hensley et al., 2016; Maher et al., 2012). These patients were studied using a similar [U-13C]glucose infusion protocol to the one employed here in ccRCC. As a result, they provide an opportunity to compare metabolism among these three anatomic locations. We used previously reported mass spectrometry analysis from 31 non-small cell lung cancer patients (Faubert et al., 2017; Hensley et al., 2016), and performed new mass spectrometry analysis on samples from five brain tumor patients (primary and metastatic lesions; see Supplemental Tables 2 and 3) previously analyzed only by NMR (Maher et al., 2012). The ccRCC tumors contained markedly enhanced relative enrichment of 3-phosphoglyerate, pyruvate and lactate relative to both the brain and lung tumors (Figure 3A, 3B). For 3-phosphoglycerate and pyruvate, the enrichment normalized to plasma glucose was approximately twice as high in ccRCC (Figure 3A). Lung and brain tumors were similar to each other by this labeling metric. In terms of relative labeling of TCA cycle intermediates from [U-13C]glucose, tumors in the brain had the highest enrichment and primary ccRCC had the lowest, while lung tumors had an intermediate labeling phenotype (Figure 3A). To better visualize labeling differences between glycolytic and TCA cycle intermediates among these tumors, labeling in all metabolites was normalized to 3-phosphoglycerate (Figure 3B). In ccRCC, but not in brain or lung tumors, this analysis revealed a sharp decline in labeling between pyruvate and citrate, consistent with reduced contribution of glucose to the TCA cycle in ccRCC.
Figure 3: Glucose labeling profiles of tumors from the brain, kidney, and lung.

(A) Total labeling of each metabolite normalized to 13C-Glucose enrichment in plasma. (B) Total labeling mean of metabolites indicated in panel A divided by the 3-PG total labeling mean. 3-PG means are 33.94% for brain, 40.56% for lung, 73.96% for kidney tumors. (C) Schematic illustrating labeling in citrate from [U-13C]glucose via pyruvate dehydrogenase (PDH) and pyruvate carboxylase (PC) in the first turn of the TCA cycle. (D) PDH and PC activity. Citrate m+2/pyruvate m+3 ratio can be a surrogate for PDH while the citrate m+3/pyruvate m+3 ratio can be a surrogate for PC. (E) Lactate/3-phosphoglycerate (Lactate/3-PG) ratios for adjacent kidney, ccRCC tumors, brain tumors and lung tumors. Lung tumors shown to utilize lactate had lactate/3-PG ratios above 1.5 (Faubert et al., 2017). P values: ns = P > 0.05; * =P ≤ 0.05; ** = P ≤ 0.01; *** = P ≤ 0.001; **** = P ≤ 0.0001. Statistical tests of two way ANOVA with Tukey posthoc test was used in 3A, unpaired t tests were used in 3D, and ordinary one way ANOVA was used in 3E. The data is shown as mean ± standard deviation
We next examined the isotopologue distribution in citrate to obtain a more granular view of TCA cycle activity in the tumors. A schematic showing the contribution of [U-13C]glucose derived pyruvate to the TCA cycle through either pyruvate carboxylase (PC) or pyruvate dehydrogenase (PDH) is shown in Figure 3C. The citrate m+2/pyruvate m+3 ratio can serve as a surrogate for PDH while the citrate m+3/pyruvate m+3 ratio can be a surrogate for PC (Comte et al., 1997; Panchal et al., 2000). Both of these ratios are reduced in the ccRCC tumors compared to adjacent kidney (Figure 3D), indicating reduced contribution of glucose-derived carbon to the TCA cycle via both PDH and PC.
Our findings support the hypothesis that decreased PDH activity in ccRCC leads to suppressed glucose oxidation. Carbon flow into the TCA cycle is determined in large part by activity of the PDH complex, which is regulated by inhibitory phosphorylation via PDH kinases (PDKs). In cell culture models, PDK1 is a transcriptional target of HIF1α and its expression is enhanced upon VHL loss (Kim et al., 2006; Papandreou et al., 2006). Expression of PDK1 and suppression of PDH is predicted to result in reduced enrichment of the citrate m+2 isotopologue compared to pyruvate m+3 as shown in Figure 3D, and subsequent decrease in glucose derived intermediates contributing to the TCA cycle.
Several papers have recently reported the use of lactate from the plasma as a fuel for tumors (Faubert et al., 2017; Hensley et al., 2016; Hui et al., 2017; Kennedy et al., 2013). Direct evidence for lactate utilization by human lung tumors was observed after intra-operative infusions with 13C-lactate (Faubert et al., 2017). Although we did not infuse 13C-lactate into patients with ccRCC or brain tumors, we did examine the ratio of labeling in lactate to 3-phosphoglycerate (lactate/3-PG) during infusions with [U-13C]glucose, because this ratio may provide a surrogate for entry of plasma lactate. If [U-13C]glucose is converted to [U-13C]lactate outside the tumor, this labeled lactate can enter the circulation and eventually contribute to 13C labeling in tumor lactate and other metabolites. As a result, lactate/3-PG labeling ratios above 1.0 are consistent with entry of 13C-lactate from the circulation. While lactate/3-PG ratios are an imperfect marker of the ability of tumors and tissues to use lactate, and ratios of ~1.0 do not rule out lactate utilization (Faubert et al., 2017; Hui et al., 2017), a subset of human lung tumors have ratios exceeding 1.5. In brain tumors, the ratio was heterogeneous but had an average lactate/3-PG ratio of approximately 2.0, strongly suggesting that these tumors metabolize lactate as a carbon source. ccRCC tumors had an average ratio lower than the normal kidney tissue, 1.13 and 1.31 respectively (Figure 3E), arguing against robust import of extracellular lactate by ccRCC tumors. These data indicate that lactate may provide a fuel for human tumors in the brain, but is unlikely to be a prominent fuel in ccRCC.
[1,2-13C]Acetate infusion in ccRCC shows evidence for low TCA cycle turnover
We also infused one ccRCC patient with [1,2-13C]acetate (Figure 4A). The rationale for this infusion was two-fold. First, acetate can be used as a fuel when glucose contribution to acetyl-CoA is sub-maximal in human tumors (Mashimo et al., 2014). Acetate is converted to acetyl-CoA by acetyl-CoA synthetases, and then may contribute to the TCA cycle, lipogenesis, and other metabolic processes (Comerford et al., 2014; Mashimo et al., 2014; Schug et al., 2015). Second, any delivery of acetate-derived acetyl-CoA to the TCA cycle would provide a complementary view of cycle turnover independent of reduced PDH activity (Figure 4B). [1,2-13C]acetate infusion of the single patient achieved high enrichment in the acetyl-CoA pool and excellent signal of [4,5-13C]glutamate by NMR. This indicates that this tumor took up acetate, converted it to acetyl-CoA, and used it to supply the first segment of the TCA cycle. Areas from these multiplets allowed us to estimate that 34% of acetyl-CoA was labeled in this tumor (Malloy et al., 1990). However, production of [3,4,5-13C]glutamate, which results from retention of 13C in TCA cycle intermediates past the first complete turn of the TCA cycle, was still small (Figure 4C). Combining the stable isotope labeling data presented here with the ccRCC metabolite levels reported in a previous study (Hakimi et al., 2016) suggests that overall TCA cycle turnover is low in this tumor, and/or that the cycle includes a large anaplerotic flux from an unlabeled carbon source which would dilute labeling in TCA cycle intermediates. Either of these hypotheses is interesting in the context of ccRCC. The human ccRCC TCGA study (KIRC) indicates that reduced expression of TCA cycle enzymes correlated with poor clinical outcomes, also suggesting that aggressive tumors down-regulate mechanisms for fuel oxidation (Cancer Genome Atlas Research, 2013). It is important to emphasize that only one patient with ccRCC was infused with [1,2-13C]acetate. Additional infusions are needed to assess the generalizability of these findings.
Figure 4: In vivo labeling of a ccRCC tumor from [1,2-13C]acetate.

(A) Demographic and clinical characteristics of a ccRCC patient infused with [1,2-13C]acetate. (B) Schematic showing how acetate infusion bypasses PDH. (C) 1H-decoupled 13C NMR spectrum from the acetate infused tumor. The inset is a magnification of the peaks from glutamate (Glu) at carbon 4 (C4). D45 refers to the doublet formed from glutamate labeled at both C4 and C5. Q refers to the quartet formed from glutamate labeled at C3, C4, and C5. The quartet forms after a turn of the TCA cycle. The number after the indicated metabolite refers to the carbon position in the metabolite. Glu C4 = Glutamate C4, Gln C4 = Glutamine C4, Glu C3 = Glutamate C3, Lac C3 = Lactate C3
ccRCC is predominantly driven by loss of the tumor suppressor VHL. VHL inactivation through mutation, epigenetic silencing, or loss of heterozygosity occurs in up to 90% of ccRCCs (Moore et al., 2011; Rathmell and Chen, 2008; Turajlic et al., 2018). This results in impaired regulation of HIFα protein stability and chronic transcriptional activation of HIF target genes, many of which regulate metabolism. In cultured cells, the pseudohypoxic state of VHL loss is characterized by heightened glycolysis, suppressed glucose oxidation and increased reductive metabolism of glutamine (Hu et al., 2003; Kim et al., 2006; Metallo et al., 2011; Mullen et al., 2011; Papandreou et al., 2006). Metabolomics in vivo has provided a snapshot of the metabolic phenotype of human ccRCC and revealed broad alterations in metabolite abundance relative to adjacent kidney (Hakimi et al., 2016; Li et al., 2014). However, understanding the dynamic utilization of fuels and metabolite turnover in these tumors requires the use of isotope tracers to assess pathway activity. The work presented here with 13C-glucose and 13C-acetate indicates perturbed glycolysis and TCA cycle activity in primary ccRCC tumors compared to adjacent kidney and to other human tumors in vivo. Specifically, human ccRCC displays enhanced enrichment of glycolytic intermediates and lower labeling of TCA cycle intermediates relative to the adjacent kidney.
To our knowledge, this is the first report of isotope tracing in human ccRCC in vivo. ccRCC tumors exhibit enhanced glycolysis and suppressed PDH activity compared to their matched adjacent kidney tissue, and primary ccRCC tumors seem to have minimal glucose oxidation and turnover of the TCA cycle in vivo. This phenotype is consistent with the classical description of the Warburg effect, once thought to characterize the majority of aggressive tumors. However, in vivo analysis of human primary NSCLCs, primary brain tumors, and brain metastases revealed a surprisingly high degree of oxidation of glucose and other fuels in vivo; in NSCLC, rates of glucose oxidation actually exceeded rates in the adjacent lung. Therefore, these new findings in ccRCC tumors are unique among human tumors analyzed to this point. Primary ccRCC tumors have a distinctive metabolic profile, and these findings are the first to provide strong in vivo evidence for the Warburg effect in human tumors.
Limitations of Study
We do not know if isotopic steady state is reached in target tissues, as this would require sampling at multiple time points during the infusion, which was not feasible in these surgeries. The analytical methods we used here do not require isotopic steady state, and we used plasma glucose enrichment as a means to normalize data amongst patients. It also would have been ideal to compare tumor 13C NMR spectra to adjacent kidney, but obtaining adequate adjacent non-tumor bearing kidney sufficient for a high-quality 13C NMR spectrum (100–400 mg) was challenging.
Additionally, we only infused a single patient with [U-13C]acetate. While this infusion was informative, more [U-13C]acetate infusions of human ccRCC patients are required to make definitive conclusions about the biological contribution of acetate to ccRCC pathophysiology. We also speculate on the utilization of lactate as a fuel for ccRCC and brain tumors based on published surrogate markers in lung cancer (Faubert et al., 2017; Hensley et al., 2016). However, infusing isotope-labeled lactate would be required to understand lactate metabolism in human ccRCC and brain tumors.
METHODS:
CONTACT FOR REAGENT AND RESOURCE SHARING:
Further information and requests for resources and reagents should be directed to and will be fulfilled by the Lead Contact Kevin Courtney (Kevin.Courtney@UTSouthwestern.edu).
EXPERIMENTAL MODEL AND SUBJECT DETAILS:
The project was approved by the Institutional Review Board of UT Southwestern Medical Center (“An Investigation of Tumor Metabolism in Patients Undergoing Surgical Resection” (STU 062010-157). Patients were selected for inclusion based on imaging and clinical features consistent with renal cell carcinoma. Patients were referred for surgery based on standard clinical practice. Patients were excluded if they had a Karnofsky Performance status <70%, NYHA class III or IV congestive heart failure, psychiatric or addictive disorders that precluded obtaining informed consent, unstable angina, or were pregnant or lactating. Clinical details about patients participating in the study and their tumors are summarized in Figure 1A and Supplemental Table 3.
METHOD DETAILS:
Chemicals:
All chemicals and reagents were LC-MS grade or of the highest purity commercially available. Sterile, pyrogen free [U-13C]glucose and [1,2-13C]acetate was purchased from Cambridge Isotope Laboratories and Sigma-Aldrich.
Infusions:
Sterile, pyrogen free [U-13C]glucose or [1,2-13C]acetate was infused at the time of nephrectomy or partial nephrectomy. A peripheral intravenous line was placed on the morning of surgery and labeled glucose or acetate was infused as a bolus of 8g over 10 minutes followed by 8g per hour as a continuous infusion. Standard procedures were followed for tumor resection. Each tumor fragment was immersed in iced saline and gently washed to remove blood and adherent tissue immediately upon removal and were flash frozen in liquid nitrogen. All diagnoses were made by the attending clinical pathologist. These infusion parameters are consistent with previously published work (Faubert et al., 2017; Hensley et al., 2016; Maher et al., 2012; Mashimo et al., 2014).
Pathology:
The attending pathologist or pathology technician selected material for clinical histology. Samples selected for metabolic analysis were adjacent to the tissues used for histology and, by gross exam, had identical features and cellularity as the pathology samples.
NMR Spectroscopy:
The mass of samples for NMR ranged from 150–400 mg. Frozen tumor samples were powdered in a mortar under liquid nitrogen with 4% perchloric acid (1:4, w/v), thawed and centrifuged at 47,800xg for 15 min. The supernatant was transferred to a new tube, where chloroform-tri-n-octylamine (78%:22%, v/v) was added in a 1:2 volumetric ratio to increase the pH to approximately pH 6. The samples were centrifuged at 3300xg for 15min. The aqueous phase was removed and transferred to a microfuge tube, lyophilized and reconstituted in 200 L of deuterium oxide (Cambridge Isotope Laboratories). The pH was adjusted to pH 7.0 with 2–3 L of 1M sodium deuteroxide followed by centrifugation at 18400xg for 1 min. The supernatant was transferred to a 3-mm NMR tube for NMR analysis. All high resolution proton decoupled 13C NMR spectra were obtained on a Bruker Avance HDIII 600MHz using a 10mm TCI cryo probe. The spectra were acquired using 16000 to 23000 scans with a flip angle of 30°, a delay of 1.5 seconds and an acquisition time of 2 seconds. The decoupling was performed using WALTZ-16. The free induction decay was processed and analyzed using Advanced Chemistry Labs (ACD/Labs). After baseline correction, data were zero-filled twice and multiplied by a 0.5–0.8-Hz exponential prior to Fourier transformation. Each peak was fitted with a Gauss-Lorentz function and the area was measured for all peaks within informative multiplets.
Mass Spectrometry:
The mass of samples used for mass spectrometry ranged between 10–30 mg. Frozen tissue fragments were added to 80:20 methanol:water and homogenized to analyze 13C enrichment. Samples underwent three freeze-thaw cycles and were then centrifuged for 20 minutes at 16,000xg. 1 μL of d27-myristic acid was added as an internal control to the supernatant and the samples were evaporated and re-suspended in 40 μL anhydrous pyridine. The samples were then put into GC/MS autoinjector vials containing 60 μL N-(tert-butyldime-thylsilyl)-N-methyltrifluoroacetamide (MTBSTFA) derivatization reagent. The samples were incubated at 70° C for 1 hour, and aliquots of 1 μL were injected for analysis. Samples were analyzed using either an Agilent 6890 gas chromatograph coupled to an Agilent 5973N mass selective detector or 7890 gas chromatograph coupled to an Agilent 5975C mass selective detector. The observed distributions of mass isotopologues were corrected for natural abundance.
Mass Spectrometry of Blood for Glucose Enrichment:
Blood was obtained prior to infusion of [U-13C]glucose or [1,2-13C]acetate and approximately every 30 minutes during the infusion. Blood was drawn from an arterial line or from a venous site in the contralateral arm. Glucose enrichment was determined by comparing the ratio of fragment ions 206 and 441 (enriched) to ions 204 and 435 (unenriched) to a standard curve.
QUANTIFICATION AND STATISTICAL ANALYSIS:
Samples were analyzed as described in the figure legends. Data were considered significant if p<0.05. Statistics were calculated using PRISM software, and statistical details can be found in the figure legends for each figure.
Supplementary Material
Courtney et al. conducted isotope tracing in clear cell renal cell carcinoma (ccRCC) patients, and compared labeling patterns in primary ccRCC tumors and brain and lung tumors. They show enhanced glycolysis and reduced TCA cycle labeling in ccRCC tumors in vivo, which is consistent with the Warburg effect.
Highlights.
First isotope tracing analysis of human ccRCC
Primary ccRCC shows evidence of enhanced glycolysis compared to adjacent kidney
ccRCC shows suppressed glucose oxidation compared to tumors at other anatomic sites
Acknowledgments
This research was supported by ACS-IRG-02-196, NCI SPORE P50CA196516, NCI R01CA154475, NCI R35CA220449, NIH P41EB015908, and NIH NCATS KL2TR001103. K.D.C. was supported by NIH NCATS KL2TR001103. K.D.C., P.K., I.P., R.J.D., and E.A.M. are supported by NCI SPORE P50CA196516. I.P. is supported by R01CA154475. D.B. is supported by NIH NCATS TL1TR001104. R.J.D. is supported by CPRIT grant RP160089 and by the Howard Hughes Medical Institute Faculty Scholars Program. The authors would like to thank James Brugarolas, PI of NCI SPORE P50CA196516, for scientific discussion. We thank Jiyeon Kim for scientific discussion and critical reading of the manuscript. Graphical abstract was created using BioRender. The content of this manuscript is solely the responsibility of the authors and does not necessarily represent the official views of the NIH.
Footnotes
Publisher's Disclaimer: This is a PDF file of an unedited manuscript that has been accepted for publication. As a service to our customers we are providing this early version of the manuscript. The manuscript will undergo copyediting, typesetting, and review of the resulting proof before it is published in its final citable form. Please note that during the production process errors may be discovered which could affect the content, and all legal disclaimers that apply to the journal pertain.
Declaration of Interests: The authors have no competing interests to declare for this manuscript.
REFERENCES
- Benita Y, Kikuchi H, Smith AD, Zhang MQ, Chung DC, and Xavier RJ (2009). An integrative genomics approach identifies Hypoxia Inducible Factor-1 (HIF-1)-target genes that form the core response to hypoxia. Nucleic Acids Res 37, 4587–4602. [DOI] [PMC free article] [PubMed] [Google Scholar]
- Cancer Genome Atlas Research, N. (2013). Comprehensive molecular characterization of clear cell renal cell carcinoma. Nature 499, 43–49. [DOI] [PMC free article] [PubMed] [Google Scholar]
- Comerford SA, Huang Z, Du X, Wang Y, Cai L, Witkiewicz AK, Walters H, Tantawy MN, Fu A, Manning HC, et al. (2014). Acetate dependence of tumors. Cell 159, 1591–1602. [DOI] [PMC free article] [PubMed] [Google Scholar]
- Comte B, Vincent G, Bouchard B, and Rosiers CD (1997). Probing the Origin of Acetyl-CoA and Oxaloacetate Entering the Citric Acid Cycle from the13C Labeling of Citrate Released by Perfused Rat Hearts. Journal of Biological Chemistry 272, 26117–26124. [DOI] [PubMed] [Google Scholar]
- Fan TW, Lane AN, Higashi RM, Farag MA, Gao H, Bousamra M, and Miller DM (2009). Altered regulation of metabolic pathways in human lung cancer discerned by (13)C stable isotope-resolved metabolomics (SIRM). Mol Cancer 8, 41. [DOI] [PMC free article] [PubMed] [Google Scholar]
- Faubert B, Li KY, Cai L, Hensley CT, Kim J, Zacharias LG, Yang C, Do QN, Doucette S, Burguete D, et al. (2017). Lactate Metabolism in Human Lung Tumors. Cell 171, 358–371 e359. [DOI] [PMC free article] [PubMed] [Google Scholar]
- Hakimi AA, Pham CG, and Hsieh JJ (2013). A clear picture of renal cell carcinoma. Nat Genet 45, 849–850. [DOI] [PubMed] [Google Scholar]
- Hakimi AA, Reznik E, Lee CH, Creighton CJ, Brannon AR, Luna A, Aksoy BA, Liu EM, Shen R, Lee W, et al. (2016). An Integrated Metabolic Atlas of Clear Cell Renal Cell Carcinoma. Cancer Cell 29, 104–116. [DOI] [PMC free article] [PubMed] [Google Scholar]
- Hensley CT, Faubert B, Yuan Q, Lev-Cohain N, Jin E, Kim J, Jiang L, Ko B, Skelton R, Loudat L, et al. (2016). Metabolic Heterogeneity in Human Lung Tumors. Cell 164, 681–694. [DOI] [PMC free article] [PubMed] [Google Scholar]
- Hsieh JJ, Purdue MP, Signoretti S, Swanton C, Albiges L, Schmidinger M, Heng DY, Larkin J, and Ficarra V (2017). Renal cell carcinoma. Nat Rev Dis Primers 3, 17009. [DOI] [PMC free article] [PubMed] [Google Scholar]
- Hu CJ, Wang LY, Chodosh LA, Keith B, and Simon MC (2003). Differential Roles of Hypoxia-Inducible Factor 1 (HIF-1) and HIF-2 in Hypoxic Gene Regulation. Molecular and Cellular Biology 23, 9361–9374. [DOI] [PMC free article] [PubMed] [Google Scholar]
- Hui S, Ghergurovich JM, Morscher RJ, Jang C, Teng X, Lu W, Esparza LA, Reya T, Le Z, Yanxiang Guo J, et al. (2017). Glucose feeds the TCA cycle via circulating lactate. Nature 551, 115–118. [DOI] [PMC free article] [PubMed] [Google Scholar]
- Kennedy KM, Scarbrough PM, Ribeiro A, Richardson R, Yuan H, Sonveaux P, Landon CD, Chi JT, Pizzo S, Schroeder T, et al. (2013). Catabolism of exogenous lactate reveals it as a legitimate metabolic substrate in breast cancer. PLoS One 8, e75154. [DOI] [PMC free article] [PubMed] [Google Scholar]
- Kim JW, Tchernyshyov I, Semenza GL, and Dang CV (2006). HIF-1-mediated expression of pyruvate dehydrogenase kinase: a metabolic switch required for cellular adaptation to hypoxia. Cell Metab 3, 177–185. [DOI] [PubMed] [Google Scholar]
- Lee C-H, Gundem G, Lee W, Chen Y-B, Cross JR, Dong Y, Redzematovic A, Mano R, Wei EY, Cheng EH, et al. (2017). Persistent Severe Hyperlactatemia and Metabolic Derangement in Lethal SDHB-Mutated Metastatic Kidney Cancer: Clinical Challenges and Examples of Extreme Warburg Effect. JCO Precision Oncology, 1–14. [DOI] [PMC free article] [PubMed] [Google Scholar]
- Li B, Qiu B, Lee DS, Walton ZE, Ochocki JD, Mathew LK, Mancuso A, Gade TP, Keith B, Nissim I, et al. (2014). Fructose-1,6-bisphosphatase opposes renal carcinoma progression. Nature 513, 251–255. [DOI] [PMC free article] [PubMed] [Google Scholar]
- Linehan WM, Srinivasan R, and Schmidt LS (2010). The genetic basis of kidney cancer: a metabolic disease. Nat Rev Urol 7, 277–285. [DOI] [PMC free article] [PubMed] [Google Scholar]
- Maher EA, Marin-Valencia I, Bachoo RM, Mashimo T, Raisanen J, Hatanpaa KJ, Jindal A, Jeffrey FM, Choi C, Madden C, et al. (2012). Metabolism of [U-13 C]glucose in human brain tumors in vivo. NMR Biomed 25, 1234–1244. [DOI] [PMC free article] [PubMed] [Google Scholar]
- Malloy CR, Thompson JR, Jeffrey FM, and Sherry AD (1990). Contribution of exogenous substrates to acetyl coenzyme A: measurement by 13C NMR under non-steady-state conditions. Biochemistry 29, 6756–6761. [DOI] [PubMed] [Google Scholar]
- Mashimo T, Pichumani K, Vemireddy V, Hatanpaa KJ, Singh DK, Sirasanagandla S, Nannepaga S, Piccirillo SG, Kovacs Z, Foong C, et al. (2014). Acetate is a bioenergetic substrate for human glioblastoma and brain metastases. Cell 159, 1603–1614. [DOI] [PMC free article] [PubMed] [Google Scholar]
- Metallo CM, Gameiro PA, Bell EL, Mattaini KR, Yang J, Hiller K, Jewell CM, Johnson ZR, Irvine DJ, Guarente L, et al. (2011). Reductive glutamine metabolism by IDH1 mediates lipogenesis under hypoxia. Nature 481, 380–384. [DOI] [PMC free article] [PubMed] [Google Scholar]
- Moore LE, Nickerson ML, Brennan P, Toro JR, Jaeger E, Rinsky J, Han SS, Zaridze D, Matveev V, Janout V, et al. (2011). Von Hippel-Lindau (VHL) inactivation in sporadic clear cell renal cancer: associations with germline VHL polymorphisms and etiologic risk factors. PLoS Genet 7, e1002312. [DOI] [PMC free article] [PubMed] [Google Scholar]
- Mullen AR, Wheaton WW, Jin ES, Chen PH, Sullivan LB, Cheng T, Yang Y, Linehan WM, Chandel NS, and DeBerardinis RJ (2011). Reductive carboxylation supports growth in tumour cells with defective mitochondria. Nature 481, 385–388. [DOI] [PMC free article] [PubMed] [Google Scholar]
- Panchal AR, Comte B, Huang H, Kerwin T, Darvish A, des Rosiers C, Brunengraber H, and Stanley WC (2000). Partitioning of pyruvate between oxidation and anaplerosis in swine hearts. Am J Physiol Heart Circ Physiol 279, H2390–2398. [DOI] [PubMed] [Google Scholar]
- Papandreou I, Cairns RA, Fontana L, Lim AL, and Denko NC (2006). HIF-1 mediates adaptation to hypoxia by actively downregulating mitochondrial oxygen consumption. Cell Metab 3, 187–197. [DOI] [PubMed] [Google Scholar]
- Rathmell WK, and Chen S (2008). VHL inactivation in renal cell carcinoma: implications for diagnosis, prognosis and treatment. Expert Rev Anticancer Ther 8, 63–73. [DOI] [PMC free article] [PubMed] [Google Scholar]
- Schug ZT, Peck B, Jones DT, Zhang Q, Grosskurth S, Alam IS, Goodwin LM, Smethurst E, Mason S, Blyth K, et al. (2015). Acetyl-CoA synthetase 2 promotes acetate utilization and maintains cancer cell growth under metabolic stress. Cancer Cell 27, 57–71. [DOI] [PMC free article] [PubMed] [Google Scholar]
- Sellers K, Fox MP, Bousamra M 2nd, Slone SP, Higashi RM, Miller DM, Wang Y, Yan J, Yuneva MO, Deshpande R, et al. (2015). Pyruvate carboxylase is critical for non-small-cell lung cancer proliferation. J Clin Invest 125, 687–698. [DOI] [PMC free article] [PubMed] [Google Scholar]
- Semenza GL (2013). HIF-1 mediates metabolic responses to intratumoral hypoxia and oncogenic mutations. J Clin Invest 123, 3664–3671. [DOI] [PMC free article] [PubMed] [Google Scholar]
- Sudarshan S, Karam JA, Brugarolas J, Thompson RH, Uzzo R, Rini B, Margulis V, Patard JJ, Escudier B, and Linehan WM (2013). Metabolism of kidney cancer: from the lab to clinical practice. Eur Urol 63, 244–251. [DOI] [PMC free article] [PubMed] [Google Scholar]
- Turajlic S, Xu H, Litchfield K, Rowan A, Chambers T, Lopez JI, Nicol D, O’Brien T, Larkin J, Horswell S, et al. (2018). Tracking Cancer Evolution Reveals Constrained Routes to Metastases: TRACERx Renal. Cell 173, 581–594 e512. [DOI] [PMC free article] [PubMed] [Google Scholar]
- Wang HY, Ding HJ, Chen JH, Chao CH, Lu YY, Lin WY, and Kao CH (2012). Meta-analysis of the diagnostic performance of [18F]FDG-PET and PET/CT in renal cell carcinoma. Cancer Imaging 12, 464–474. [DOI] [PMC free article] [PubMed] [Google Scholar]
- Warburg O (1956). On the Origin of Cancer Cells. Science 123, 309–314. [DOI] [PubMed] [Google Scholar]
- Warburg O, Posener K, and Negelein E (1924). Ueber den stoffwechsel der tumoren. Biochem. Z 152, 319–344. [Google Scholar]
- Zhang Y, Udayakumar D, Cai L, Hu Z, Kapur P, Kho EY, Pavia-Jimenez A, Fulkerson M, de Leon AD, Yuan Q, et al. (2017). Addressing metabolic heterogeneity in clear cell renal cell carcinoma with quantitative Dixon MRI. JCI Insight 2. [DOI] [PMC free article] [PubMed] [Google Scholar]
Associated Data
This section collects any data citations, data availability statements, or supplementary materials included in this article.