

Abstract
Desired weight is an indicator of illness severity in youth with anorexia nervosa (AN), but its impact on eating disorder symptoms over time and in adults is unknown. This study examined longitudinal associations between two desired weight constructs (desired weight percentage, weight difference percentage) and eating disorder severity and body mass index (BMI) in patients aged 16-62 years old with AN presenting for inpatient or day hospital treatment. Participants (N = 160) completed the Eating Disorder Examination and measures of height and weight at treatment admission, discharge, and 3, 6, and 12 months post-discharge. Desired weight percentage was calculated as [desired BMI(desired weight in kg/height in meters2)/healthy BMI] × 100. Weight difference percentage was calculated as [(actual weight-desired weight)/actual weight] × 100. At admission, participants were approximately 78.6% of a healthy BMI and desired to be 81% of a healthy BMI. During the year following treatment, participants were 89% of a healthy BMI, but wanted to be 86% of a healthy BMI. Individuals with lower desired weight percentage (wanting to be a lower percentage of a healthy BMI) or higher weight difference percentage (wanting to lose a larger percentage of weight) at treatment admission endorsed greater eating disorder severity across time. Additionally, individuals with higher desired weight percentage or weight difference percentage had higher BMIs at intake, and greater increases in BMI over time. Results highlight that desired weight constructs represent correlates of illness severity in AN and may inform an individual’s likely weight trajectory during and after treatment.
Research in community samples has indicated that wanting to be a smaller body size (MacNeill & Best, 2015; Stice & Shaw, 2002) and having a larger discrepancy between one’s current and desired weights (Zarychta, Luszczynska, & Scholz, 2014; Zeigler-Hill & Noser, 2015) are associated with elevated eating disorder psychopathology and the onset of eating disorders. However, few studies have examined associations between desired weight constructs and eating disorder severity in clinical samples (Channon, de Silva, Hemsley, & Mukherjee, 1990; Sala et al., 2012). Boyd and colleagues (2017) recently developed two constructs to examine desired weight goals in a sample of 340 youth presenting for outpatient treatment of anorexia nervosa (AN) or bulimia nervosa (BN): 1) desired weight percentage, defined as the percent of expected body weight that an individual would like to be, and 2) weight difference percentage, defined as the percentage of body weight an individual would like to gain or lose from their current weight. Results of initial validation analyses showed that these constructs were distinct and associated with eating disorder psychopathology (Boyd et al., 2017). Moreover, desired weight profiles differed by eating disorder diagnosis. Individuals with AN reported wanting to be at a lower percentage of expected body weight than those with BN (i.e., individuals with AN had a lower desired weight percentage than individuals with BN), whereas individuals with BN endorsed larger differences between their desired and current body weights (i.e., larger weight difference percentages) than individuals with AN.
Although Boyd et al. (2017) provides initial support for the validity of desired weight constructs in adolescents with AN or BN, the utility of these constructs in older adolescents, adults, and individuals presenting for higher levels of care (e.g., inpatient, day hospital) is unknown. Adults with eating disorders tend to have longer durations of illness and more ingrained eating disorder psychopathology compared to youth (Errichiello, Iodice, Bruzzese, Gherghi, & Senatore, 2016; Le Grange et al., 2014; Reas, Williamson, Martin, & Zucker, 2000); thus, their desired weight profiles may differ. Presenting to a higher level of care also is a frequent marker of eating disorder severity (Hay et al., 2014). Consequently, it is possible that individuals with a longer duration of illness presenting for higher levels of care may desire to be at a lower body weight (i.e., have a lower desired weight percentage) and may be closer to this low weight (i.e., have a lower weight difference percentage) and less likely to endorse willingness to gain weight than adolescents presenting for outpatient treatment.
Additionally, longitudinal research is needed to determine the prognostic validity of desired weight constructs, including their influence on treatment outcomes (e.g., weight gain, eating disorder symptoms). In the previous study, lower desired weight percentage (i.e., wanting to be at a lower body weight) and higher weight difference percentage (i.e., wanting to lose more weight) were concurrently associated with greater weight and shape concerns and dietary restraint (Boyd et al., 2017). Over the course of treatment, individuals with AN are expected to gain weight; however, past research has shown that self-reported desired body shape does not change after individuals with AN complete inpatient treatment (Sala et al., 2012). Continued desire to be at a lower weight across treatment may prevent individuals from making adequate gains during treatment. Similarly, having a lower desired weight may stymie the ability of individuals with AN to change eating disorder psychopathology and maintain a healthy body weight over time. Table 1 presents three fictional illustrations of these desired weight constructs for individuals with AN at the outset of treatment.
Table 1.
Clinical illustrations of “desired weight percentage” and “weight difference percentage” in participants with anorexia nervosa
| Case Description | Desired Weight | Desired Weight Percentage (desired BMI/20) |
Weight Difference Percentage [(current wt-desired wt)/current wt]*100 |
|
|---|---|---|---|---|
| Ayana | Ayana is a 23 year old woman with AN. She is 5′7″ and 110 lbs, putting her at 86% of a healthy BMI. | 130 lbs | Ayana would like to gain weight from 110 to 130 lbs, making her desired weight percentage 102%. This would be a healthy weight for Ayana. | Ayana would like to gain weight from 110 to 130 lbs, making her weight difference percentage −18.2; she wants to gain 18% of her body weight. |
| Olivia | Olivia is a 27 year old woman with AN. She is 5′10″ and 115 lbs, putting her at 82.5% of a healthy BMI. | 120 lbs | Olivia would like to gain weight from 115 to 120 lbs, making her desired weight percentage 86%. This would be an unhealthy weight for Olivia. | Olivia would like to gain weight from 115 to 120 lbs, making her weight difference percentage −4.3; she wants to gain 4% of her body weight. |
| Camila | Camila is a 29 year old woman with AN. Camila is 5′2″ and 90 lbs, putting her at 82.5% of a healthy BMI. | 85 lbs | Camila would like to lose weight from 90 to 85 lbs, making her desired weight percentage 77.5%. This would be an unhealthy weight for Camila. | Camila would like to lose weight from 90 to 85 lbs, making her weight difference percentage 5.6; she wants to lose 5.6% of her body weight. |
Notes. AN=anorexia nervosa; BMI = body mass index; lbs = pounds; wt= weight; healthy BMI defined as 20 kg/m2; Names and examples are fictional.
The present study aimed to examine the validity of desired weight percentage and weight difference percentage in a sample of older adolescents and adults with AN presenting for inpatient or day hospital treatment, including the stability and predictive validity of desired weight constructs during and after treatment. Evaluating the influence of desired weight constructs, assessed at baseline, on changes in outcomes over time has potential to inform clinical practice by mimicking how clinicians might assess for desired weight constructs when patients enter treatment and use these data to inform treatment planning. We hypothesized that desired weight percentage and weight difference percentage would improve over the year following treatment discharge. We also hypothesized that lower desired weight percentage (which corresponds to wanting to be a lower body weight) and higher weight difference percentage (which corresponds with wanting lose more weight) at treatment admission would be associated with less weight gain and worse eating disorder symptomatology in the year following treatment discharge.
METHODS
Participants
Participants were recruited from consecutive unique admissions (N = 256) to the inpatient and day hospital eating disorder programs at an academic medical center between April 2008 and April 2011. Individuals who agreed to participate (N = 194) were enrolled in a longitudinal study that examined the short-term course of AN following discharge from acute treatment. Study inclusion criteria were: 1) age ≥ 16 years, 2) admission body mass index (BMI) < 18.5 or BMI percentile < 10 (patients aged 16 –19 years), and 3) medical stability. Details about the sample and inclusion and exclusion criteria have been described previously (Racine & Wildes, 2015; Wildes et al., 2011; Wildes, Forbush, & Markon, 2013). Of the original sample (N = 194), 31 participants did not provide their desired weight at baseline and were excluded from the current study. Additionally, three participants reported their desired weight to be less than 10 pounds at either baseline or a follow-up time point and were excluded, consistent with the criteria used by Boyd et al. (2017). This resulted in a final sample size of 160 for the current study (see Figure 1).
Figure 1.

Enrollment and follow-up assessments.
Participants (N = 160) had a mean age of 27.10 years (SD = 10.37; range 16 - 62), and a mean illness duration of 9.00 years (SD = 9.29; range 0 - 45). The majority of the sample was female (n = 152; 95%). From admission to discharge, 101 (63.1%) participants received inpatient treatment only, 18 (11.3%) received day hospital treatment only, and 41 (25.6%) received both inpatient and day hospital treatment. Of the participants who provided data for at least one follow-up assessment (n = 146), approximately half (n = 76; 52.1%) reported receiving additional intensive treatment (i.e., inpatient, day hospital, or residential treatment) after discharge.
Procedure
The original study was approved by the local institutional review board, and all participants signed a consent or assent form (for participants under the age of 18, whose parents provided informed consent). Medical charts were reviewed to collect information on BMI at admission and discharge and the type of treatment received (i.e., inpatient or day hospital). Participants completed in-person interviews and self-report questionnaires within approximately two weeks of admission and again at discharge. After discharge, follow-up interviews and questionnaires were completed at 3, 6, and 12 months. At baseline, participants provided their contact information and the contact information for up to three individuals who would be able to reach the participant if their contact information changed during follow-up. In order to maximize participation in follow-up assessments, a graded schedule of increasing monetary compensation was used, and participants were given the option of completing follow-ups in-person or by phone and mail. Information on the number of participants who completed each follow-up is provided in Figure 1. All assessments were completed by trained masters- or doctoral-level research staff (Wildes et al., 2011).
Measures
Eating Disorder Diagnosis and Symptoms
Current diagnosis of AN was confirmed using the Structured Clinical Interview for DSM-IV-TR Axis I Disorders (SCID-I; First, Spitzer, Gibbon, & Williams, 2007) and the Eating Disorder Examination Interview, 16th Edition (EDE; Fairburn, Cooper, & O’Connor, 2008). Diagnoses were made based on the Diagnostic and Statistical Manual of Mental Disorders, 4th edition criteria (American Psychiatric Association [APA], 1994), with the exception of the amenorrhea criterion (Attia & Roberto, 2009). Additionally, individuals with a BMI less than or equal to 17.5 were included, whether or not they endorsed fear of fatness. Duration of illness was calculated using the age of onset item from the SCID-I (First et al., 2007).
The EDE global score was used to assess eating disorder severity (Fairburn et al., 2008). Studies have indicated that the EDE is both reliable and valid (Berg, Peterson, Frazier, & Crow, 2012) and internal consistencies of the EDE global score in this study were good (α > .93).
BMI, Desired Weight Percentage, and Weight Difference Percentage
BMI was calculated from measures of height and weight collected at each assessment point. During in-person assessments, height was measured using a stationary stature board and weight was measured using a digital scale. If a participant completed follow-up assessments by phone or mail, consent to collect height and weight data from a health professional (e.g., physician, therapist, dietitian) was requested. Using these procedures, heights and weights were verified for 87.5% (n = 119/136) of participants at 3-month follow-up, 92.3% (n = 120/130) at 6-month follow-up, and 92.6% (n = 112/121) at 12-month follow-up. If verified height and weight could not be obtained, then participants’ self-reported height and weight were used (see Figure 1). Weights and heights were missing for 24 (15%) participants at 3-month follow-up, 30 (18.8%) at 6-month follow-up, and 39 (24.4%) at 12-month follow-up.
Desired weight was assessed via the EDE question, “What weight would you like to be?” As described previously (Wildes et al., 2011), a modified version of the EDE, which did not include the desired weight item, was administered at discharge. Consequently, desired weight constructs could only be assessed at baseline and follow-up time points. Because the majority of participants in the current study were adults (n = 137; 85.6%), Boyd et al.’s formula for desired weight percentage ([desired weight/expected body weight] × 100) was adapted to be based on a BMI of 20 rather than based on expected body weight, which is relevant only to children and adolescents (Le Grange et al., 2012). A BMI of 20 was selected as an index of expected weight in adults with AN because it falls within the healthy weight range recommended by the World Health Organization and is the minimum recommended weight target in enhanced cognitive behavior therapy for eating disorders (CBT-E; Fairburn, 2008). Desired weight percentage was determined by calculating participants’ desired BMI (desired weight in kilograms/height in meters squared) and then using the formula: [desired BMI/20] × 100.1 Weight difference percentage was calculated using the formula from Boyd et al. (2017): [(current weight − desired weight)/current weight] × 100.
Statistical Analyses
Growth curve models were conducted using the Statistical Package for the Social Sciences (SPSS, Version 24) to examine the trajectory of desired weight constructs across treatment and follow-up (i.e., to determine the stability of these constructs over time) and to examine the influence of desired weight at treatment admission on eating disorder severity and BMI in the year following treatment (i.e., to determine the predictive validity of these constructs on eating disorder outcomes). Model fitting was approached in several steps as outlined by Singer and Willet (2003). First, unconditional growth models were fit to the data in order to characterize the trajectory of desired weight percentage, weight difference percentage, eating disorder severity, and BMI. We tested whether linear and nonlinear (quadratic) growth processes contributed to change from admission to 12-months post-discharge and specified a series of models with random intercept, random slope, or random intercept and random slope in which each participant and/or their rate of change were allowed to vary. Time was coded as the number of weeks since admission for each assessment point, with the baseline assessment (treatment admission) coded as zero. Akaike Information Criterion (AIC) was used to determine model fit, with smaller AIC values indicating better fit to the data. Across all dependent variables, the random intercept models specifying a quadratic growth process had the smallest AIC values (Table 2). However, the difference in AIC values for the linear and quadratic random intercept model for EDE global scores was minimal (2047.23 vs. 2046.81), and the quadratic term was not statistically significant. Thus, the linear model was determined to be a better fit for EDE global score. These best fitting models were used as the base for conditional analyses, which examined whether baseline desired weight percentage or weight difference percentage predicted eating disorder severity or BMI at baseline (intercept) or change in these variables from baseline to 12-months following treatment discharge (slope). Significant interactions with time (i.e., predictors of slope) were plotted using online tools specific to latent curve analyses (Preacher, Curran, & Bauer, 2006).
Table 2.
Comparison of random coefficient models in the full sample (N = 160) to characterize the trajectory of desired weight percentage, weight difference percentage, eating disorder severity, and BMI from admission to 12-months post-discharge.
| Desired Weight Percentage | ||
|---|---|---|
| Linear | Quadratic | |
| Model | AIC | AIC |
| Random Intercept | 3674.07 | 3658.52 |
| Random Slope | 3911.02 | 3963.68 |
| Random Intercept, Random Slope | 3910.69 | 3963.68 |
| Weight Difference Percentage | ||
| Linear | Quadratic | |
| Model | AIC | AIC |
| Random Intercept | 3918.14 | 3895.99 |
| Random Slope | 4074.88 | 4076.68 |
| Random Intercept, Random Slope | 4074.79 | 4076.68 |
| Eating Disorder Severity (EDE Global) | ||
| Linear | Quadratic | |
| Model | AIC | AIC |
| Random Intercept | 2047.23 | 2046.81 |
| Random Slope | 2475.20 | 2540.90 |
| Random Intercept, Random Slope | 2474.64 | 2541.12 |
| Body Mass Index | ||
| Linear | Quadratic | |
| Model | AIC | AIC |
| Random Intercept | 2822.14 | 2768.58 |
| Random Slope | 2903.10 | 2944.02 |
| Random Intercept, Random Slope | 2902.74 | 2944.02 |
Notes. BMI = body mass index; AIC = Akaike Information Criterion (smaller AIC values indicate better fit to the data). Bold values indicate the best fitting model. The difference in AIC values for the linear and quadratic random intercept model for EDE global score was minimal (2047.23 vs. 2046.81), and the quadratic term was not statistically significant. Thus, the linear model was determined to be a better fit for EDE global score.
Age, sex, duration of illness, and AN subtype were included as covariates in conditional analyses. Individuals with missing data at any assessment point (n = 52) did not differ from individuals without any missing data (n = 108) on baseline variables. Thus, data were assumed to be missing at random, and full information maximum likelihood estimation was used to account for missing data. Statistical analyses in which desired weight constructs were measured as time-varying predictors are included in Supplemental Material.
RESULTS
Descriptive statistics for study variables across assessment points are presented in Table 3. Baseline data for the desired weight constructs showed that, on average, participants wanted to be approximately 81% of a healthy BMI (range 55.68% – 110.61%) and were willing to gain nearly 4% of their body weight (range −50.84 – 26.58) at admission to treatment. There were no significant differences between participants with the restricting (n= 63) and binge-eating/purging (n = 97) subtypes of AN on desired weight percentage or weight difference percentage at admission (p > .05). Desired weight percentage and weight difference percentage were negatively correlated at each time point (admission r = −.64; 3-month follow-up r = −.47; 6-month follow-up r = −.41; 12-month follow-up r = −.36; all ps < .001), and neither construct was correlated with duration of illness (ps > .05).
Table 3.
Demographics and clinical characteristics of the sample (N = 160) at baseline and follow-up assessment points
| Baseline | Discharge | 3-month | 6-month | 12-month | |
|---|---|---|---|---|---|
|
|
|||||
| M (SD) | M (SD) | M (SD) | M (SD) | M (SD) | |
| EDE Global | 3.03 (1.50) | 2.43 (2.53) | 2.53 (1.57) | 2.49 (1.60) | 2.36 (1.58) |
| BMI | 15.71 (1.84) | 18.05 (1.58) | 17.85 (2.18) | 17.74 (2.43) | 17.89 (2.71) |
| Percent of Healthy BMI | 78.57 (9.20) | 90.27 (7.88) | 89.24 (10.90) | 88.70 (12.13) | 89.46 (13.54) |
| Desired Weight Percentage | 81.12 (11.00) | – | 86.16 (10.66) | 86.40 (11.21) | 86.35 (12.26) |
| Weight Difference Percentage | −3.87 (15.76) | – | 3.06 (11.56) | 2.54 (11.98) | 2.78 (11.32) |
Notes. M = Mean; SD = Standard Deviation; EDE = Eating Disorder Examination; BMI = body mass index; Percent of Healthy BMI = (current BMI/20)×100, assuming healthy BMI equals 20; a negative weight difference percentage indicates a desire to gain weight
Stability of Desired Weight Constructs over Time
The estimated means and variances for the unconditional growth models are presented in Table 4. There was a significant effect of time for both desired weight percentage (b = 0.19, p < .001) and weight difference percentage (b = 0.40, p < .001), meaning that there were overall increases in these values from admission to 12-months post-discharge. Specifically, participants’ desired weight percentages became healthier over time, but they also wanted to lose more weight (i.e., exhibited a larger discrepancy between their actual and desired weights; Table 3 and Figure 2). Notably, changes in desired weight constructs were no longer significant when the analyses accounted for changes in BMI over time (i.e., when BMI was included as a time-varying covariate), indicating that changes in desired weight constructs are strongly associated with changes in BMI.
Table 4.
Estimated means and variances of the unconditional models in full sample (N = 160), demonstrating significant change in these constructs over time
| Parameter | Fixed Effects | Variance | |||
|---|---|---|---|---|---|
|
|
|||||
| Intercept | Time | Time2 | Within Person | Intercept | |
|
|
|||||
| γ (SE) | γ (SE) | γ (SE) | γ (SE) | γ (SE) | |
| Desired Weight Percentage | 81.81 (0.85)*** | 0.19 (0.03)*** | −0.001 (0.00)*** | 33.69 (2.50)*** | 88.08 (11.10)*** |
| Weight Difference Percentage | −3.58 (1.03)*** | 0.40 (0.06)*** | −0.01 (0.001)*** | 71.05 (5.38)*** | 100.41 (14.31)*** |
| Eating Disorder Severity (EDE Global) | 2.76 (0.11)*** | −0.01 (0.001)*** | – | 0.64 (0.04)*** | 1.80 (0.22)*** |
| Body Mass Index | 16.53 (0.16)*** | 0.10 (0.01)*** | −0.001 (0.00)*** | 2.37 (0.15)*** | 2.55 (0.35)*** |
Notes. Time2 represents the quadratic term (time*time), which tests for nonlinear changes over time; EDE=Eating Disorder Examination global score.
p < .001.
Significant intercept of the fixed effects column indicates initial value (intercept) is significantly different from zero; significant intercept of the variance column indicates that there is significant variance (differences across individuals) in initial levels (intercept).
Figure 2.

Comparison of desired weight percentage and percentage of healthy BMI Percentage of Healthy BMI = (current BMI/20)×100, assuming healthy BMI equals 20.
Predictive Validity of Desired Weight Constructs for Eating Disorder Severity over Time
As expected, EDE global scores decreased significantly (b = −0.01, p < .001) from admission to 12-months post-discharge (Table 4). While controlling for covariates, there was a significant main effect for baseline desired weight percentage on EDE scores such that individuals with lower desired weight percentages at treatment admission (i.e., individuals who wanted to be a lower percentage of a healthy body weight) reported higher EDE scores at treatment admission (i.e., greater eating disorder severity; b = −0.06, p < .001; Table 5 and Figure 3a). There also was a significant interaction between desired weight percentage and time (b < 0.001, p = .02), indicating that desired weight percentage influenced the rate of change in eating disorder severity over time (i.e., the slope). Specifically, individuals who desired to be a lower percentage of a healthy weight at baseline had greater eating disorder severity but steeper decreases in severity over time, likely reflecting regression to the mean (Figure 3a).
Table 5.
Estimates of fixed effects for conditional models (including all predictors/covariates in the same model) predicting EDE global scores and body mass index over time in full sample
| EDE Global | BMI | |||
|---|---|---|---|---|
|
|
||||
| γ (SE) | p | γ (SE) | p | |
| Desired Weight Percentage (DWP) | ||||
|
| ||||
| Intercept | 6.30 (1.12) | <.001 | 14.03 (1.63) | <.001 |
| Time | −0.03 (0.01) | .003 | 0.03 (0.01) | <.18 |
| Time2 | – | – | −0.001 (0.00) | <.001 |
| Age | −0.02 (0.01) | .20 | −0.02 (0.02) | .22 |
| Sex | 0.55 (0.43) | .20 | −0.18 (0.61) | .76 |
| Duration of Illness | 0.03 (0.01) | .02 | −0.008 (0.02) | .68 |
| Subtype | 0.64 (0.19) | .001 | −0.05 (0.27) | .86 |
| DWP baseline | −0.06 (0.01) | <.001 | 0.04 (0.01) | <.001 |
| Time*DWP baseline | <0.001 (0.00) | .02 | <0.001 (0.00) | .002 |
|
| ||||
| Weight Difference Percentage (WDP) | ||||
|
| ||||
| Intercept | 1.68 (0.79) | .04 | 18.04 (1.24) | <.001 |
| Time | −0.01 (0.002) | <.001 | 0.10 (0.01) | <.001 |
| Time2 | – | – | −0.001 (0.00) | <.001 |
| Age | −0.01 (0.01) | .29 | <0.001 (0.02) | .98 |
| Sex | 0.48 (0.40) | .23 | −0.41 (0.63) | .51 |
| Duration of Illness | 0.03 (0.01) | .007 | −0.04 (0.02) | .06 |
| Subtype | 0.59 (0.18) | .001 | −0.36 (0.27) | .19 |
| WDP baseline | 0.05 (0.01) | <.001 | 0.04 (0.01) | <.001 |
| Time*WDP baseline | −.0004 (0.00) | <.001 | −.0004 (0.00) | .04 |
Notes. BMI=body mass index; EDE=Eating Disorder Examination; DWP= desired weight percentage; WDP= weight difference percentage; Time2 represents the non-linear (quadratic) effect; Bold indicates statistical significance
Figure 3.
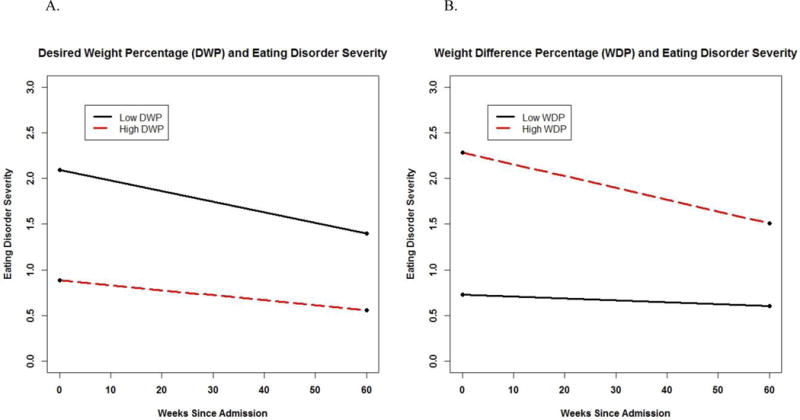

Effects of desired weight constructs on eating disorder severity and body mass index over time (conditional influence of desired weight constructs on change in eating disorder severity and BMI). Interactions were probed at one standard deviation above and below the mean for desired weight constructs.
For weight difference percentage, there was a significant main effect on EDE scores and significant interaction with time (Table 5). Specifically, individuals with a higher weight difference percentage at treatment admission (i.e., those who wanted to lose more weight) reported higher EDE scores (b = 0.05, p < .001) but also demonstrated greater decreases in eating disorder severity over time (b = −0.0004, p < .001; Table 5 and Figure 3b).
Predictive Validity of Desired Weight Constructs for BMI over Time
Across the sample, BMI increased from admission to 12-months post discharge (b = .10, p < .001; Table 4). There was a significant main effect for baseline desired weight percentage, such that participants with higher desired weight percentages at treatment admission (i.e., those who wanted to be at a higher percentage of a healthy BMI) had higher initial BMIs (b = .04, p < .001; Table 5 and Figure 3c). Additionally, there was a significant interaction between desired weight percentage and time (b = < .001, p = .002), indicating that individuals with higher desired weight percentages at baseline had greater increases in BMI over time (Figure 3c).
Finally, there was a significant main effect and interaction with time for the influence of baseline weight difference percentage on BMI. Individuals with higher weight difference percentages at treatment admission (i.e., those who wanted to lose more weight) reported higher BMIs at baseline and experienced slower increases in BMI over time (Table 5 and Figure 3d).
DISCUSSION
This study was the first to examine the clinical utility and prognostic validity of desired weight constructs (i.e., desired weight percentage and weight difference percentage) in a sample of older adolescents and adults with AN. Findings are relatively consistent with those in a sample of youth with AN (Boyd et al., 2017), such that participants reported a willingness to gain a small amount of weight at treatment admission, but their desired weights were in an objectively unhealthy weight range. Although desired weight percentage increased (i.e., became healthier) after treatment, participants did not desire to be within a healthy weight range at any assessment point. Contrary to hypotheses, weight difference percentage actually became “less healthy” (i.e., participants wanted to lose more weight) over time. Participants reported a willingness to gain approximately 4% of their body mass at baseline, but they actually regained approximately 12% of their body mass, thus exceeding their desired weight percentage and increasing their desires to lose more weight over time. Furthermore, wanting to be at a lower percentage of a healthy weight (lower desired weight percentage) and wanting to lose more weight (i.e., higher weight difference percentage) at treatment admission were associated with greater eating disorder psychopathology. These findings suggest that desired weight constructs may be indicators of severity among adults, as well as youth, with AN.
Desired weight constructs also demonstrated associations with BMI. As hypothesized, wanting to be a higher percentage of a healthy weight was associated with higher BMI at baseline and predicted greater increases in BMI over follow-up. A similar pattern of results was found for weight difference percentage. On average, participants reported that they were willing to gain approximately 4% of their body mass at baseline, and individuals with lower weight difference percentages (i.e., those who wanted to gain more weight) demonstrated greater increases in BMI over time. These finding have potential clinical implications, in that having a higher desired weight percentage or desire to gain a greater percentage of weight may help facilitate weight gain during and after treatment for AN. Although clinicians likely are aware that when patients enter treatment wanting to be at a lower body weight this unhealthy perspective may negatively impact treatment outcomes, systematically assessing desired weight may be beneficial for identifying patients who are most likely to gain weight.
Given the relation between desired weight constructs at treatment admission and outcomes over time, it may be beneficial for clinicians to assess desired weight constructs when patients enter treatment and use these data to inform treatment planning. Specifically, given that participants wanted to gain weight at the outset of treatment when their desired weights were higher than their current weights, and lose weight during follow-up when their current weights exceeded their desired weights, it may be worthwhile to consider treatment strategies to influence desired weight goals. Currently, there is no consensus on the benefits and potential harms associated with open versus blind weighing practices during intensive treatment for AN. Findings from this study suggest that desired weight changes during treatment may be related to acceptance of target weight. Thus, one treatment strategy to consider would be to track fluctuations in desired weight alongside changes in actual body weight to help patients understand the relationship between their desired weight and the maintenance of their eating disorder. Moreover, assessing the importance of achieving desired weight at intake may reveal a critical treatment target for addressing eating disorder psychopathology. These constructs can be measured by asking patients one simple question (“What weight would you like to be?”), assuming their current heights and weights are already known. Indeed, findings suggest that improving individuals’ desired weights could positively influence weight gain and sustain recovery.
Strengths of the current study include the relatively large sample of patients with AN and the longitudinal design. Nevertheless, several limitations should be considered when interpreting the findings. First, although assessment of desired weight is simple and can be utilized across settings, calculations of desired weight constructs may vary between children and adults. In youth, desired weight percentage is calculated as a percent of expected body weight (Boyd et al., 2017), whereas in adults, the calculation was based on a percentage of a BMI of 20. Second, few participants in the current study achieved the expected BMI of 20 (7.5% of the sample at discharge, 14.6 – 20.7% of the sample across the follow-up time points), and it will be important to assess changes in desired weight constructs across time in samples where a larger number of individuals reach a healthy weight. Similarly, the specific BMI value chosen to calculate desired weight percentage may not reflect a healthy BMI for every individual. Third, participants were recruited from an academic medical center eating disorders program and may not be representative of individuals with AN in the general population or those seeking treatment in other settings. Further, because not all consecutive admissions consented to the study, this sample may be limited in generalizability. Fourth, although we found significant longitudinal associations among our constructs and outcome variables, it is possible that other variables may be influencing these relationships and causality cannot be established. Finally, this study focused exclusively on individuals with AN. Future research is needed to determine whether the predictive validity of desired weight constructs differs across eating disorder diagnoses, especially given differences in the desired weight profiles of individuals with AN and BN in the original study of these constructs in youth (Boyd et al., 2017).
In sum, the present study expands our understanding of the relationship between desired weight, BMI, and eating disorder psychopathology in a clinical sample of older adolescents and adults with AN. Results highlight that desired weight constructs represent correlates of eating disorder severity in AN. Findings also suggest that wanting to be at a higher body weight is predictive of achieving and maintaining a higher body weight. Taken together, desired weight constructs may provide useful information about an individual’s likely weight trajectory during and after treatment. Future research should evaluate the impact of achieving desired weight on weight restoration and maintenance.
Supplementary Material
Acknowledgments
This work was supported by grants from the National Institutes of Health (K01 MH080020, T32 MH082761, and F32 HD089586).
Footnotes
For participants <18 years (n = 23), desired weight percentage was calculated using Boyd et al.’s original formula with expected body weight, as well as using the formula in the current study with healthy BMI. The two methods of calculating desired weight percentage were highly correlated (r = .99). Thus, for the current study, we used desired weight percentage as a function of BMI across older adolescents and adults.
References
- American Psychiatric Association. Diagnostic and statistical manual of mental disorders. 4th. Washington, DC: American Psychiatric Publishing; 1994. [Google Scholar]
- Attia E, Roberto CA. Should amenorrhea be a diagnostic criterion for anorexia nervosa? International Journal of Eating Disorders. 2009;42:581–589. doi: 10.1002/eat.20720. [DOI] [PubMed] [Google Scholar]
- Berg KC, Peterson CB, Frazier P, Crow SJ. Psychometric evaluation of the eating disorder examination and eating disorder examination-questionnaire: A systematic review of the literature. International Journal of Eating Disorders. 2012;45:428–438. doi: 10.1002/eat.20931. [DOI] [PMC free article] [PubMed] [Google Scholar]
- Boyd HK, Kass AE, Accurso EC, Goldschmidt AB, Wildes JE, Le Grange D. Relationship between desired weight and eating disorder pathology in youth. International Journal of Eating Disorders. 2017;50(8):963–969. doi: 10.1002/eat.22720. [DOI] [PMC free article] [PubMed] [Google Scholar]
- Channon S, de Silva P, Hemsley D, Mukherjee K. Body-size perception and preferences in stable-weight and improved-weight anorexic patients. International Journal of Eating Disorders. 1990;9(4):403–408. [Google Scholar]
- Errichiello L, Iodice D, Bruzzese D, Gherghi M, Senatore I. Prognostic factors and outcome in anorexia nervosa: a follow-up study. Eating and Weight Disorders. 2016;21:73–82. doi: 10.1007/s40519-015-0211-2. [DOI] [PubMed] [Google Scholar]
- Fairburn CG, Cooper Z, O’Connor ME. Eating disorder examination, 16th edition. New York: Guilford Press; 2008. [Google Scholar]
- Fairburn CG. Cognitive behavioral therapy and eating disorders. Chichester: The Guilford Press; 2008. [Google Scholar]
- First MB, Spitzer RL, Gibbon M, Williams JBW. Structured Clinical Interview for DSM-IV Axis I Disorders–Patient Edition (SCID/P) New York: Biometrics Research Department; 2007. [Google Scholar]
- Hay P, Chinn D, Forbes D, Madden S, Newton R, Sugenor L, Touyz S, Ward W. Royal Australian and New Zealand College of Psychiatrists clinical practice guidelines for the treatment of eating disorders. Australian & New Zealand Journal of Psychiatry. 2014;48:977–1008. doi: 10.1177/0004867414555814. [DOI] [PubMed] [Google Scholar]
- Le Grange D, Doyle PM, Swanson SA, Ludwig K, Glunz C, Kreipe RE. Calculation of Expected Body Weight in Adolescents With Eating Disorders. Pediatrics. 2012;129:438–446. doi: 10.1542/peds.2011-1676. [DOI] [PMC free article] [PubMed] [Google Scholar]
- Le Grange D, Fitzsimmons-Craft EE, Crosby RD, Hay P, Lacey H, Bamford B, Stiles-Shields C, Touyz S. Predictors and moderators of outcome for severe and enduring anorexia nervosa. Behaviour Research and Therapy. 2014;56:91–98. doi: 10.1016/j.brat.2014.03.006. [DOI] [PubMed] [Google Scholar]
- MacNeill LP, Best LA. Perceived current and ideal body size in female undergraduates. Eating Behaviors. 2015;18:71–75. doi: 10.1016/j.eatbeh.2015.03.004. [DOI] [PubMed] [Google Scholar]
- Preacher KJ, Curran PJ, Bauer DJ. Computational tools for probing interaction effects in multiple linear regression, multilevel modeling, and latent curve analysis. Journal of Educational and Behavioral Statistics. 2006;31:437–448. [Google Scholar]
- Reas DL, Williamson DA, Martin CK, Zucker NL. Duration of illness predicts outcome for bulimia nervosa: a long-term follow-up study. International Journal of Eating Disorders. 2000;27:428–434. doi: 10.1002/(sici)1098-108x(200005)27:4<428::aid-eat7>3.0.co;2-y. [DOI] [PubMed] [Google Scholar]
- Racine SE, Wildes JE. Dynamic longitudinal relations between emotion regulation difficulties and anorexia nervosa symptoms over the year following intensive treatment. Journal of Consulting and Clinical Psychology. 2015;83(4):785–795. doi: 10.1037/ccp0000011. [DOI] [PMC free article] [PubMed] [Google Scholar]
- Sala L, Mirabel-Sarron C, Pham-Scottez A, Blanchet A, Rouillon F, Gorwood P. Body dissatisfaction is improved but ideal silhouette is unchanged during weight recovery in anorexia nervosa female inpatients. Eating and Weight Disorders. 2012;17:109–115. doi: 10.1007/BF03325334. [DOI] [PubMed] [Google Scholar]
- Stice E, Shaw HE. Role of body dissatisfaction in the onset and maintenance of eating pathology: A synthesis of research findings. Journal of Psychosomatic Research. 2002;53:985–993. doi: 10.1016/s0022-3999(02)00488-9. [DOI] [PubMed] [Google Scholar]
- Wildes JE, Forbush KT, Markon KE. Characteristics and stability of empirically derived anorexia nervosa subtypes: Towards the identification of homogeneous low-weight eating disorder phenotypes. Journal of Abnormal Psychology. 2013;122:1031–1041. doi: 10.1037/a0034676. [DOI] [PMC free article] [PubMed] [Google Scholar]
- Wildes JE, Marcus MD, Crosby RD, Ringham RM, Dapelo MM, Gaskill JA, Forbush KT. The Clinical Utility of Personality Subtypes in Patients with Anorexia Nervosa. Journal of Consulting and Clinical Psychology. 2011;79(5):665–674. doi: 10.1037/a0024597. [DOI] [PMC free article] [PubMed] [Google Scholar]
- Zarychta K, Luszczynska A, Scholz U. The association between automatic thoughts about eating, the actual-ideal weight discrepancies, and eating disorders symptoms: a longitudinal study in late adolescence. Eating and Weight Disorders. 2014;19(2):199–207. doi: 10.1007/s40519-014-0099-2. [DOI] [PMC free article] [PubMed] [Google Scholar]
- Zeigler-Hill V, Noser A. Will I ever think I’m thin enough? A moderated mediation study of women’s contingent self-esteem, body image discrepancies, and disordered eating. Psychology of Women Quarterly. 2015;39(1):109–118. [Google Scholar]
Associated Data
This section collects any data citations, data availability statements, or supplementary materials included in this article.