

Abstract
Fibroblast growth factor receptor-1 (FGFR1) activity at the plasma membrane is tightly controlled by the availability of co-receptors and competing receptor isoforms. We have previously shown that FGFR1 activity in pancreatic beta-cells modulates a wide range of processes, including lipid metabolism, insulin processing, and cell survival. More recently, we have revealed that co-expression of FGFR5, a receptor isoform that lacks a tyrosine-kinase domain, influences FGFR1 responses. We therefore hypothesized that FGFR5 is a co-receptor to FGFR1 that modulates responses to ligands by forming a receptor heterocomplex with FGFR1. We first show here increased FGFR5 expression in the pancreatic islets of nonobese diabetic (NOD) mice and also in mouse and human islets treated with proinflammatory cytokines. Using siRNA knockdown, we further report that FGFR5 and FGFR1 expression improves beta-cell survival. Co-immunoprecipitation and quantitative live-cell imaging to measure the molecular interaction between FGFR5 and FGFR1 revealed that FGFR5 forms a mixture of ligand-independent homodimers (∼25%) and homotrimers (∼75%) at the plasma membrane. Interestingly, co-expressed FGFR5 and FGFR1 formed heterocomplexes with a 2:1 ratio and subsequently responded to FGF2 by forming FGFR5/FGFR1 signaling complexes with a 4:2 ratio. Taken together, our findings identify FGFR5 as a co-receptor that is up-regulated by inflammation and promotes FGFR1-induced survival, insights that reveal a potential target for intervention during beta-cell pathogenesis.
Keywords: fibroblast growth factor receptor (FGFR), fibroblast growth factor (FGF), beta cell (B-cell), islet, fluorescence resonance energy transfer (FRET), pancreas, diabetes, inflammation, metabolism, cytokine
Introduction
FGFR13 is historically associated with mitogenic activity, but more diverse roles have emerged, including the regulation of cellular metabolism and survival (1). The many varied and contextual responses of FGFR1 are orchestrated by the class of ligand as well as its availability, competing receptor isoforms, and co-receptors. We revealed that co-expression of FGFR1 and its co-receptor KLB permits pancreatic beta-cells to respond to FGF21, as measured by modulated insulin biosynthesis, citrate and lipid metabolism, and cell survival (2–4). More recently, we showed that beta-cells also express a newly appreciated FGFR isoform called FGFR5 (also known as fibroblast growth factor receptor-like 1; FGFRL1) that modulates the cellular response to the FGFR1 ligand FGF2 (5). We therefore sought to determine how FGFR5 regulates FGFR1 activity (6, 7).
FGFR5 and FGFR1 are co-expressed in several tissues (e.g. pancreas, liver, and kidney), share significant amino acid sequence and predicted structural homology, and show some overlap in affinity for ligands, thereby making it critical to understand how these receptors interact (10, 11). It was initially suggested that FGFR1 activity would be inhibited by co-expression of FGFR5 due to competition for ligand binding as well as the inability to initiate intracellular phosphorylation due to a very short intracellular (20-amino acid) C-terminal tail that lacks a tyrosine kinase domain (10, 11). However, subsequent functional studies revealed that FGFR5 has an active role in the development of skeletal muscle and kidney tissue (8–10). Similarly, we recently showed that expression of FGFR5 enhances both basal and FGF2-stimulated ERK1/2 phosphorylation in beta-cells (5). Together, these studies suggest that FGFR5 is a co-receptor for FGFR1.
To determine the interaction between FGFR5 and FGFR1, we first confirmed the endogenous expression of FGFR5 in mouse and human beta-cells. These studies show that FGFR5 is up-regulated by inflammation to promote beta-cell survival. We next characterized the molecular aggregation state of FGFR5 vis-à-vis its relationship with FGFR1 at the plasma membrane. Classical biochemistry and live cell imaging showed that FGFR5 self-aggregates in the absence of significant FGFR1 into a mixture of FGF2-insensitive homodimers and homotrimers. Subsequently, co-expression of FGFR5 and FGFR1 resulted in a 2:1 heterocomplex that aggregated further in the presence of FGF2. Together, our data suggest that FGFR5 is up-regulated by inflammation to improve beta-cell survival by acting as a co-receptor for FGFR1.
Results
FGFR5 is up-regulated in beta-cells by inflammatory cytokines to enhance cell survival
Cytokine-induced inflammation and metabolic stress are associated with beta-cell failure. To determine the effect of inflammation on beta-cell FGFR5 expression, we first compared the pancreata of nonobese diabetic (NOD) with age-matched BALB/c control mice by immunofluorescence (Fig. 1). These data show that FGFR5 immunofluorescence was significantly brighter in the insulin-positive cells of prediabetic NOD mice (Fig. 1A). In the NOD model, 60–80% of females develop overt type 1 diabetes (11, 12), and 80% display insulitis (13). To understand our in vivo findings, we examined the effect of pro-inflammatory cytokines (TNFα, IFN-γ, and IL-1β) on FGFR5 expression in βTC3 cells (Fig. 1, B–D). An increase in transcript (fgfrl1; Fig. 1B) and protein (Fig. 1C) was observed 24 h post-treatment. Consistently, human islets treated in the same manner were also found to express more FGFR5 protein than controls (Fig. 1D). To determine the effect of metabolic stress, we next examined the effect of excess glucose and the free fatty acid palmitate (i.e. to model glucolipotoxicity) on endogenous beta-cell FGFR5 expression (4, 14). In contrast to cytokine-induced responses, glucotoxicity did not stimulate a change in fgfrl1 transcript (Fig. 1E) or FGFR5 protein expression (Fig. 1F). We next examined the effect of endogenous FGFR5 and FGFR1 on beta-cell survival using siRNA knockdown (R5 and R1) versus scrambled control. Knockdown of FGFR5 and FGFR1 protein expression in βTC3 cells was first confirmed by Western blotting (Fig. S1, A and B). These cells were subsequently treated with the pro-inflammatory cytokine mixture (TNFα, IFN-γ, and IL-1β) in the presence or absence of the FGFR1 ligand FGF2 for 24 h, and the percentage of late apoptotic cells was identified by flow cytometry using Annexin V/7-AAD staining (Fig. 1G and Fig S1). Analysis gates for the Annexin V/7-AAD plots were established using positive (10 mm H2O2 treatment for 6 h) and negative (untreated, adherent βTC3 cells) control cells (Fig. S1, C and D). Cytokine treatment alone did not induce significant cell death (Fig. 1G). FGFR5 and FGFR1 knockdown showed a trend toward greater cell death that became significant compared with scrambled control cells with cytokine treatment (Fig. 1G and Fig. S1 (E–L)). These data are consistent with FGFR5- and FGFR1-induced cell survival. FGF2 reduced apoptosis of cytokine-treated cells; however, this trend failed to reach significance, probably due to knockdown of the receptors. Together, these data suggest that beta-cells up-regulate FGFR5 in response to inflammatory cytokines to improve survival.
Figure 1.

Endogenous FGFR5 expression is elevated in beta-cells exposed to pro-inflammatory cytokines but not glucolipotoxicity. A, immunodetection of endogenous FGFR5 (far left; red in overlay) is elevated in the surviving islets of age-matched NOD female mice not displaying overt diabetes compared with BALB/c controls. Insulin (second from left; green in overlay), glucagon (second from right; magenta in overlay), and DAPI (right; blue in overlay) identify beta-cells, alpha-cells, and cell nuclei, respectively. Scale bars, 25 μm. B, βTC3 cells chronically stimulated by pro-inflammatory cytokines (TNFα, IFN-γ, and IL-1β) for 24 h (Cyto.) expressed higher levels of fgfrl1 compared with the gapdh reference gene when compared with PBS-treated cells (Cont.). n = 4 independent qPCR experiments. C, Western immunoblots of βTC3 whole-cell lysate revealed greater levels of FGFR5 protein relative to GAPDH in cells challenged with pro-inflammatory cytokines. n = 5 independent experiments. D, human donor islets also exhibited an increase in FGFR5 protein levels when challenged with the same pro-inflammatory conditions (25 islets each). E, expression levels of fgfrl1 mRNA remained unchanged when βTC3 cells were cultured in medium supplemented with 0.4 mm palmitate (Palm.). n = 4 independent experiments. F, FGFR5 protein expression was also not altered by palmitate supplementation. n = 5 independent experiments. *, p < 0.05; n.s., no significance by unpaired two-sample t test. G, βTC3 cells treated with scrambled siRNA control (Scr), siRNA targeting FGFR5 (R5), or FGFR1 (R1) were co-stained with Annexin V–APC and 7-AAD for assessment of cell viability by flow cytometry. Quantification of the late apoptotic fraction (Annexin V+ve/7-AAD+ve) revealed that loss of FGFR5 expression increased beta-cell apoptosis during cytokine-induced stress. * and **, p < 0.05 and p < 0.01, respectively, based on one-way ANOVA.
FGFR5 forms higher-order homoaggregates
FGFR5 has previously been shown to form constitutive aggregates at the cell surface (15), and we recently showed that the C-terminal tail of FGFR5 directs membrane trafficking (Fig. 2A). To determine the role of the C terminus in FGFR5 self-association, we co-immunoprecipitated various combinations of hemagglutinin (HA)-tagged full-length (R5HA) and C terminus–deficient FGFR5 (ΔCHA) with either R5Cer and/or ΔCCer (i.e. homologous constructs tagged with fluorescent protein) (Fig. 2, B and C). These data show that the full-length and truncated receptor isoforms self-associate (i.e. form aggregates), both before and after FGF2 stimulation (Fig. 2B). Association between the full-length (R5Ven) and truncated (ΔCDark) receptors further confirmed that the self-association of FGFR5 does not solely depend on the C terminus (Fig. 2C). To further quantify the oligomeric state of FGFR5, we first used live cell imaging of homologous FRET (homoFRET) (Fig. 2, D and E). Images were collected at the bottom of the cells (i.e. against the coverglass) using two-photon excitation to ensure measurement of receptor expressed at the plasma membrane (Fig. 2D). Fluorescent proteins in close proximity (i.e. within ∼5 nm) undergo homoFRET, which can be detected via a drop in the steady-state fluorescence anisotropy proportional to the oligomeric state (16). Consistently, monomeric Venus fluorescent protein exhibited significantly higher anisotropy than the Venus tandem-dimer positive control (Fig. 2E). Somewhat surprisingly, R5Ven exhibited a significantly lower anisotropy than the tandem-dimer control, suggesting that the full-length receptor expresses at the membrane in higher-order aggregates (>2 molecules/aggregate). In contrast, the truncated receptor isoform (ΔCVen) showed similar anisotropy to the tandem-dimer control. A similar trend was confirmed in the beta-cells of human islets, suggesting that the receptor aggregation state is intrinsic to the receptor and occurs across species (17) (Fig. S2). In addition to this, co-expression of excess dark truncated receptor (ΔCDark) increased the anisotropy of R5Ven to dimeric levels, suggesting that the truncated receptor only partially competes for positions in the higher-order R5Ven aggregates (Fig. 2E). Finally, FGF2 induced a small decrease in anisotropy of only the full-length receptor, suggesting that the ligand does not stimulate large-scale aggregation of FGFR5 (Fig. 2E). Overall, these data reveal that FGFR5 forms FGF2-insensitive aggregates in the absence of significant FGFR1.
Figure 2.
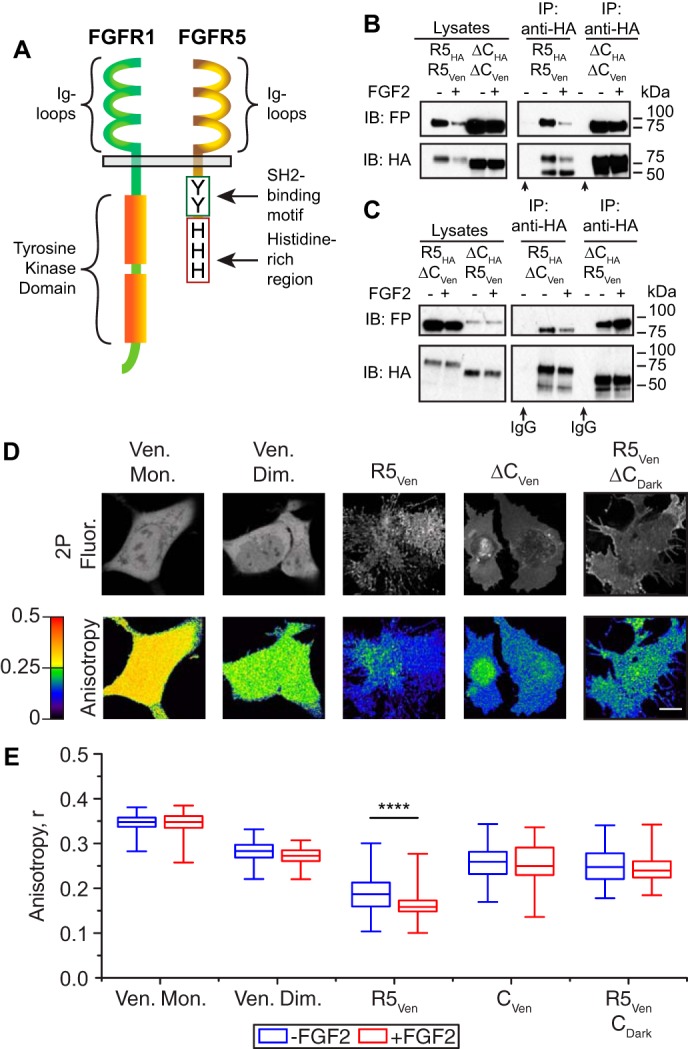
FGFR5 exists as preformed higher aggregates at the plasma membrane. A, FGFR5 exhibits extracellular ligand-binding Ig loops similar in structure to canonical FGFRs and a unique truncated noncatalytic C terminus. HA-tagged full-length FGFR5 (R5HA) or C terminus–deficient FGFR5 (ΔCHA) were co-expressed in AD293 cells at a 1:1 molar ratio with Venus-tagged constructs (R5Ven or ΔCVen) in either a homogeneous (B) or heterogeneous (C) pattern. Cultures were stimulated in the absence (−) or presence (+) of FGF2 (10 ng/ml; supplemented with heparin sulfate; 10 min). FGFR5 immunoprecipitated (IP) with variant isoforms of itself, as detected by Western immunoblotting (IB). The ability of FGFR5-ΔC to pull down FGFR5 indicates that the unique intracellular domain is not required for this molecular association. D, a panel of representative images showing 2-photon fluorescence intensity (2P Fluor.) and anisotropy image maps of AD293 cells expressing Venus monomer (Ven. Mon.), tandem Venus dimer (Ven. Dim.), R5Ven, ΔCVen, and R5Ven co-expressed with untagged FGFR5-ΔC (ΔCDark). Changes in anisotropy between the Venus monomer and dimer controls illustrate the independence of this measurement to fluorescence intensity. Scale bar, 10 μm. E, the average anisotropy of each sample in the absence (−) and presence (+) of FGF2 reveals that R5Ven forms a higher-order (n > 2) oligomer that further aggregates with FGF2 stimulation. Truncation of the intracellular domain (ΔCVen) presents a receptor with an average anisotropy value closer to the Venus dimer, independent of FGF2 stimulation. Values from n = 61–165 cells analyzed and pooled from four independent experiments performed on different days are represented as box–whisker plots. Boxes delineate the 25th and 75th percentiles, and center lines indicate the medians. Whiskers extend 1.5 times the interquartile range from the 25th and 75th percentiles. ****. p < 0.0001 based on one-way ANOVA.
FGFR5 forms a mixture of homotrimers and homodimers at the membrane
To quantify the aggregation state of FGFR5, we measured the anisotropy of Venus-tagged receptor constructs in the presence of progressively increasing amounts of dark receptor (i.e. unlabeled, competing receptor; Fig. 3). The shape of these anisotropy curves depends on whether the fluorescent protein is a monomer (no change), dimer (linear), or higher-order aggregate (exponential) (Fig. 3A). We first measured the anisotropy of full-length R5Ven when co-expressed with increasing amounts of unlabeled FGFR5 (i.e. R5Dark) (Fig. 3B). Consistent with full-length receptor being in higher-order aggregates, the anisotropy increased exponentially with decreasing R5Ven/R5Dark plasmid ratio (i.e. increasing competition by R5Dark). We subsequently used photobleaching to create enhancement curves that could be quantitatively modeled using established methods (18, 19) (Fig. 3, D and E). We first validated this technique using Venus monomer and tandem-dimer controls (Fig. 3C). Monomeric Venus showed no slope, indicating the absence of homoFRET; in contrast, the Venus tandem dimer showed a steady, linear increase in anisotropy. Subsequently, the R5Ven enhancement curve fit best to 2.73 ± 0.05 monomers/aggregate, suggesting a mixture of homotrimers (∼73%) and homodimers (∼27%). In contrast, the enhancement curve of ΔCVen fit best to 2.05 ± 0.05 monomers/aggregate consistent with primarily (>95%) homodimers (Fig. 3D). Finally, the enhancement curve of R5Ven was relatively unaffected by the addition of FGF2, suggesting no further aggregation on the scale of the Venus homo-Förster distance (∼4.95 nm) (Fig. 3E). Because homoFRET is sensitive to separation distance and thus prone to false negatives, we further validated the aggregation states of these constructs using the complementary technique of N&B analysis (20) (Fig. 3F). To quantify the aggregation state, the relative brightness of each receptor was first normalized to its corresponding monomeric control (i.e. the Venus-tagged construct in the presence of excess Cerulean-tagged construct). These data show that R5Ven and ΔCVen are 2.75 ± 0.07- and 2.07 ± 0.05-fold brighter than their respective monomers, again consistent with the full-length receptor being a mix of homotrimers (∼75%) and homodimers (∼25%), and the truncated receptor being primarily homodimers (∼93%). These data also showed that R5Ven is only 1.42 ± 0.04-fold brighter than R5Ven co-expressed with excess truncated receptor (R5Ven/ΔCCer). Because a mixture of 75% homotrimers and 25% homodimers would be 1.38-fold brighter than a pure homodimer population, our data are most consistent with the truncated receptor displacing one position in the full-length receptor homotrimer. Finally, these data show that the relative brightness of R5Ven was unaffected by FGF2, suggesting that no further aggregation of FGFR5 is driven by ligand addition (Fig. 3F). Overall, both homoFRET and N&B analysis were entirely consistent with a model where the full-length receptor forms an FGF2-insensitive mixture of homotrimers (∼75% of (FGFR5)3) and dimers (∼25% of (FGFR5)2) at the cell surface (Fig. 3G). These data suggest that the homotrimers are formed by multivalent interactions involving both the C-terminal and the extracellular/transmembrane domains. Furthermore, incomplete competition by truncated receptor suggests that the FGFR5 homotrimers are asymmetrically composed of homodimers driven by the C-terminal domain and a third monomer associated through extracellular/transmembrane interaction.
Figure 3.
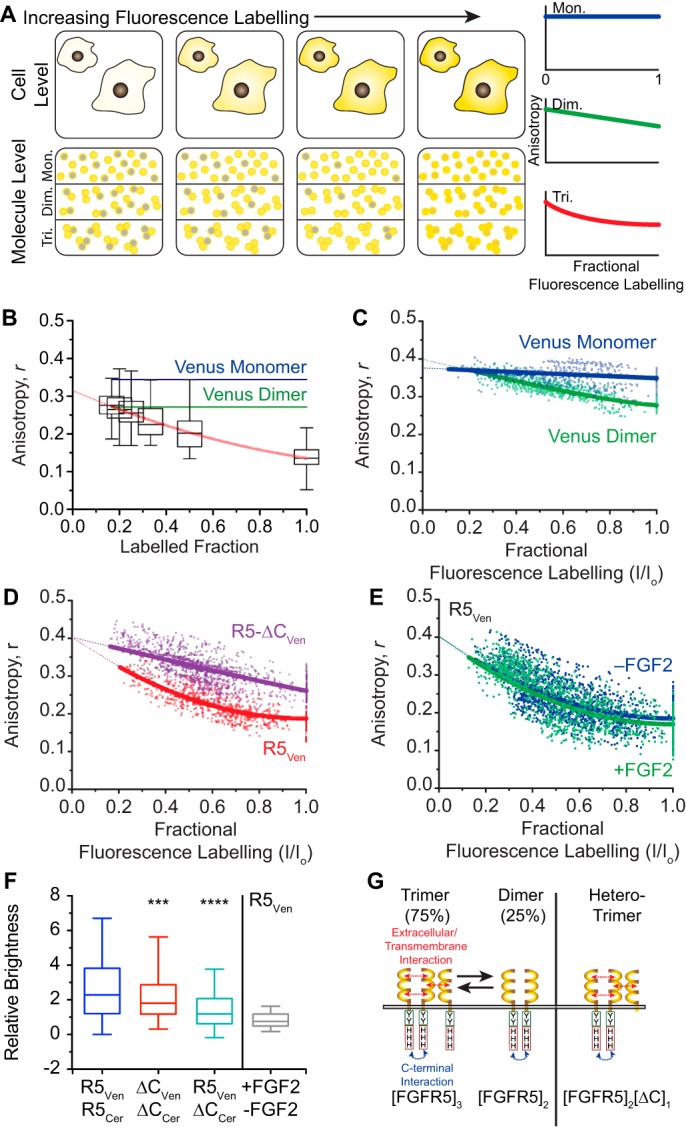
Anisotropy enhancement curves suggest that FGFR5 forms trimers. A, progressively increasing fluorescence labeling of randomly distributed populations of monomers, dimers, and trimers exhibit differences in the apparent aggregate state. These changes are reflected by the relationship between anisotropy and fluorescence labeling, where monomers (top third of bottom panel; blue curve) appear zero-order, dimers (middle third of bottom panel; green curve) appear first-order (or linear), and trimers (bottom third of bottom panel; red curve) appear second-order. B, the anisotropy of R5Ven increased when co-expressed with increasing amounts of R5Dark (i.e. untagged R5), reflecting a decrease in the fluorescence-labeled fraction. The line of best fit is shown in red. Values from n = 87–162 cells analyzed from three independent experiments performed on different days are represented as box–whisker plots. C, enhancement curves constructed with anisotropy measurements from time series images of AD293 cells expressing Venus monomer and Venus dimer controls that were progressively photobleached after each image acquisition. The slope of the line of best fit for Venus monomer was relatively flat, whereas Venus dimer exhibited a first-order relationship. D, anisotropy enhancement curves for R5Ven exhibited a curve of best fit that approximated a trimeric oligomerization state (2.73 ± 0.05 monomers/aggregate), whereas R5-ΔCVen is best approximated as a dimeric state (2.05 ± 0.05 monomers/aggregate). E, the R5Ven enhancement curve profile is similar in the absence (blue) or presence (green) of FGF2. Enhancement curve data were constructed by analyzing between 18 and 95 cells through 11 frames within a photobleach sequence from three independent experiments performed on different days. F, relative brightness values for Venus-tagged constructs expressed in the absence and presence of Cerulean-tagged constructs suggest that R5Ven is a trimer (blue) and ΔCVen is a dimer (red) and that co-expression of ΔCCer forces R5Ven to undergo a trimer-to-dimer (3 to 2) transition (green). The relative brightness of R5Ven expressed alone in the presence versus absence of FGF2 (gray) revealed no change in the aggregation state. Values from n = 53–163 cells/experiment are represented as box–whisker plots. Boxes delineate the 25th and 75th percentiles, and center lines indicate the medians. Whiskers extend 1.5 times the interquartile range from the 25th and 75th percentiles. *** and ****, p < 0.001 and p < 0.0001, respectively, based on one-way ANOVA. G, model depicting a mixture of FGFR5 homotrimers and homodimers on the plasma membrane. The homotrimer is formed by both C-terminal and extracellular/transmembrane interaction, whereas the stable homodimer is due to C-terminal interaction.
FGFR1 forms heteroaggregates with FGFR5
Interaction between FGFR5 and classical FGFR isoforms was explored previously using heteroFRET (15); however, the association between FGFR5 with either FGFR3 or FGFR4 was inconclusive. To investigate the interaction between FGFR5 and FGFR1, we again used a combination of classical and quantitative methods (Fig. 4 and Table 1). Co-immunoprecipitation of HA-tagged and Venus-tagged receptors identified heteroaggregates of FGFR5 and FGFR1 formed in the absence and presence of FGF2 (Fig. 4A). Endogenous FGFR5 could also be pulled down by immunoprecipitation of endogenous FGFR1, consistent with their association not being due to ectopic expression (Fig. 4B). To quantify the stoichiometry of these interactions, we continued to use a combination of homoFRET, heteroFRET, and N&B analysis (Fig. 4, C–F). Anisotropy imaging showed higher R5Ven steady-state anisotropy when co-expressed with R1Dark, but these values did not reach monomeric levels (black line), and no further change was induced by the addition of FGF2 (Fig. 4C). These data suggest that FGFR1 only partially dissolves FGFR5 homotrimers to homodimers and that ligand addition does not subsequently aggregate the homodimers, at least not within the Förster distance of ∼4.95 nm. The anisotropy enhancement curves for R5Ven shifted from exponential to linear in the presence of R1Dark, consistent with the formation of 2:1 FGFR5/FGFR1 heterotrimers (Fig. 4D). To explore the structure further, we used heteroFRET imaging to measure the average separation distance between FGFR5 units in the homotrimer and various heterocomplexes (Table 1). This imaging showed that the average separation distance between FGFR5 units in the homotrimer was 5.51 ± 0.05 nm. Consistent with the receptor heterocomplex containing multiple FGFR5 units, we also detected heteroFRET between FGFR5 subunits when co-expressed with FGFR1Dark and truncated FGFR5 (ΔCDark) with an average separation distance of 5.61 ± 0.01 and 5.82 ± 0.07 nm, respectively. To confirm the stoichiometry of FGFR5 and FGFR1 interaction, we measured the molecular brightness of R5Ven relative to co-expression with dark FGFR1 (R1Cer) using complementary N&B analysis (Fig. 4E). These data show that R5Ven alone was 1.45 ± 0.05-fold brighter compared with co-expression with R1Cer, consistent with the formation of heterotrimers ((FGFR5)2/(FGFR1)1). Notably, FGF2 induced a nearly 2-fold increase in the apparent brightness of R5Ven when co-expressed with R1Cer, consistent with ligand-induced dimerization of the heterocomplex ((FGFR5)4/(FGFR1)2). This FGF2-induced response contrasted with the lack of response detected by homoFRET and suggests that the two FGFR5 dimers of the signaling complex are separated beyond the Förster distance (>5 nm). To examine the heterocomplex from the perspective of FGFR1, we examined the brightness of R1Ven when co-expressed with “dark” FGFR1 (R1Cer) and FGFR5 (R5Cer). We previously showed that FGFR1 forms non-FRETing preformed homodimers (20). Consistently, R1Ven was 2.0 ± 0.1-fold brighter than the corresponding monomeric control (i.e. when co-expressed with R1Cer). Our data also show that R1Ven was 1.9 ± 0.1-fold brighter alone than when co-expressed with dark FGFR5 (R5Cer), suggesting a single FGFR1 per heterocomplex (Fig. 4F). Combined, our data suggest that FGFR5 and FGFR1 form a 2:1 heterocomplex that aggregates to a 4:2 complex in the presence of FGF2 (Fig. 4G). Furthermore, the two FGFR5 dimers in the signaling complex are potentially separated by the one FGFR1 dimer and beyond the homoFRET distance (>4.95 nm).
Figure 4.
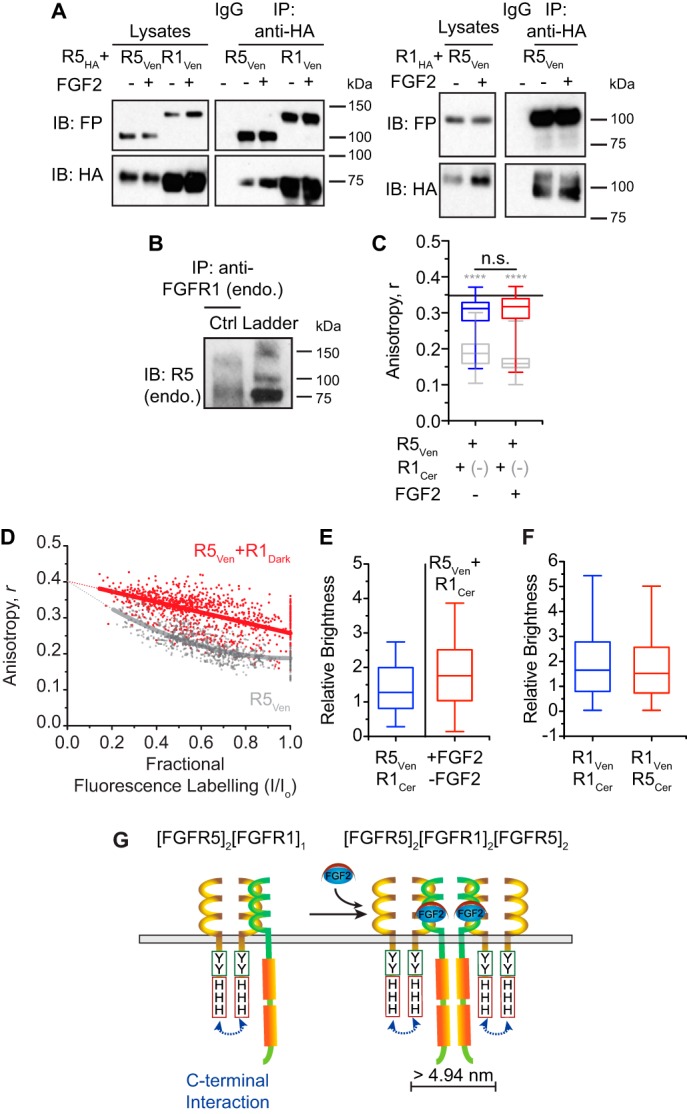
FGFR5 forms a heterocomplex with FGFR1 that responds to FGF2 ligand stimulation. A, left blots, HA-tagged R5 (R5HA) was co-expressed with Venus-tagged R5 (R5Ven) or R1 (R1Ven). Right blots, HA-tagged R1 (R1HA) was co-expressed with R5Ven. Cells were stimulated in the absence (−) or presence (+) of FGF2 (10 ng/ml; supplemented with heparin sulfate; 10 min). Co-immunoprecipitation (IP) with anti-HA antibodies and Western immunoblotting (IB) for the fluorescent protein (FP) reveal an association between FGFR5 and FGFR1. No changes were observed in the presence of ligand stimulation by this method. B, immunoprecipitation with anti-FGFR1 antibody and Western immunoblotting for FGFR5 reveal an association between endogenous FGFR5 and FGFR1. C, anisotropy values of AD293 cells expressing R5Ven and R1Dark at a 1:2 ratio in the absence (blue) and presence (red) of FGF2. The anisotropy of Venus monomer is indicated as a black line, and R5Ven is indicated as gray box–whisker plots as previously presented in Fig. 2E. Values from n = 59–67 cells analyzed from three independent experiments performed on different days are represented as box–whisker plots. **** (gray), p < 0.0001 between R5Ven (gray) and R1Cer in the absence (blue) or presence (red) of FGF2; n.s., indicates no significant difference between the absence (blue) and presence (red) of R5Ven + R1Cer by one-way ANOVA. D, anisotropy enhancement curve produced by progressive photobleaching of AD293 cells expressing R5Ven + R1Dark (red) overlaid on an enhancement curve from cells expressing R5Ven (gray; previously represented in Fig. 3D) reveals a trimer-to-dimer transition upon co-expression of R1Dark. E, the relative brightness comparing R5Ven in the absence and presence of Cerulean-tagged FGFR1 (R1Cer) also suggests a trimer-to-dimer (3 to 2) transition. The relative brightness of cells co-expressing R5Ven with R1Cer in the presence versus absence of FGF2 suggests a doubling of the aggregate. Values from n = 167–213 cells analyzed from five independent experiments performed on different days are represented as box–whisker plots. F, relative brightness comparing R1Ven in the absence versus presence of either R1Cer or R5Cer indicates that FGFR5 co-expression forces a dimer-to-monomer transition (2 to 1) of FGFR1 aggregates. Values from n = 78–92 cells analyzed from four independent experiments performed on different days are represented as box–whisker plots. Boxes delineate the 25th and 75th percentiles, and center lines indicate the medians. Whiskers extend 1.5 times the interquartile range from the 25th and 75th percentiles. G, model depicting FGFR5 and FGFR1 interaction at the plasma membrane. FGFR5 and FGFR1 form a 2:1 heterocomplex ((FGFR5)2/(FGFR1)1) that further aggregates to a 4:2 heterocomplex upon stimulation with FGF2 ((FGFR5)4/(FGFR1)2). The inability to detect FGF2-induced aggregation by FGFR5 homoFRET but observation by N&B analysis of both FGFR5 and FGFR1 suggests that FGFR5 homodimers are on the opposite side of the complex ((FGFR5)2/(FGFR1)2/(FGFR5)2), separated by >4.95 nm.
Table 1.
HeteroFRET between Venus- and Cerulean-tagged FGFR5 confirms FGFR5 dimers in the receptor heterocomplex
HeteroFRET measurements between R5Ven and R5Cer in the absence (column 2) and presence of either R1Dark (column 3) or ΔCDark (column 4) continue to show FGFR5 FRET efficiency, suggesting that FGFR1 displaces only one unit in the FGFR5 homotrimers (i.e. the “replaceable” receptor). n = 24–30 cells analyzed.

Discussion
FGFR5 is the most recently discovered member of the FGFR family whose physiological role remains to be defined. Initially identified by expression in the pancreas and other tissues (21), the structure of FGFR5 suggested a regulatory function by inhibiting the signaling capacity of other canonical FGFRs (8, 15). However, a number of studies have revealed a more active role for FGFR5. This includes our work in pancreatic beta-cells, which has suggested that FGFR5 promotes FGFR1-induced insulin biosynthesis and cell adhesion, but not proliferation (5). We therefore aimed to determine how FGFR5 impacts beta-cell FGFR1 activity (2, 3, 22). Overall, our study explores the molecular interaction between FGFR5 and FGFR1 at the plasma membrane and shows the two receptors form a signaling complex. In beta-cells, we postulate that inflammation up-regulates FGFR5 to facilitate this signaling complex and promote survival.
We showed that FGFR5 expression is elevated in the islets of 16-week-old nondiabetic mice from the NOD background. In this mouse model, immune cells invade the islet and release pro-inflammatory cytokines, such as IL-1β, TNFα, and IFN-γ (23). Consistently, we detected increased transcript and protein expression in cytokine-treated mouse and human islets. In contrast, FGFR5 expression was unaffected by glucolipotoxicity, suggesting that the receptor response is specific to inflammation and not a general stress responder. Because beta-cells also express FGFR1, an increase in FGFR5 would potentiate their interaction at the plasma membrane. Consistently, knockdown of FGFR5 and FGFR1 using siRNA resulted in significantly greater cell death induced by pro-inflammatory cytokines. We previously showed that FGFR5 overexpression increases basal ERK1/2 phosphorylation and tends to increase FGF2-stimulated MEK1/2-independent activation of ERK1/2 (5). Together, our findings suggest a potential link between FGFR5 and beta-cell survival through a MEK1/2-independent pathway (24).
We first measured the molecular aggregation of FGFR5 using a combination of biochemical assays and live cell imaging. FGFR5 shows strong sequence homology and predicted structural homology to the extracellular region of FGFRs (7, 21), yet weakly binds the conventional FGFR1 ligand FGF2 (7). Our co-immunoprecipitation and homoFRET data confirmed the self-association of FGFR5, consistent with previous work showing co-immunoprecipitation of recombinant FGFR5 peptides (15). We next turned to the complementary live cell imaging techniques of homoFRET and N&B analysis to quantify the interaction. These two methods were entirely consistent in showing that FGFR5 exists at the plasma membrane as a mixture of ∼75% homotrimers and ∼25% homodimers. In addition to this, only one monomer in the homotrimer was displaced by truncated FGFR5 or full-length FGFR1. We therefore postulate that FGFR5 homodimers are predominantly expressed at lower receptor concentrations and/or when FGFR1 is available. Our data also suggest that the stable homodimers of FGFR5 are driven by the C-terminal tail. We showed previously that the C-terminal tail, and particularly the Src homology 2–binding domain, directed receptor membrane localization, SHP-1 phosphatase binding, and downstream signaling (5). Thus, we postulate that high-affinity association of FGFR5 homodimers could be indirectly due to the binding of bivalent adaptor proteins, such as SHP-1. Alternatively, the histidine-rich region has been shown to chelate Zn2+ ions and thus may more directly coordinate receptor aggregation. Future studies will explore these potential interactions using constructs with staggered truncations as well as point mutations. Finally, both techniques showed FGFR5 homooligomers are insensitive to FGF2, which is consistent with weak binding affinity for this ligand (7, 25).
We subsequently examined the molecular interaction between FGFR5 and FGFR1 as the receptors most relevant to beta-cell physiology (2, 3, 22, 26). FGFR5 has been previously proposed to interact with other FGFRs (6, 27) and specifically shown to interact with FGFR4 in zebrafish (28). In contrast, another study suggested limited interaction between full-length FGFR5 and kinase-deficient variants of FGFR3 and FGFR4 (15). However, this work depended on FRET to detect the interaction, a technique prone to false negative results, and depended on C-terminal truncations that could have reduced the interaction. To measure interaction between full-length receptors, we used the complementary techniques of homoFRET and N&B analysis. These advanced imaging methods also allowed us to explore the association from the perspective of both receptors. Our data suggest that co-expression of the full-length receptors results in a 2:1 FGFR5/FGFR1 heterotrimer. HeteroFRET between FGFR5 units in the complex further confirmed aggregation of multiple FGFR5 units. The addition of FGF2 drove formation of larger aggregates; the heterotrimers responded to FGF2 by forming a signaling complex composed of a 4:2 ratio of FGFR5/FGFR1. This aggregation was observed by a doubling in the molecular brightness of both FGFR5 and FGFR1 but was undetectable using homoFRET of FGFR5. This combination of data suggests that FGFR5 dimers in the signaling complex are separated beyond the Förster distance (>4.95 nm), potentially by FGFR1 dimers at the core of the signaling complex ((FGFR5)2/(FGFR1)2/(FGFR5)2). We suggest that this structure allows FGFR5 to block/assist in the docking of adaptor molecules to FGFR1, thus modulating downstream signaling. In beta-cells, FGFR5 expression modulates FGFR1 response toward survival during inflammatory stress. Under these same conditions, we observed an increase in endogenous FGFR5 expression. Future studies will need to explore how FGFR5 competes with other potential co-receptors (e.g. KLB (4, 20, 29)) and neuronal cell adhesion molecule (26)) to orchestrate FGFR1 activity. This normal competition between co-receptors likely accounts for the wide range of responses attributed to FGFR1. In beta-cells, our data suggest that cytokine-induced inflammation increases FGFR5 expression to compete for binding to FGFR1 and to support survival.
In summary, these studies have identified a role for FGFR5 in pro-inflammatory cytokine–induced stress as a co-receptor for FGFR1. In the absence of FGFR1, FGFR5 resides on the plasma membrane as a mixture of homotrimers and homodimers due to multivalent interactions. Interestingly, the C-terminal domain appears to drive a central homodimer with competition between FGFR5 and FGFR1 for the third position. These results and our previously published data suggest that FGFR5 and FGFR1 form a FGF2-sensitive co-receptor complex ((FGFR5)2/(FGFR1)1). These interactions may ultimately have therapeutic potential to withstand the progression of autoimmune conditions such as type 1 diabetes and the inflammation of beta-cells during type 2 diabetes.
Experimental procedures
Cell culture and transfection
All cell lines were maintained in medium at 37 °C under humidified 5% CO2. βTC3 cells were maintained in DMEM supplemented with 4.5 g/liter glucose, 15% horse serum, 5% FBS, and 5 units/ml penicillin/streptomycin (P/S). AD293 cells were maintained in DMEM supplemented with 4.5 g/liter glucose, 10% FBS, and 5 units/ml P/S. Cytokine treatment used medium supplemented with 50 units/ml IL-1β, 750 units/ml IFN-γ, and 1000 units/ml TNFα (30). Glucolipotoxicity treatment included supplementing DMEM-based culture medium (containing 25 mm glucose) with 0.4 mm palmitate. Palmitate was prepared first by creating a 100 mm stock of dissolved in 0.1 m NaOH at 70 °C followed by further dilution to a 2 mm stock dissolved in 2% fat-free BSA at 50 °C. Plasmids were transfected into AD293 cells using the commercial lipid cation carrier PolyJet (Signagen Laboratories) in a 3:1 Polyjet (μl):DNA (μg) ratio following the manufacturer's protocol. Cells were incubated with DNA-PolyJet–containing medium for 24 h before experimentation. Similarly, SMARTpool for scramble, FGFR1, and FGFR5 ON-TARGETplus mouse siRNAs (Dharmacon, CO) were transfected into βTC3 cells using the commercial lipid cation carrier Lipofectamine RNAiMAX (Life Technologies). Cells were incubated in the siRNA complex containing medium for 5 days before experimentation.
Molecular biology
The fluorescent protein–tagged receptors (Cerulean and Venus) were described previously: FGFR5 (5) and FGFR1 (20, 22). Dark receptor constructs lacking fluorescent protein tags were created from each of these constructs by introducing a stop codon between the receptors and fluorescent protein using homologous recombination and the AgeI restriction site. HA-tagged full-length FGFR1 (R1HA), FGFR5 (R5HA), and the truncated variant of FGFR5 (ΔCHA) were cloned from the relevant construct upstream of the fluorescent protein into a pShuttle-IRES-hrGFP-2 vector (Agilent) using the NheI and XhoI restriction sites and the following primers: FGFR5-FL/ΔC-NheI (sense), 5′-GCATAGCTAGCCGCCGCCATGACGCCGAGC-3′; FGFR5-FL-XhoI (antisense), 5′-CGCTAGTACCTCGAGGCCGCACTGATAGTGGATGTGC-3′; FGFR5-ΔC-XhoI (antisense), 5′-CGCGTCATGCTCGAGTGTGCACGGCTTCTT-3′; FGFR1-NheI (sense), 5′-GCATAGCTAGCCGCCGCCATGTGGAGTTGGAAGAGC-3′; FGFR1-XhoI (antisense),5′-GCAGGCGCATACTCGAGTCGGCGTTTGAGTCCG-3′. All final constructs were confirmed by sequencing.
Adenovirus was produced by first creating a shuttle vector based on the pShuttle plasmid provided in the AdEasy XL Adenoviral system (Agilent). This new vector includes the cytomegalovirus enhancer region and rat insulin promoter (22) and a multiple cloning site containing NheI, XhoI, NotI, and HindIII restriction sites followed by the simian virus 40 poly(A) tail. Venus, R5Ven, and ΔCVen were cloned into this vector using the NheI and NotI restriction sites. The shuttle vector was incorporated into the pAdEasy-1 adenovirus genome vector by in vivo homologous recombination as per the manufacturer's protocol. Five micrograms of the vectors were transfected with PolyJet per P100 plate of AD293 cells. Primary adenovirus was collected following four rounds of freeze–thaw cycles after 10 days of cell growth. After a second round of amplification where AD293 cells were infected with primary adenovirus (1:10 dilution), viral particles were collected from cell culture supernatants. Viral titers were measured using the Adeno-X rapid titer kit (Clontech) following the manufacturer's protocol.
Human islets and adenoviral transduction
Human islets from review board–approved healthy donors were provided by the Islet Core (University of Alberta, Alberta, Canada) (31). Islets were loaded into a microfluidic device designed for HEAT-on-a-chip (i.e. highly efficient adenoviral transduction) (17). Briefly, transduction medium (RPMI 1640 supplemented with 11 mm glucose, 10 mm HEPES, 10% FBS, and 5 units/ml P/S, 2 mm EDTA) supplemented with 2.61 × 10⁷ infectious units/ml of adenovirus was flowed through islet-loaded devices at 200 μl/h for 75 min. Recovery medium (DMEM containing 1 g/liter glucose, 10% FBS, and 5 units/ml P/S) was subsequently flowed for 15 min at 200 μl/h before the islets were removed from the device and handpicked into 2 ml of fresh recovery medium. One day post-recovery, the islets were reloaded into the same microfluidic device and imaged with imaging medium (125 mm NaCl, 5.7 mm KCl, 2.5 mm CaCl2, 1.2 mm MgCl2, 10 mm HEPES, 11 mm glucose, and 0.1% BSA, pH 7.4) flowing at 400 μl/h.
Steady-state fluorescence anisotropy imaging of homoFRET
Steady-state fluorescence anisotropy imaging was done using a Zeiss LSM710 laser-scanning confocal microscope equipped with a tunable Ti:Saph laser (Chameleon-HP, Coherent). Islets were imaged using a ×40/1.3 NA oil immersion EC Plan NeoFluar lens, whereas cultured cells were imaged using a ×63/1.4 NA oil immersion Plan-Apochromat lens. Steady-state fluorescence anisotropy images of the Venus fluorescent protein constructs were collected using 950-nm two-photon excitation and simultaneous collection of the parallel and perpendicular fluorescence emission using a nondescanned detector equipped with a 500–550-nm emission bandpass filter (Chroma) and polarizing beamsplitter (Edmund Optics). Images were processed as described previously using ImageJ (National Institutes of Health) to select regions of interest from individual cells (32). To quantify the degree of oligomerization, enhancement curves were collected and analyzed based on methods described previously (18, 19). Briefly, an initial anisotropy image was collected, followed by a 10-frame series of sequential photobleaching (514 nm at 6–40% laser power) and steady-state fluorescence anisotropy imaging (950-nm excitation, 400–550-nm emission). The mean anisotropy of individual regions of interest was plotted against the relative photobleached fluorescence intensity (i.e. the fluorescence intensity of the current frame (I) relative to fluorescence intensity of the initial frame (Io)), where I = Ipara + 2Iperp (18). The curves were fit to the following model (19).
| (Eq. 1) |
Here, rm is the anisotropy of noninteracting monomeric fluorophores, x is the constant fraction of fluorescence from noninteracting fluorophores, f is the fraction of fluorescence labeling of the fluorophore population (I/Io), and N is the integer describing the degree of oligomerization. Values for the N and x parameters were fit using Origin version 8 SR0 software (OriginLab, Northampton, MA).
HeteroFRET analysis and molecular distance measurements
HeteroFRET imaging was performed on cells transfected with molar equivalents of Cerulean-tagged (R5Cer) and Venus-tagged FGFR5 (R5Ven) plasmid in the presence or absence of dark (i.e. unlabeled) FGFR1 (R1Dark) or C-terminal truncated FGFR5 (ΔCDark). The cells were imaged using a Ti:Saph laser tuned to 800 nm to preferentially excite Cerulean fluorescent protein. The emission spectrum (413–623 nm) was imaged in 10-nm increments, scanning three channels at a time. The images were unmixed using the built-in Linear Un-mixing module of the Zen 710 software and were based on similarly collected Venus and Cerulean fluorescent protein reference spectra. The unmixed intensities were used to calculate the FRET efficiency (E = IA/(ID + IA), where ID and IA are the donor and acceptor fluorescence intensities, respectively (33). The approximate FRET distance (R) was determined using the following.
| (Eq. 2) |
Here, R0 is the Förster distance for the fluorescent protein pairing. In the case of Cerulean and Venus pairing, we used a Förster distance of 5.40 nm (34).
N&B analysis
N&B analysis was performed as described previously (20, 32). This technique noninvasively measures the molecular brightness of fluorescent protein constructs based on intensity fluctuations of individual pixels over an image series to ultimately determine aggregation state (e.g. trimers are 3 times brighter than monomers). Cells were transfected with Venus-tagged constructs and Cerulean-tagged constructs as indicated. The apparent brightness (B/S) of the Venus-tagged construct of each cell was determined from an image series.
| (Eq. 3) |
Here, σ2 and μ represent the variance and mean fluorescence intensity, respectively, of individual pixels over time. The variables of offset (digital level of detector), σo2 (dark current noise), and S (a conversion factor between number of photons and the digital level of detector) represent calibration factors to correct for analogue detection (20). Each image series was composed of 50 frames (256 × 256 pixels, 0.18 μm/pixel, dwell time of 12.61 μs, and frame time of 3.31 s) and was collected on a LSM710 confocal microscope using the ×63/1.4 NA oil immersion lens, 514-nm excitation, and 519–621-nm emission. In this setup, only Venus fluorescence was measured, and the Cerulean constructs were dark (i.e. Cerulean is not excited significantly by 514-nm excitation, and the emission window is centered on Venus). The image series were analyzed in ImageJ using a custom-built macro to determine the apparent brightness for each cell (20). The mean apparent brightness for each treatment was determined from at least 10 cells/treatment pooled from at least three separate experimental days.
RT-PCR and qPCR
RNA from βTC3 cells was collected using the RNeasy minikit (Qiagen) and quantified using a nanoQuant 2000 (Thermo Scientific). Each RNA template (0.5 μg) was reverse transcribed using the High Capacity cDNA reverse transcription kit (Applied Biosystems) following the manufacturer's protocol. Oligonucleotide primers were designed to target a 171-bp region common to both splice variants of murine fgfrl1 (GenBankTM accession numbers NM_054071.2 and NM_001164259.1; exons 5–6 or 4–5, respectively; 5′-GACCAGACCTTGACGCATCT-3′ (sense) and 5′-GGAACGAGTCCGCTGGATTA-3′ (antisense)). The antisense primer was designed to straddle an exon–exon junction. A 140-bp-long amplicon of the reference transcript glyceraldehyde-3-phosphate dehydrogenase (gapdh) was amplified as a positive control using sense (5′-CCCTGTTGCTGTAGCCGTAT-3′) and antisense (5′-TGAGGACCAGGTTGTCTCCT-3′) primers. Duplicate reaction volumes were prepared on a white 384-well plate (Roche Applied Science) using 4 μl of diluted templates and 6 μl of reaction reagents (2X Fast start Universal SYBR Green master mix supplemented with the specific primer pairs). Standard curves were constructed with serial dilutions of gel-extracted PCR products of the specified amplicons. Reactions were performed using a LightCycler® 480 instrument with the following cycling parameters: pre-incubation at 95 °C for 600 s; 45 cycles of 1) 95 °C for 10 s, 2) 60 °C for 10 s, 3) 72 °C for 15 s; melting starting at 60 °C to 97 °C with ramping at 0.2 °C/s. The efficiency of fgfrl1 amplification was 2.04, and efficiency of gapdh amplification was 1.98, with Cq values calculated based on the second derivative method. Values were plotted as -fold changes in relative mRNA expression of fgfrl1 to gapdh between control and treated cells.
Immunoprecipitation
Fluorescent protein– and HA–tagged constructs were isolated as described previously (5). All harvested cells were lysed in 200 μl of lysis buffer (1% Triton X-100, 100 mm sodium chloride, 50 mm HEPES, 5% glycerol, protease inhibitor mixture, and PhosphoSTOP phosphatase inhibitor (Roche Applied Science)), of which 190 μl was subjected to immunoprecipitation. A mouse monoclonal anti-HA tag primary antibody (BioLegend), mouse IgG (1:200; Santa Cruz Biotechnology), rabbit polyclonal FGFR5 (H-300) antibody (1:100; Santa Cruz Biotechnology), or rabbit monoclonal FGFR1 (D8E4) antibody (1:50; Cell Signaling Technology) was added, and the samples were incubated at 4 °C on a rocking platform for 24 h before the addition of Protein A–agarose beads (Invitrogen) for an additional 24 h. Samples were washed five times before being boiled in SDS loading buffer (20 μl/sample) for Western immunoblot analysis using rabbit polyclonal Living Colors anti-fluorescent protein (1:500; Clontech), mouse monoclonal anti-HA tag (1:2000; BioLegend), rabbit polyclonal FGFR5 (H-300) (1:500; Santa Cruz Biotechnology), and rabbit monoclonal FGFR1 (D8E4) (1:1000; Cell Signaling Technology) antibodies. Membranes were subsequently incubated with horseradish peroxidase–linked anti-rabbit or anti-mouse secondary antibodies (1:2000; Cell Signaling Technology).
Western immunoblotting
Cytokine or PBS (control)-treated βTC3 cells and human islets (25 islets/treatment) were washed with PBS, centrifuged, and resuspended in lysis buffer as described previously (5). Twenty micrograms of whole βTC3 cell lysate or total islet preparation was loaded per well of 7.5% Tris-glycine gels. Proteins were transferred to nitrocellulose membranes that were subsequently blocked (5% BSA/TBS-T, 1 h, RT) and incubated overnight (4 °C) with the following antibodies diluted in blocking solution: FGFR5 (H-300) antibody (1:500; Santa Cruz Biotechnology) and GAPDH (1:2000; Santa Cruz Biotechnology). Blots were subsequently incubated with horseradish peroxidase–linked anti-rabbit and anti-mouse secondary antibodies (1:2000; Cell Signaling Technology).
Flow cytometry
βTC3 cells were seeded on 6-well plates and incubated for 5 days at 37 °C in 5% CO2 with siRNA in 1 ml of culture medium. The medium was replaced with fresh culture medium containing cytokines (50 units/ml IL-1β, 750 units/ml IFN-γ, and 1000 units/ml TNFα) and/or 10 ng/ml recombinant human FGF2 (R&D Systems; supplemented with 10 units/ml heparin sodium salt (Sigma-Aldrich)) where indicated for an additional 24 h. Positive control cells were treated with 10 mm H2O2 for 6 h before staining while negative control cells were untreated. Culture supernatants containing nonadherent cells were pooled with trypsin/EDTA–treated cells before staining with Annexin V–APC and 7-AAD (BioLegend) following the manufacturer's protocol. Unstained βTC3 cells and βTC3 cells treated with H2O2 stained with Annexin V–APC or 7-AAD only were used as compensation controls. Flow cytometry was performed on an LSRFortessa cytometer (BD Biosciences), and plots were analyzed on Single Cell Analysis software (FlowJo).
Statistical analysis
Experiments were repeated a minimum of three times, as indicated. Statistical analysis was performed using Prism version 5 (GraphPad Software, La Jolla, CA). Data are presented as box-and-whisker plots for large data sets (>30 data points) or as bar graphs (mean ± S.D.) for smaller datasets (<30 data points) (35). Graphs were plotted either in Prism 5 or Origin 8 SR0 software (OriginLab, Northampton, MA). Significant differences were analyzed using either unpaired two-sample two-tailed t tests or one-way analysis of variance (ANOVA) followed by Bonferroni's multiple-comparison test.
Immunofluorescence
Murine pancreas sections from female adult NOD and age-matched BALB/c control mice (10–12 weeks of age) were prepared as described previously (36). All procedures were performed with ethical approval of the animal care committee of Western University in accordance with the guidelines published by the Canadian Council on Animal Care. Slides were deparaffinized in xylene followed by rehydration in a 100 to 70% series of ethanol in water. Heat-activated epitope retrieval was performed by heating slides to 95 °C for 7 min. Sections were permeabilized in 0.1% Triton X-100 and blocked in 5% normal goat serum for 2 h at RT before incubation in rabbit anti-FGFR5 antibody (1:100; Thermo Scientific; 4 °C overnight). Sections were subsequently washed in PBS before incubation at RT for 1 h in Alexa Fluor 660–conjugated anti-rabbit antibody (1:500; Molecular Probes). Sections were first incubated simultaneously with guinea pig anti-insulin (1:1000; Linco) and mouse anti-glucagon (1:1000; Sigma) antibodies for 1 h at RT. Following three 5-min washes in PBS, sections were incubated simultaneously with Alexa Fluor 488–conjugated anti-guinea pig and Alexa Fluor 546–conjugated anti-mouse antibodies (1:500; Molecular Probes) for 1 h at RT. Finally, sections were incubated with DAPI (1:1000) for 5 min at RT before sealing with a coverslip in mounting medium (Thermo Scientific). Samples were imaged using an LSM 710 confocal microscope and a ×40/1.3 NA oil immersion lens with sequential 633-nm excitation and 647–759-nm emission (FGFR5), 488-nm excitation and 493–556-nm emission (insulin), 543-nm excitation and 548–644-nm emission (glucagon), and 810-nm excitation and 379–478-nm emission (DAPI).
Author contributions
P. N. S., D. M. K., and J. V. R. designed the experiments. R. R., P. N. S., and H. H. C. performed the experiments and analyzed the corresponding results. E. J. A. provided tissue samples and insight into mouse models. A. I. S. and J. A. provided expertise in qPCR and flow sorting (respectively) and helped analyze the results. P. N. S. wrote the paper with J. V. R. and D. M. K.
Supplementary Material
This work was supported by the National Engineering and Research Council (NSERC) of Canada and a Percy Edward Hart and Erwin Edward Hart Professorship through the Faculty of Applied Science and Engineering, University of Toronto (to J. V. R.). Stipend support was provided by NSERC (to P. N. S.) and the University of Toronto Banting and Best Diabetes Center (to R. R.). The authors declare that they have no conflicts of interest with the contents of this article.
This article contains Figs. S1 and S2.
- FGFR
- fibroblast growth factor receptor
- FGF2
- fibroblast growth factor-2
- homoFRET and heteroFRET
- homologous and heterologous FRET
- N&B
- number and brightness
- DAPI
- 4′,6-diamidino-2-phenylindole
- NOD
- nonobese diabetic
- TNF
- tumor necrosis factor
- IFN
- interferon
- IL
- interleukin
- 7-AAD
- 7-aminoactinomycin D
- HA
- hemagglutinin
- DMEM
- Dulbecco's modified Eagle's medium
- P/S
- penicillin/streptomycin
- NA
- numerical aperture
- qPCR
- quantitative PCR
- RT
- room temperature
- ANOVA
- analysis of variance
- APC
- allophycocyanin.
References
- 1. Suh J. M., Jonker J. W., Ahmadian M., Goetz R., Lackey D., Osborn O., Huang Z., Liu W., Yoshihara E., and van Dijk T. H., Havinga R., Fan W., Yin Y. Q., Yu R. T., Liddle C., et al. (2014) Endocrinization of FGF1 produces a neomorphic and potent insulin sensitizer. Nature 513, 436–439 10.1038/nature13540 [DOI] [PMC free article] [PubMed] [Google Scholar]
- 2. Wang H., Iezzi M., Theander S., Antinozzi P. A., Gauthier B. R., Halban P. A., and Wollheim C. B. (2005) Suppression of Pdx-1 perturbs proinsulin processing, insulin secretion and GLP-1 signalling in INS-1 cells. Diabetologia 48, 720–731 10.1007/s00125-005-1692-8 [DOI] [PubMed] [Google Scholar]
- 3. Hart A. W., Baeza N., Apelqvist A., and Edlund H. (2000) Attenuation of FGF signalling in mouse β-cells leads to diabetes. Nature 408, 864–868 10.1038/35048589 [DOI] [PubMed] [Google Scholar]
- 4. Sun M. Y., Yoo E., Green B. J., Altamentova S. M., Kilkenny D. M., and Rocheleau J. V. (2012) Autofluorescence imaging of living pancreatic islets reveals fibroblast growth factor-21 (FGF21)-induced metabolism. Biophys. J. 103, 2379–2388 10.1016/j.bpj.2012.10.028 [DOI] [PMC free article] [PubMed] [Google Scholar]
- 5. Silva P. N., Altamentova S. M., Kilkenny D. M., and Rocheleau J. V. (2013) Fibroblast growth factor receptor like-1 (FGFRL1) interacts with SHP-1 phosphatase at insulin secretory granules and induces beta-cell ERK1/2 protein activation. J. Biol. Chem. 288, 17859–17870 10.1074/jbc.M112.440677 [DOI] [PMC free article] [PubMed] [Google Scholar]
- 6. Wiedemann M., and Trueb B. (2000) Characterization of a novel protein (FGFRL1) from human cartilage related to FGF receptors. Genomics 69, 275–279 10.1006/geno.2000.6332 [DOI] [PubMed] [Google Scholar]
- 7. Sleeman M., Fraser J., McDonald M., Yuan S., White D., Grandison P., Kumble K., Watson J. D., and Murison J. G. (2001) Identification of a new fibroblast growth factor receptor, FGFR5. Gene 271, 171–182 10.1016/S0378-1119(01)00518-2 [DOI] [PubMed] [Google Scholar]
- 8. Trueb B., Zhuang L., Taeschler S., and Wiedemann M. (2003) Characterization of FGFRL1, a novel fibroblast growth factor (FGF) receptor preferentially expressed in skeletal tissues. J. Biol. Chem. 278, 33857–33865 10.1074/jbc.M300281200 [DOI] [PubMed] [Google Scholar]
- 9. Trueb B., and Taeschler S. (2006) Expression of FGFRL1, a novel fibroblast growth factor receptor, during embryonic development. Int. J. Mol. Med. 17, 617–620 [PubMed] [Google Scholar]
- 10. Gerber S. D., Steinberg F., Beyeler M., Villiger P. M., and Trueb B. (2009) The murine Fgfrl1 receptor is essential for the development of the metanephric kidney. Dev. Biol. 335, 106–119 10.1016/j.ydbio.2009.08.019 [DOI] [PubMed] [Google Scholar]
- 11. Makino S., Kunimoto K., Muraoka Y., Mizushima Y., Katagiri K., and Tochino Y. (1980) Breeding of a non-obese, diabetic strain of mice. Jikken Dobutsu 29, 1–13 [DOI] [PubMed] [Google Scholar]
- 12. Leiter E. H., Prochazka M., and Coleman D. L. (1987) The non-obese diabetic (NOD) mouse. Am. J. Pathol. 128, 380–383 [PMC free article] [PubMed] [Google Scholar]
- 13. Miyazaki T., Uno M., Uehira M., Kikutani H., Kishimoto T., Kimoto M., Nishimoto H., Miyazaki J., and Yamamura K. (1990) Direct evidence for the contribution of the unique I-ANOD to the development of insulitis in non-obese diabetic mice. Nature 345, 722–724 10.1038/345722a0 [DOI] [PubMed] [Google Scholar]
- 14. Poitout V., and Robertson R. P. (2008) Glucolipotoxicity: fuel excess and β-cell dysfunction. Endocr. Rev. 29, 351–366 10.1210/er.2007-0023 [DOI] [PMC free article] [PubMed] [Google Scholar]
- 15. Rieckmann T., Kotevic I., and Trueb B. (2008) The cell surface receptor FGFRL1 forms constitutive dimers that promote cell adhesion. Exp. Cell Res. 314, 1071–1081 10.1016/j.yexcr.2007.10.029 [DOI] [PubMed] [Google Scholar]
- 16. Jares-Erijman E. A., and Jovin T. M. (2003) FRET imaging. Nat. Biotechnol. 21, 1387–1395 10.1038/nbt896 [DOI] [PubMed] [Google Scholar]
- 17. Silva P. N., Atto Z., Regeenes R., Tufa U., Chen Y. Y., Chan W. C., Volchuk A., Kilkenny D. M., and Rocheleau J. V. (2016) Highly efficient adenoviral transduction of pancreatic islets using a microfluidic device. Lab Chip 16, 2921–2934 10.1039/C6LC00345A [DOI] [PubMed] [Google Scholar]
- 18. Varma R., and Mayor S. (1998) GPI-anchored proteins are organized in submicron domains at the cell surface. Nature 394, 798–801 10.1038/29563 [DOI] [PubMed] [Google Scholar]
- 19. Yeow E. K., and Clayton A. H. (2007) Enumeration of oligomerization states of membrane proteins in living cells by homo-FRET spectroscopy and microscopy: theory and application. Biophys. J. 92, 3098–3104 10.1529/biophysj.106.099424 [DOI] [PMC free article] [PubMed] [Google Scholar]
- 20. Ming A. Y., Yoo E., Vorontsov E. N., Altamentova S. M., Kilkenny D. M., and Rocheleau J. V. (2012) Dynamics and distribution of Klothoβ (KLB) and fibroblast growth factor receptor-1 (FGFR1) in living cells reveal the fibroblast growth factor-21 (FGF21)-induced receptor complex. J. Biol. Chem. 287, 19997–20006 10.1074/jbc.M111.325670 [DOI] [PMC free article] [PubMed] [Google Scholar]
- 21. Kim I., Moon S., Yu K., Kim U., and Koh G. Y. (2001) A novel fibroblast growth factor receptor-5 preferentially expressed in the pancreas. Biochim. Biophys. Acta 1518, 152–156 10.1016/S0167-4781(00)00282-7 [DOI] [PubMed] [Google Scholar]
- 22. Kilkenny D. M., and Rocheleau J. V. (2008) Fibroblast growth factor receptor-1 signaling in pancreatic islet beta-cells is modulated by the extracellular matrix. Mol. Endocrinol. 22, 196–205 10.1210/me.2007-0241 [DOI] [PMC free article] [PubMed] [Google Scholar]
- 23. Cnop M., Welsh N., Jonas J. C., Jörns A., Lenzen S., and Eizirik D. L. (2005) Mechanisms of pancreatic beta-cell death in type 1 and type 2 diabetes: many differences, few similarities. Diabetes 54, Suppl. 2, S97–S107 10.2337/diabetes.54.suppl_2.S97 [DOI] [PubMed] [Google Scholar]
- 24. Erhardt P., Schremser E. J., and Cooper G. M. (1999) B-Raf inhibits programmed cell death downstream of cytochrome c release from mitochondria by activating the MEK/Erk pathway. Mol. Cell. Biol. 19, 5308–5315 10.1128/MCB.19.8.5308 [DOI] [PMC free article] [PubMed] [Google Scholar]
- 25. Steinberg F., Zhuang L., Beyeler M., Kälin R., Mullis P., Brändli A., and Trueb B. (2010) The FGFRL1 receptor is shed from cell membranes, binds fibroblast growth factors (FGFs), and antagonizes FGF signaling in Xenopus embryos. J. Biol. Chem. 285, 2193–2202 10.1074/jbc.M109.058248 [DOI] [PMC free article] [PubMed] [Google Scholar]
- 26. Petersen L. G., Størling J., Heding P., Li S., Berezin V., Saldeen J., Billestrup N., Bock E., and Mandrup-Poulsen T. (2006) IL-1β-induced pro-apoptotic signalling is facilitated by NCAM/FGF receptor signalling and inhibited by the C3d ligand in the INS-1E rat beta cell line. Diabetologia 49, 1864–1875 10.1007/s00125-006-0296-2 [DOI] [PubMed] [Google Scholar]
- 27. Trueb B. (2011) Biology of FGFRL1, the fifth fibroblast growth factor receptor. Cell. Mol. Life Sci. 68, 951–964 10.1007/s00018-010-0576-3 [DOI] [PMC free article] [PubMed] [Google Scholar]
- 28. Bushell K. M., Söllner C., Schuster-Boeckler B., Bateman A., and Wright G. J. (2008) Large-scale screening for novel low-affinity extracellular protein interactions. Genome Res. 18, 622–630 10.1101/gr.7187808 [DOI] [PMC free article] [PubMed] [Google Scholar]
- 29. Kilkenny D. M., and Rocheleau J. V. (2016) The FGF21 receptor signaling complex: Klothoβ, FGFR1c, and other regulatory interactions. Vitam. Horm. 101, 17–58 10.1016/bs.vh.2016.02.008 [DOI] [PubMed] [Google Scholar]
- 30. Baker M. S., Chen X., Rotramel A., Nelson J., and Kaufman D. B. (2003) Proinflammatory cytokines induce NF-κB-dependent/NO-independent chemokine gene expression in MIN6 β cells. J. Surg. Res. 110, 295–303 10.1016/S0022-4804(03)00027-1 [DOI] [PubMed] [Google Scholar]
- 31. Kin T., Senior P., O'Gorman D., Richer B., Salam A., and Shapiro A. M. J. (2008) Risk factors for islet loss during culture prior to transplantation. Transpl. Int. 21, 1029–1035 [DOI] [PubMed] [Google Scholar]
- 32. Cameron W. D., Bui C. V., Hutchinson A., Loppnau P., Gräslund S., and Rocheleau J. V. (2016) Apollo-NADP+: a spectrally tunable family of genetically encoded sensors for NADP+. Nat. Methods 13, 352–358 10.1038/nmeth.3764 [DOI] [PubMed] [Google Scholar]
- 33. Broussard J. A., Rappaz B., Webb D. J., and Brown C. M. (2013) Fluorescence resonance energy transfer microscopy as demonstrated by measuring the activation of the serine/threonine kinase Akt. Nat. Protoc. 8, 265–281 10.1038/nprot.2012.147 [DOI] [PMC free article] [PubMed] [Google Scholar]
- 34. Rizzo M. A., Springer G., Segawa K., Zipfel W. R., and Piston D. W. (2006) Optimization of pairings and detection conditions for measurement of FRET between cyan and yellow fluorescent proteins. Microsc. Microanal. 12, 238–254 10.1017/S1431927606060235 [DOI] [PubMed] [Google Scholar]
- 35. Fosang A. J., and Colbran R. J. (2015) Transparency is the key to quality. J. Biol. Chem. 290, 29692–29694 10.1074/jbc.E115.000002 [DOI] [PMC free article] [PubMed] [Google Scholar]
- 36. Arany E., Strutt B., Romanus P., Remacle C., Reusens B., and Hill D. (2004) Taurine supplement in early life altered islet morphology, decreased insulitis and delayed the onset of diabetes in non-obese diabetic mice. Diabetologia 47, 1831–1837 10.1007/s00125-004-1535-z [DOI] [PubMed] [Google Scholar]
Associated Data
This section collects any data citations, data availability statements, or supplementary materials included in this article.