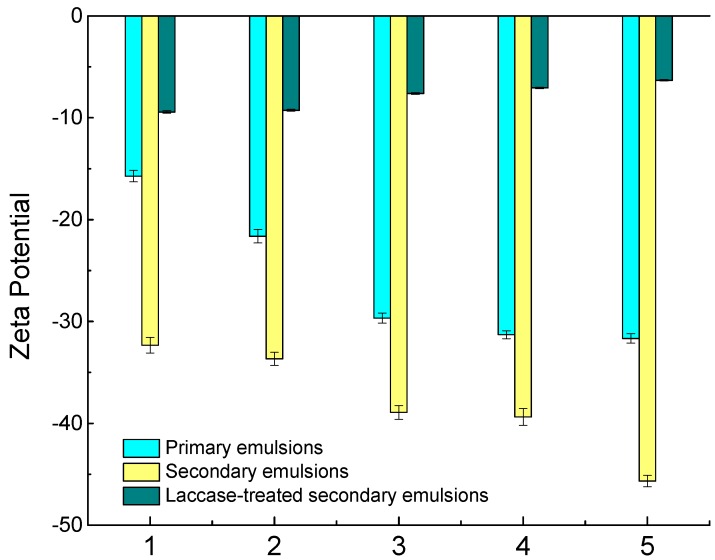
Figure 2.
Zeta potential of primary emulsions (1, 2, 3, 4, and 5 represent protein content of 0.8 g/100 g, 1.8 g/100 g, 2.8 g/100 g, 3.8 g/100 g, and 4.8 g/100 g, respectively); secondary emulsions (protein content was 3.8 g/100 g, and 1, 2, 3, 4, and 5 represent SBP content of 0.01 g/100 g, 0.02 g/100 g, 0.05 g/100 g, 0.10 g/100 g, and 0.15 g/100 g, respectively); laccase-treated secondary emulsions (protein content was 3.8 g/100 g, SBP content was 0.10 g/100 g, and 1, 2, 3, 4, and 5 represent laccase content of 2 U/100 g, 4 U/100 g, 6 U/100 g, 8 U/100 g, and 10 U/100 g, respectively).

