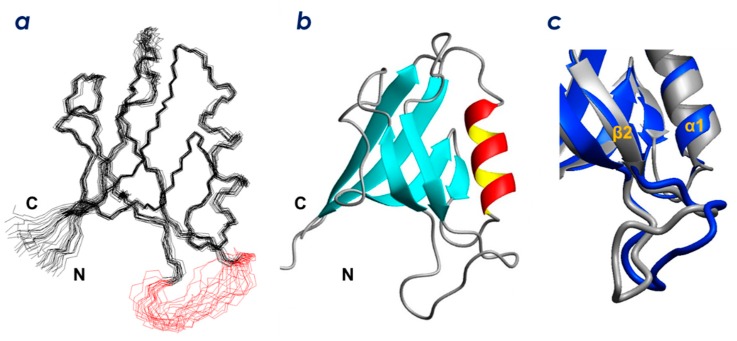
Figure 3.
Solution structure of mouse ZO-1(PDZ1). (a) stereo view of the best fit superposition of the 20 structures with lowest CNS total energies. The loop residues (43–51) are shown in red. (b) ribbon diagram of the representative ZO-1(PDZ1) solution structure. (c) comparison of the solution structure (PDB: 2rrm, navy blue) and crystal structure (human ZO-1(PDZ1), PDB: 2h3m, gray).

