Abstract
Background
Recent studies have demonstrated a continuum in clinical risk related to mean pulmonary artery pressure that begins at >19 mm Hg, which is below the traditional threshold used to define pulmonary hypertension (PH) of 25 mm Hg. Because of the implications on patient diagnosis and prognosis, the generalizability and validity of these data need further confirmation.
Methods and Results
Databases were searched from inception through January 31, 2018, to identify studies comparing all‐cause mortality between patients with mildly elevated mean pulmonary artery pressure near but <25 mm Hg versus the referent group. The meta‐analysis included 15 nonrandomized studies and 16 482 patients (7451 [45.2%] with measured or calculated mean pulmonary artery pressure of 19–24 mm Hg by right heart catheterization [n=6037] and echocardiography [n=1414] [mild PH]). The mean duration of follow‐up was 5.2 years. Compared with the referent group, mild PH was associated with an increased risk of mortality (risk ratio, 1.52; 95% confidence interval, 1.32–1.74; P<0.001; I2=47%). Secondary analysis using risk‐adjusted time‐to‐event estimates showed a similar result (hazard ratio, 1.19; 95% confidence interval, 1.09–1.31; P<0.001; I2=42%). The findings were consistent between subgroups of right heart catheterization and echocardiography studies (P interaction>0.05). There was evidence of publication bias; however, this did not influence the risk estimate (Duval and Tweedie's trim and fill adjusted risk ratio, 1.34; 95% confidence interval, 1.15–1.56).
Conclusions
The risk of mortality is increased in patients with mild PH, defined as measured or calculated mean pulmonary artery pressure >19 mm Hg. These data emphasize a need for diagnosing patients with mild PH with consideration to enrollment in PH clinical studies investigating pharmacological and nonpharmacological interventions to attenuate clinical risk and improve outcomes.
Keywords: echocardiography, mortality, pulmonary artery pressure, pulmonary hypertension, right heart catheterization
Subject Categories: Pulmonary Hypertension, Mortality/Survival, Meta Analysis
Clinical Perspective
What Is New?
Mildly elevated mean pulmonary artery pressure ≈19 to 24 mm Hg, which is below the traditional threshold of >25 mm Hg used to define pulmonary hypertension (PH), is associated with an increased risk of all‐cause mortality.
The association between mildly elevated mean pulmonary artery pressure and increased mortality is consistent when PA pressure is measured by right heart catheterization or estimated by echocardiography.
What Are the Clinical Implications?
Our data support efforts to update the current definition of PH and affirm the reproducibility of mean pulmonary artery pressure >19 mm Hg as an appropriate and clinically accessible level distinguishing patients with PH from patients without PH.
Acknowledging this would identify previously undiagnosed patients with PH and provide a framework in clinical practice by which to initiate careful monitoring and efforts to modify risk factors and improve outcomes.
Introduction
There are accumulating data suggesting that the spectrum of clinical risk related to mean pulmonary artery pressure (mPAP) is wider than described originally.1 Findings from 2 large right heart catheterization (RHC) registries2, 3 and numerous other smaller clinical studies4, 5 have demonstrated that mPAP of >19 mm Hg (previously termed “borderline pulmonary hypertension [PH]”) is an independent risk factor for increased mortality. This observation indicates that the traditional mPAP threshold for defining PH of ≥25 mm Hg may be insufficient. This, in turn, has important potential implications for diagnosing and prognosticating patients with PH. Yet, the acceptance of a lower threshold of mPAP to identify patient populations at risk remains controversial, and formal assessment of published literature to determine a more precise estimate of risk across patient populations is lacking. Furthermore, the clinical relevance of mildly elevated PA pressure, measured by echocardiography, remains unclear.6 Hence, the primary objective of this study was to perform a systematic review and meta‐analysis of RHC and echocardiography studies to determine the association between mildly elevated PA pressures and mortality.
Methods
Data Sources
We searched PubMed (MEDLINE), CINHAL, EMBASE, Web of Science, and Cochrane Central Register of Controlled Trials from inception through January 31, 2018, for English‐language, peer‐reviewed publications. The following keywords and Medical Subject Heading terms were used: “hypertension, pulmonary (Medical Subject Heading),” “pulmonary artery hypertension,” “pulmonary arterial hypertension,” “pulmonary artery pressure,” “pulmonary arterial pressure,” “pulmonary artery systolic pressure,” “right ventricular systolic pressure,” “mPAP,” “mortality (Medical Subject Heading),” and “death (Medical Subject Heading).” Reference lists of systematic reviews, meta‐analyses, and original studies identified by the electronic search were reviewed to find other potentially eligible studies. The authors declare that all supporting data are available within the article and references.
Study Selection
Studies were included in the meta‐analysis if they: (1) included a clearly defined or identifiable study group with mildly elevated PA pressure and (2) provided the number of events and/or risk estimates for mortality in the mild PH versus referent group. We followed the Preferred Reporting Items for Systematic Reviews and Meta‐Analyses (PRISMA) and Meta‐Analysis of Observational Studies in Epidemiology (MOOSE) checklists for the protocol of our meta‐analysis.7, 8
Data Extraction and Quality Assessment
Three physician reviewers (D.K., S.L., and G.C.) evaluated independently study eligibility and quality, and performed data extraction using standardized data collection sheets. Disagreements were resolved by consensus. Study quality was evaluated using the Newcastle‐Ottawa Scale, which assigns a star for 3 areas of study quality: selection (4 criteria), comparability (1 criterion), and outcome (3 criteria).9 A study can be awarded a maximum of 1 star for each numbered criterion within the selection and outcome categories. A maximum of 2 stars can be given for comparability (Table 1).
Table 1.
Assessment of the Quality of Nonrandomized Studies Included in the Meta‐Analysis Using the Newcastle‐Ottawa Scale
| Study | Selection | Comparability | Outcome |
|---|---|---|---|
| Valerio et al, 201310 | ✩★★★ | ✩✩ | ★★★ |
| Heresi et al, 201311 | ★★★★ | ★★ | ★★★ |
| Kovacs et al, 20145 | ★★★★ | ✩✩ | ★★★ |
| Suzuki et al, 201412 | ✩★★★ | ★★ | ★★★ |
| Maron et al, 20163 | ✩★★★ | ★★ | ★★★ |
| Takahashi et al, 201613 | ✩★★★ | ★★ | ★★★ |
| Douschan et al, 20184 | ★★★★ | ✩✩ | ★★★ |
| Assad et al, 20172 | ★★★★ | ★★ | ★★★ |
| Abramson et al, 199214 | ✩★★★ | ✩✩ | ★★★ |
| Kjaergaard et al, 200715 | ✩★★★ | ✩✩ | ★★★ |
| Shalaby et al, 200816 | ☆★★★ | ★★ | ★★★ |
| Lam et al, 200917 | ★★★★ | ✩✩ | ★★★ |
| Damy et al, 201018 | ✩★★★ | ✩✩ | ★★★ |
| Cabrita et al, 201319 | ✩★★★ | ★★ | ★★★ |
| Choudhary et al, 201420 | ✩★★★ | ★★ | ★★★ |
Study quality was\xA0evaluated using the Newcastle‐Ottawa Scale, which assigns a\xA0star for 3 areas of study quality: selection (4 criteria),\xA0comparability (1 criterion), and outcome (3 criteria). A study\xA0can be awarded a maximum of 1 star for each numbered\xA0criterion within the selection and outcome categories. A\xA0maximum of 2 stars can be given for comparability.  = criterion not satisfied (star not awarded)
  = criterion satisfied (star awarded)
Exposure
The exposure was mild PH. Mild PH was defined as a lower limit mPAP of 19 to 21.5 mm Hg and an upper limit mPAP of ≈25 mm Hg, except some studies in which few patients (n=11 patients) with mPAP >25 mm Hg were also included in the mild PH group because of unavailability of mortality data separately for these patients (Table 2). For echocardiography studies that reported only the tricuspid regurgitation velocity or gradient (n=3), pulmonary artery systolic pressure (PASP) was calculated as tricuspid regurgitation gradient plus an assumed right atrial pressure of 5 mm Hg. This approach has been used in prior studies.17, 20, 21, 22 mPAP was calculated using the following formula: (0.61×PASP) + 2 mm Hg.23
Table 2.
Characteristics of Studies Included in the Meta‐Analysis
| Study | Study Design | Data Source | Study Population | Na | RHC or Echocardiographic Index | Study Groups | Follow‐Up Duration, y | |
|---|---|---|---|---|---|---|---|---|
| Mild PH | Referent | |||||||
| Valerio et al, 201310 | Retrospective | The Royal Free Hospital Pulmonary Hypertension Database | Systemic sclerosis | 199 | RHC mPAP | mPAP 21–24 mm Hg | mPAP ≤20 mm Hg | 5 |
| Heresi et al, 201311 | Retrospective | Cleveland Clinic Pulmonary Hypertension Registry | Cardiac disease (16.2%), pulmonary disease (29.7%), CTD (18.9%), other (6.1%) | 82 | RHC mPAP | mPAP 21–24 mm Hg | mPAP ≤20 mm Hg | 5 |
| Kovacs et al, 20145 | Retrospective | Single center | Cardiac disease (23%), pulmonary disease (23%), CTD (43%) | 141 | RHC mPAP | mPAP 21–24 mm Hg | mPAP <21 mm Hg | 4.2 |
| Suzuki et al, 201412 | Retrospective | Single center | LD‐CTD | 100 | RHC mPAP | mPAP ≥20 mm Hgb | mPAP <20 mm Hg | 5 |
| Maron et al, 20163 | Retrospective | VA‐CART | US Veterans (HF [38.7%], pulmonary disease [27.8%], CTD [4.6%]) | 9237 | RHC mPAP | mPAP 19–24 mm Hg | mPAP ≤18 mm Hg | 5 |
| Takahashi et al, 201613 | Retrospective | Single center | CTD‐ILD | 68 | RHC mPAP | mPAP ≥20 mm Hgc | mPAP <20 mm Hg | 7 |
| Douschan et al, 20184 | Retrospective+prospective | Single center | Patients with cardiopulmonary disease with unexplained dyspnea and/or at risk of PH referred for RHC | 257 | RHC mPAP | mPAP 20.6–24.9 mm Hg | mPAP <20.6 mm Hg | 5 |
| Assad et al, 20172 | Retrospective | Single center | Patients referred for RHC (HF [32.1%], pulmonary disease [14.3%], CTD [2.0%]) | 1659 | RHC mPAP | mPAP 19–24 mm Hg | mPAP ≤18 mm Hg | 5 |
| Abramson et al, 199214 | Retrospective | Single center | Ischemic or idiopathic dilated cardiomyopathy | 87 | Echocardiographic TRV | TRV 2.6–3.0 m/s (mPAP 21.5–27.0 mm Hgd) | TRV ≤2.5 m/s (mPAP ≤20.3 mm Hg) | 2.3 |
| Kjaergaard et al, 200715 | Post hoc analysis of RCT | ECHOS | Heart failure | 194 | Echocardiographic RVSP | RVSP 31–38 mm Hg (mPAP 20.9–25.2 mm Hgd) | RVSP <31 (mPAP <20.9 mm Hg) | 4 |
| Shalaby et al, 200816 | Retrospective | Multicenter | CRT recipients | 176 | Echocardiographic PASP | PASP 30–44 mm Hg (mPAP 20.3–28.8 mm Hgd) | PASP 20–29 mm Hg (mPAP 14.2–19.7 mm Hg) | 1.6 |
| Lam et al, 200917 | Prospective | Olmsted County | Random sample of the Olmsted County population ≥45 y | 1234 | Echocardiographic PASP | PASP 30–32 mm Hg (mPAP 20–21.5 mm Hgd) | PASP 15–29 mm Hg (mPAP 11.2–19.7 mm Hg) | 8 |
| Damy et al, 201018 | Retrospective | Single center | Heart failure | 311 | Echocardiographic TRG | TRG 26–35 mm Hg (mPAP 20.9–26.4 mmd) | TRG ≤25 mm Hg (mPAP ≤20.3 mm Hg) | 6.7 |
| Cabrita et al, 201319 | Retrospective | Multicenter | Sickle cell disease | 164 | Echocardiographic TRV | TRV ≥2.5 m/se (mPAP ≥20.3 mm Hgd) | TRV <2.5 m/s (mPAP <20.3 mm Hg) | 5.7 |
| Choudhary et al, 201420 | Retrospective | JHS | Population‐based cohort of blacks residing in Jackson, MS | 2567 | Echocardiographic PASP | PASP 28–32 mm Hg (mPAP 19.1–21.5 mm Hgd) | PASP 10–27 mm Hg (mPAP 8.1–18.5 mm Hg) | 3.5 |
CRT indicates cardiac resynchronization therapy; CTD, connective tissue disease; CTD‐ILD, CTD‐associated interstitial lung disease; ECHOS, Echocardiography and Heart Outcome Study; HF, heart failure; JHS, Jackson Heart Study; LD‐CTD, lung‐dominant CTD; mPAP, mean pulmonary artery pressure; PASP, pulmonary artery systolic pressure; PH, pulmonary hypertension; RCT, randomized controlled trial; RHC, right heart catheterization; RVSP, right ventricular systolic pressure; TRG, tricuspid regurgitation gradient; TRV, tricuspid regurgitation velocity; VA‐CART, Veterans Affairs Clinical Assessment Reporting and Tracking.
Number of patients included in the meta‐analysis. The actual number of patients in the original studies may be different.
Includes 4 patients with mPAP >25 mm Hg.
Includes 6 patients with mPAP >25 mm Hg.
Calculated mPAP using the following formula: (0.61×PASP) + 2 mm Hg.
Includes 3 patients with TRV >3.0 m/s.
Outcomes
The primary outcome of interest was all‐cause mortality.
Statistical Analysis
Random‐effects models of DerSimonian and Laird were used to calculate pooled risk ratio (RR) and corresponding 95% confidence interval (CI) for mortality. For studies that reported risk‐adjusted time‐to‐event estimates (adjusted hazard ratio [HR]) and the corresponding 95% CI, we performed secondary analyses using the generic inverse variance method to estimate pooled HR using a random‐effects model. Secondary analyses were also performed using fixed‐effect models. Heterogeneity was assessed using the Higgins I2 statistic, with values <25% and >75% considered indicative of low and high heterogeneity, respectively. Pooled estimates were calculated for all studies as well as the a priori defined subgroups of echocardiography and RHC studies. Publication bias was assessed visually by asymmetry in funnel plots and formally using Egger's regression test and the Begg‐Mazumdar rank correlation test. To assess the impact of publication bias on the risk estimate, we used Duval and Tweedie's Trim and Fill as well as cumulative meta‐analysis (after sorting the included studies from largest to smallest size).24, 25
All tests were 2 tailed, with a P<0.05 considered statistically significant. Analyses were performed using the Review Manager Version 5.3 (The Nordic Cochrane Center, The Cochrane Collaboration, 2014, Copenhagen, Denmark) and Comprehensive Meta‐Analysis Version 3.0 (Biostat, Englewood, NJ).
Results
The database search yielded 11 184 articles. After removing duplicates, 7920 articles were screened at the title/abstract level and 7880 were excluded for various reasons (eg, systematic reviews, case reports, studies that included only patients with known PH, and studies with no data on mortality). Forty full‐text articles were assessed for eligibility (Figure 1). Fifteen (8 RHC and 7 echocardiography) studies were included in the meta‐analysis.2, 3, 4, 5, 10, 11, 12, 13, 14, 15, 16, 17, 18, 19, 20 The characteristics of the included studies are shown in Table 2. Of the 15 studies, 12 were retrospective, 1 was prospective, 1 was ambispective, and 1 was a post hoc analysis of a randomized controlled trial. The 15 studies included 16 482 patients (7451 [45.2%] with mild PH [6037 diagnosed by RHC, and 1414 diagnosed by echocardiography] and 9031 [56.4%] in the referent group). The mean duration of follow‐up weighted for the sample size was 5.2 years. The studies included in the meta‐analysis encompassed a broad spectrum of the patient population at risk of PH, including those with cardiac, pulmonary, connective tissue, and hematologic diseases. Table 3 shows the characteristics of patients in the 2 groups in the included studies. The mean/median age of patients ranged from 41 to 77 years, and the proportion of women ranged from 3.5% to 90%.
Figure 1.
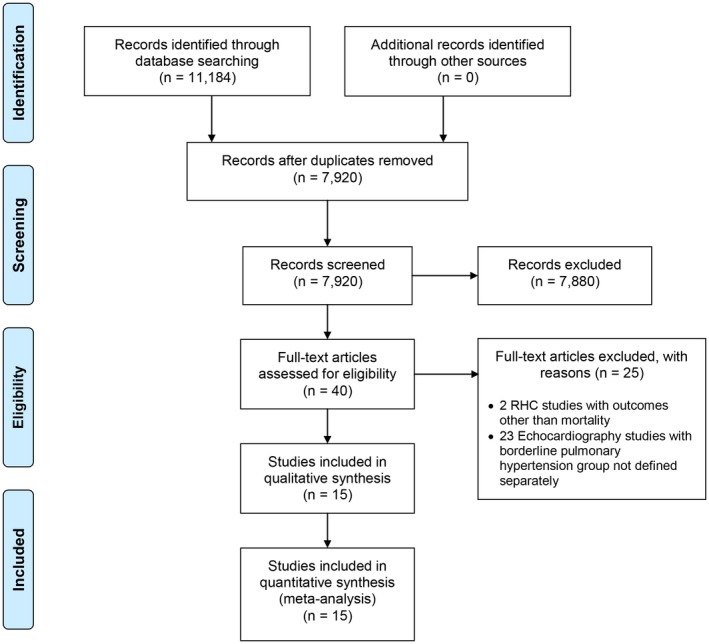
Preferred Reporting Items for Systematic Reviews and Meta‐Analyses (PRISMA) study selection flow diagram. RHC indicates right heart catheterization.
Table 3.
Baseline Characteristics of Patients in the Included Studies
| Characteristics | Valerio et al10 | Heresi et al11 | Kovacs et al5 | Suzuki et al12 | Maron et al3 | Takahashi et al13 | Douschan et al4 | Assad et al2 | ||||||||
|---|---|---|---|---|---|---|---|---|---|---|---|---|---|---|---|---|
| Ref. | Mild PH | Ref. | Mild PH | Ref. | Mild PH | Ref. | Mild PH | Ref. | Mild PH | Ref. | Mild PH | Ref. | Mild PH | Ref. | Mild PH | |
| (n=136) | (n=63) | (n=51) | (n=31) | (n=109) | (n=32) | (n=82) | (n=18) | (n=4207) | (n=5030) | (n=58) | (n=16) | (n=193) | (n=64) | (n=876) | (n=783) | |
| Age, y | 51±17 | 59±14 | 57.3±12.5 | 65.8±12.5 | 64.5±8.3 | 67.9±6.4 | 64.3 (59.6–73.0) | 65.2 (60.3–73.5) | 62.9±19 | 61.9±11.4 | 60 (50–69) | 67 (58–75) | 59 (47–68) | 62 (52–71) | ||
| Female | 88.2 | 90 | 37.8 | 27.8 | 3.5 | 3.4 | 58.6 | 43.8 | 72.5 | 70 | 46 | 46 | ||||
| Race (nonwhite) | 20.9 | 20.7 | 10 | 15 | ||||||||||||
| BMI, kg/m2 | 25.6±4.5 | 27.5±5.9 | 23.5±3.8 | 24.8±4.6 | 28 (24.6–31.5) | 29.6 (26–34) | 22.7±3.9 | 23.8±4.3 | 26.2 (23.3–29.4) | 26.7 (22.9–31.2) | 27 (23–31) | 29 (25–34) | ||||
| Hypertension | 82.3 | 86 | 73 | 82 | ||||||||||||
| DM | 33.4 | 40.6 | 25 | 37 | ||||||||||||
| Smoking | 58.5 | 72.2 | 37.9 | 56.3 | 55.5 | 50 | ||||||||||
| Obesity | 29.4 | 30 | 33.7 | 47.3 | 29 | 43 | ||||||||||
| CAD | 78.6 | 82.4 | 72 | 76 | ||||||||||||
| Atrial fibrillation | 20 | 27 | ||||||||||||||
| COPD | 23 | 30.8 | 5 | 14 | ||||||||||||
| ILD | 100 | 100 | 0.4 | 0.7 | 5 | 6 | ||||||||||
| OSA | 7.3 | 10.2 | 5 | 10 | ||||||||||||
| Anemia | 36 | 44 | ||||||||||||||
| Heart failure | 34.1 | 42.7 | 25 | 39 | ||||||||||||
| CTD | 100 | 100 | 4.9 | 4.3 | 2 | 2 | ||||||||||
| CKD | 17.6 | 21.2 | ||||||||||||||
| HIV | 0.5 | 0.3 | ||||||||||||||
| Sickle cell disease | 0 | 0 | ||||||||||||||
| Cirrhosis | 9.7 | 8.1 | ||||||||||||||
| Abramson et al14 | Kjaergaard et al15 | Shalaby et al16 | Lam et al17 | Damy et al18 | Cabrita et al19 | Choudhary et al20 | ||||||||
|---|---|---|---|---|---|---|---|---|---|---|---|---|---|---|
| Ref. | Mild PH | Ref. | Mild PH | Ref. | Mild PH | Ref. | Mild PH | Ref. | Mild PH | Ref. | Mild PH | Ref. | Mild PH | |
| (n=80) | (n=7) | (n=97) | (n=97) | (n=86) | (n=90) | (n=956) | (n=278) | (n=212) | (n=99) | (n=116) | (n=48) | (n=1772) | (n=795) | |
| Age, y | 66.7 | 72 (65–81) | 77 (68–81) | 65±12 | 65±12 | 73±10 | 77±9 | 41±12 | 46±13 | 53.1±12.2 | 58.9±11.6 | |||
| Female | 15 | 36 | 41 | 6 | 16 | 36 | 55 | 35.6 | 32.3 | |||||
| Race (nonwhite) | 4 | 6 | 100 | 100 | ||||||||||
| BMI, kg/m2 | 26 (23–29) | 26 (21–28) | 27±5 | 26±6 | 25±5 | 24±6 | 30.5±6.6 | 31.8±6.9 | ||||||
| Hypertension | 18 | 30 | 71 | 60 | 42.9 | 50 | 52.7 | 65.6 | ||||||
| DM | 10 | 12 | 47 | 39 | 9.9 | 16 | 20.2 | 24.9 | ||||||
| Smoking | 29 | 29 | 22 | 18 | 15.6 | 12 | 29.3 | 34.4 | ||||||
| Obesity | 46.1 | 54.2 | ||||||||||||
| CAD | 41 | 43 | 6.1 | 9 | ||||||||||
| Atrial fibrillation | 34 | 49 | 44.5 | 55 | ||||||||||
| COPD | 18 | 24 | 34 | 27 | 43 | 50 | ||||||||
| ILD | ||||||||||||||
| OSA | ||||||||||||||
| Anemia | ||||||||||||||
| Heart failure | 76 | 68 | 1.4 | 3.1 | ||||||||||
| CTD | ||||||||||||||
| CKD | 5 | 9 | ||||||||||||
| HIV | ||||||||||||||
| Sickle cell disease | 100 | 100 | ||||||||||||
| Cirrhosis | ||||||||||||||
Continuous variables are presented as mean±SD or median (interquartile range), and categorical variables are presented as percentages. Empty cells indicate data not available. BMI indicates body mass index; CAD, coronary artery disease; COPD, chronic obstructive pulmonary disease; CKD, chronic kidney disease; CTD, connective tissue disease; DM, diabetes mellitus; ILD, interstitial lung disease; OSA, obstructive sleep apnea; PH, pulmonary hypertension; Ref., referent group.
Compared with the referent group, mild PH was associated with significantly increased risk of mortality (random‐effects model: RR, 1.52; 95% CI, 1.32–1.74; P<0.001; I2=47%; fixed‐effect model: RR, 1.34; 95% CI, 1.27–1.43; P<0.001; I2=47%) (Figures 2 and 3). Secondary analysis using risk‐adjusted time‐to‐event estimates showed results consistent with the direction of primary finding (random‐effects model: HR, 1.19; 95% CI, 1.09–1.31; P<0.001; I2=42%; fixed‐effect model: HR, 1.17; 95% CI, 1.11–1.23; P<0.001; I2=42%) (Figures 4 and 5). The findings were consistent between RHC and echocardiography studies (P interaction>0.05). The results were unchanged in a sensitivity analysis, excluding 2 studies that accounted for >70% of the patients (RR, 1.64; 95% CI, 1.36–1.97; P<0.001; I2=47%; and HR, 1.22; 95% CI, 1.07–1.39; P=0.004; I2=45%).3, 20
Figure 2.
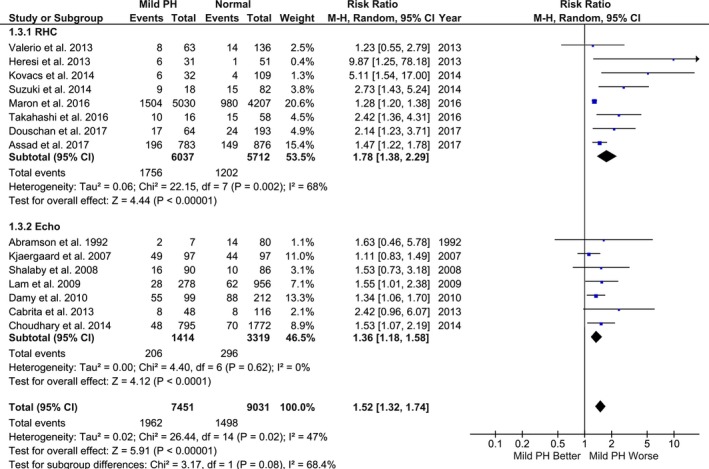
Association between mild pulmonary hypertension (PH) and mortality (random‐effects model). Studies included in this analysis are Valerio et al,10 Heresi et al,11 Kovacs et al,5 Suzuki et al,12 Maron et al,3 Takahashi et al,13 Douschan et al,4 Assad et al,2 Abramson et al,14 Kjaergaard et al,15 Shalaby et al,16 Lam et al,17 Damy et al,18 Cabrita et al,19 and Choudhary et al.20 CI indicates confidence interval; M‐H, Mantel‐Haenszel; RHC, right heart catheterization.
Figure 3.
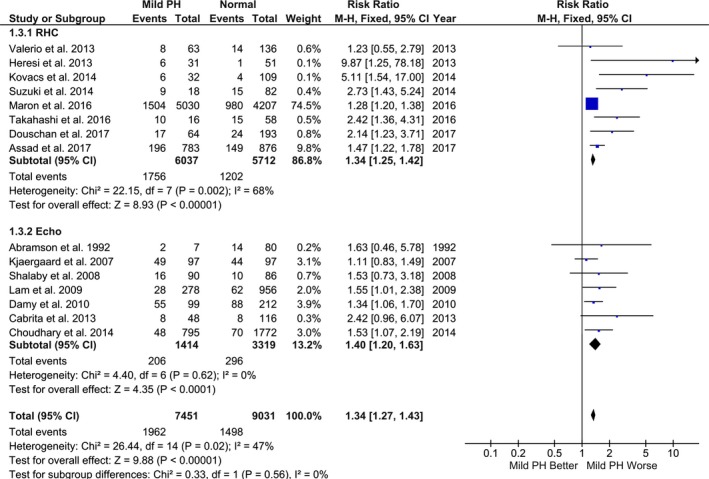
Association between mild pulmonary hypertension (PH) and mortality (fixed‐effect model). Studies included in this analysis are Valerio et al,10 Heresi et al,11 Kovacs et al,5 Suzuki et al,12 Maron et al,3 Takahashi et al,13 Douschan et al,4 Assad et al,2 Abramson et al,14 Kjaergaard et al,15 Shalaby et al,16 Lam et al,17 Damy et al,18 Cabrita et al,19 and Choudhary et al.20 CI indicates confidence interval; M‐H, Mantel‐Haenszel; RHC, right heart catheterization.
Figure 4.
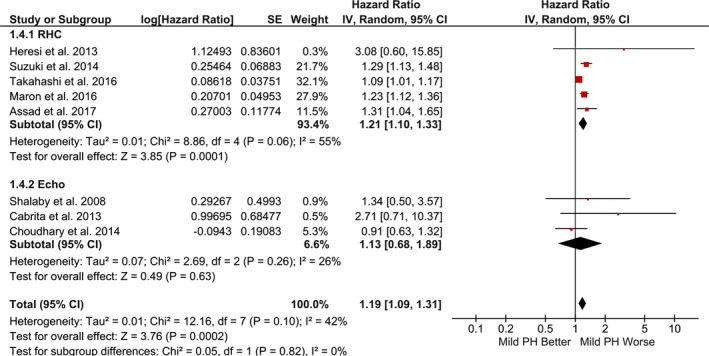
Pooled hazard ratio for mortality using risk‐adjusted time‐to‐event estimates (random‐effects model). Studies included in this analysis are Heresi et al,11 Suzuki et al,12 Maron et al,3 Takahashi et al,13 Assad et al,2 Shalaby et al,16 Cabrita et al,19 and Choudhary et al.20 CI indicates confidence interval; PH, pulmonary hypertension; IV, Inverse Variance; RHC, right heart catheterization.
Figure 5.
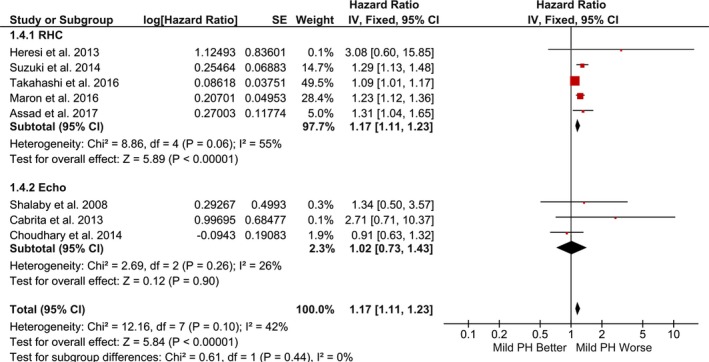
Pooled hazard ratio for mortality using risk‐adjusted time‐to‐event estimates (fixed‐effect model). Studies included in this analysis are Heresi et al,11 Suzuki et al,12 Maron et al,3 Takahashi et al,13 Assad et al,2 Shalaby et al,16 Cabrita et al,19 and Choudhary et al.20 CI indicates confidence interval; PH, pulmonary hypertension; IV, Inverse Variance; RHC, right heart catheterization.
There was evidence of publication bias on the basis of asymmetry in the funnel plot as well as results of the Egger's regression test and the Begg‐Mazumdar rank correlation test (Figure 6). However, the presence of publication bias did not influence the risk estimate and overall result (Duval and Tweedie's Trim and Fill adjusted RR, 1.34; 95% CI, 1.15–1.56) (Figure 7). Similarly, cumulative meta‐analysis demonstrated that the RR had stabilized with the inclusion of the larger studies and did not shift significantly with the addition of smaller studies, suggesting that the inclusion of smaller studies did not introduce bias (Figure 8).
Figure 6.
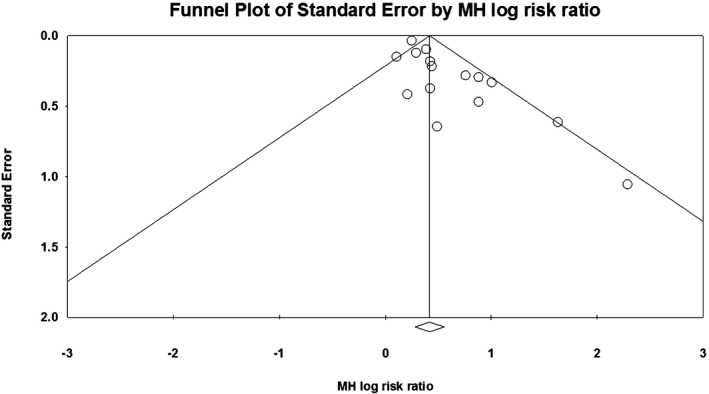
Publication bias assessment. Bias indicators: Begg‐Mazumdar: Kendall's τ=0.32381, P (1 tailed)=0.046, P (2 tailed)=0.092; Egger: intercept=1.31 (95% confidence interval, 0.62–2.01), P (1 tailed) <0.001, P (2 tailed)=0.001. MH indicates Mantel‐Haenszel.
Figure 7.
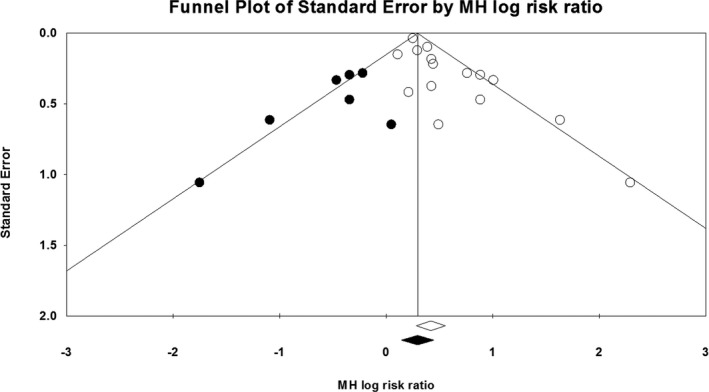
Duval and Tweedie's Trim and Fill. The Trim and Fill adjusted risk ratio was 1.34 (95% confidence interval, 1.15–1.56). MH indicates Mantel‐Haenszel.
Figure 8.
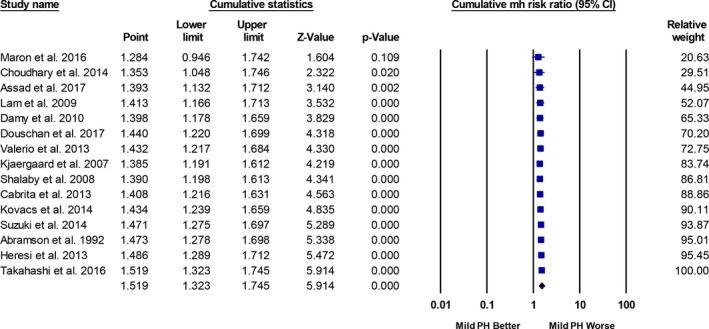
Cumulative meta‐analysis (largest to smallest size study). Studies included in this analysis are Valerio et al,10 Heresi et al,11 Kovacs et al,5 Suzuki et al,12 Maron et al,3 Takahashi et al,13 Douschan et al,4 Assad et al,2 Abramson et al,14 Kjaergaard et al,15 Shalaby et al,16 Lam et al,17 Damy et al,18 Cabrita et al,19 and Choudhary et al.20 CI indicates confidence interval; MH, Mantel‐Haenszel; PH, pulmonary hypertension.
Discussion
Data from this study address controversy on the mPAP level required to capture clinical risk in patients referred for RHC or echocardiography using a meta‐analysis, which is the optimal research tool for determining aggregate risk across study populations.26 We report that mildly elevated PA pressures, estimated by either echocardiography or invasive catheterization, are associated with 19% increased risk of mortality over 5 years. Despite analyzing both community‐based and referral populations with varying underlying comorbidities, there was only mild statistical heterogeneity of risk across the included studies. This suggests a truly generalizable association between mild PH and mortality. These data support the ongoing efforts to identify optimal cutoffs for hemodynamic parameters in PH, including pulmonary arterial hypertension, to identify at‐risk populations earlier.27
A notable finding of this study is the consistent association between mild PH and increased mortality when PA pressure was measured by either RHC or echocardiography. Although RHC is the only test available to diagnose PH, echocardiography is the preferred screening test for at‐risk patients.6 Current guidelines recommend further evaluation of patients for PH if the tricuspid regurgitation velocity is >2.9 m/s (corresponding to PASP >≈40 mm Hg).6 However, our findings demonstrate that PA pressure assessed by echocardiography, at levels considered currently to be below the range of clinical significance (tricuspid regurgitation velocity ≈>2.5 m/s, PASP >35 mm Hg) across both community‐based and referral populations, is, in fact, a valid predictor of mortality. Thus, our data suggest that when PA pressure can be measured by echocardiography, this is an effective screening tool for detecting patients at risk for mild PH who may benefit from further evaluation, close follow‐up, and risk reduction interventions.17, 20 Nonetheless, a recent study in patients with PH (mPAP >25 mm Hg) demonstrated modest correlation and poor agreement between echocardiography‐derived and RHC‐measured PASP and mPAP.28 Fisher et al29 showed that approximately half of the cases of PASP overestimation are related solely to right atrial pressure overestimation by echocardiography. Thus, although we used an assumed right atrial pressure of 5 mm Hg for calculating PASP in echocardiography studies that reported only tricuspid regurgitation velocity or gradient, concern for misclassification remains when relying on echocardiography alone for the diagnosis of PH (or mild PH). Furthermore, the effect sizes of mild PH, as estimated by RHC and echocardiography on mortality, although different, are not directly comparable to suggest different clinical recommendations for patients with mild PH diagnosed via these 2 modalities.
Our meta‐analysis, together with findings from the individual studies analyzed, provides comprehensive evidence in support of defining PH in contemporary and clinically relevant terms. Specifically, these data affirm the reproducibility across selected and unselected populations for mPAP >19 mm Hg as an appropriate and clinically accessible level distinguishing patients with PH from patients without PH. Acknowledging this would identify previously undiagnosed patients with PH and provide a framework in clinical practice by which to initiate careful monitoring and efforts to modify risk factors.30 These patients should also be considered for enrollment in ongoing and future PH clinical trials investigating pharmacological and nonpharmacological (eg, exercise program and weight loss) interventions to attenuate risk and improve outcomes in this population. Indeed, randomized controlled trials examining the efficacy and safety of established pulmonary artery hypertension therapies in patients with mild mPAP are already underway.31
Limitations
First, this is a meta‐analysis of nonrandomized studies and has all limitations of observational data, including selection bias and unmeasured confounding variables. Second, restricted by the nature and characteristics of this meta‐analysis, we did not have access to patient‐level data. Therefore, we are unable to characterize covariates that modulate risk within the mild PH group, such as elevated pulmonary vascular resistance. This is a particularly important limitation, because the addition of pulmonary vascular resistance to analysis of cardiopulmonary hemodynamic data is needed to exclude mildly increased PA pressure that is physiologic in the setting of increased cardiac output or cor pulmonale from a diagnosis of mild PH. Similarly, although we performed analysis using adjusted HRs, the precise impact of comorbidities cannot be readily assessed across studies in the absence of patient‐level data. Third, the possibility that differences in cardiopulmonary comorbidities and not PA pressure were responsible for differences in clinical outcome in this group cannot be excluded. However, pooled HRs derived from risk‐adjusted time‐to‐event estimates demonstrated a 19% increased risk of mortality in patients with mild PH compared with the referent group. Fourth, the association of mild PH and mortality in the subgroups of patients with cardiac, pulmonary, hematologic, or connective tissue disease could not be determined because of unavailability of mortality data in these different subgroups. Last, the mortality estimates are based on an mPAP cutoff of ≈19 to 20 mm Hg that was selected from prior published data, although a lower cutoff may yield slightly different results.
Conclusion
In a meta‐analysis of 15 nonrandomized studies, mild PH was associated with an increased risk of all‐cause mortality compared with the referent group. This finding was consistent in the subgroups of RHC and echocardiography studies. These data add to the growing body of literature on the hemodynamic range and prognostic significance of mild PH. Overall, our data affirm efforts to update the current PH definition and provide definitive data in support of future clinical trials to improve outcome in this vulnerable patient subgroup.
Disclosures
None.
(J Am Heart Assoc. 2018;7:e009729 DOI: 10.1161/JAHA.118.009729.)
References
- 1. World Health Organization . Primary Pulmonary Hypertension: Report on a WHO Meeting. 1975. http://www.who.int/iris/handle/10665/39094. Accessed March 8, 2018.
- 2. Assad TR, Maron BA, Robbins IM, Xu M, Huang S, Harrell FE, Farber‐Eger EH, Wells QS, Choudhary G, Hemnes AR, Brittain EL. Prognostic effect and longitudinal hemodynamic assessment of borderline pulmonary hypertension. JAMA Cardiol. 2017;2:1361–1368. [DOI] [PMC free article] [PubMed] [Google Scholar]
- 3. Maron BA, Hess E, Maddox TM, Opotowsky AR, Tedford RJ, Lahm T, Joynt KE, Kass DJ, Stephens T, Stanislawski MA, Swenson ER, Goldstein RH, Leopold JA, Zamanian RT, Elwing JM, Plomondon ME, Grunwald GK, Baron AE, Rumsfeld JS, Choudhary G. Association of borderline pulmonary hypertension with mortality and hospitalization in a large patient cohort: insights from the veterans affairs clinical assessment, reporting, and tracking program. Circulation. 2016;133:1240–1248. [DOI] [PMC free article] [PubMed] [Google Scholar]
- 4. Douschan P, Kovacs G, Avian A, Foris V, Gruber F, Olschewski A, Olschewski H. Mild elevation of pulmonary arterial pressure as a predictor of mortality. Am J Respir Crit Care Med. 2018;197:509–516. [DOI] [PubMed] [Google Scholar]
- 5. Kovacs G, Avian A, Tscherner M, Foris V, Bachmaier G, Olschewski A, Olschewski H. Characterization of patients with borderline pulmonary arterial pressure. Chest. 2014;146:1486–1493. [DOI] [PubMed] [Google Scholar]
- 6. Bossone E, D'Andrea A, D'Alto M, Citro R, Argiento P, Ferrara F, Cittadini A, Rubenfire M, Naeije R. Echocardiography in pulmonary arterial hypertension: from diagnosis to prognosis. J Am Soc Echocardiogr. 2013;26:1–14. [DOI] [PubMed] [Google Scholar]
- 7. Moher D, Liberati A, Tetzlaff J, Altman DG. Preferred reporting items for systematic reviews and meta‐analyses: the PRISMA statement. Ann Intern Med. 2009;151:264–269, W64. [DOI] [PubMed] [Google Scholar]
- 8. Stroup DF, Berlin JA, Morton SC, Olkin I, Williamson GD, Rennie D, Moher D , Becker BJ, Sipe TA, Thacker SB; Meta‐analysis Of Observational Studies in Epidemiology (MOOSE) group. Meta‐analysis of observational studies in epidemiology: a proposal for reporting. JAMA. 2000;283:2008–2012. [DOI] [PubMed] [Google Scholar]
- 9. The Newcastle‐Ottawa Scale (NOS) for assessing the quality of nonrandomised studies in meta‐analyses. 2014. http://www.ohri.ca/programs/clinical_epidemiology/oxford.asp. Accessed March 8, 2018.
- 10. Valerio CJ, Schreiber BE, Handler CE, Denton CP, Coghlan JG. Borderline mean pulmonary artery pressure in patients with systemic sclerosis: transpulmonary gradient predicts risk of developing pulmonary hypertension. Arthritis Rheum. 2013;65:1074–1084. [DOI] [PubMed] [Google Scholar]
- 11. Heresi GA, Minai OA, Tonelli AR, Hammel JP, Farha S, Parambil JG, Dweik RA. Clinical characterization and survival of patients with borderline elevation in pulmonary artery pressure. Pulm Circ. 2013;3:916–925. [DOI] [PMC free article] [PubMed] [Google Scholar]
- 12. Suzuki A, Taniguchi H, Watanabe N, Kondoh Y, Kimura T, Kataoka K, Matsuda T, Yokoyama T, Sakamoto K, Nishiyama O, Hasegawa Y. Significance of pulmonary arterial pressure as a prognostic indicator in lung‐dominant connective tissue disease. PLoS One. 2014;9:e108339. [DOI] [PMC free article] [PubMed] [Google Scholar]
- 13. Takahashi K, Taniguchi H, Ando M, Sakamoto K, Kondoh Y, Watanabe N, Kimura T, Kataoka K, Suzuki A, Ito S, Hasegawa Y. Mean pulmonary arterial pressure as a prognostic indicator in connective tissue disease associated with interstitial lung disease: a retrospective cohort study. BMC Pulm Med. 2016;16:55. [DOI] [PMC free article] [PubMed] [Google Scholar]
- 14. Abramson SV, Burke JF, Kelly JJ Jr, Kitchen JG III, Dougherty MJ, Yih DF, McGeehin FC III, Shuck JW, Phiambolis TP. Pulmonary hypertension predicts mortality and morbidity in patients with dilated cardiomyopathy. Ann Intern Med. 1992;116:888–895. [DOI] [PubMed] [Google Scholar]
- 15. Kjaergaard J, Akkan D, Iversen KK, Kjoller E, Kober L, Torp‐Pedersen C, Hassager C. Prognostic importance of pulmonary hypertension in patients with heart failure. Am J Cardiol. 2007;99:1146–1150. [DOI] [PubMed] [Google Scholar]
- 16. Shalaby A, Voigt A, El‐Saed A, Saba S. Usefulness of pulmonary artery pressure by echocardiography to predict outcome in patients receiving cardiac resynchronization therapy heart failure. Am J Cardiol. 2008;101:238–241. [DOI] [PubMed] [Google Scholar]
- 17. Lam CS, Borlaug BA, Kane GC, Enders FT, Rodeheffer RJ, Redfield MM. Age‐associated increases in pulmonary artery systolic pressure in the general population. Circulation. 2009;119:2663–2670. [DOI] [PMC free article] [PubMed] [Google Scholar]
- 18. Damy T, Goode KM, Kallvikbacka‐Bennett A, Lewinter C, Hobkirk J, Nikitin NP, Dubois‐Rande JL, Hittinger L, Clark AL, Cleland JG. Determinants and prognostic value of pulmonary arterial pressure in patients with chronic heart failure. Eur Heart J. 2010;31:2280–2290. [DOI] [PubMed] [Google Scholar]
- 19. Cabrita IZ, Mohammed A, Layton M, Ghorashian S, Gilmore A, Cho G, Howard J, Anie KA, Desforges L, Bassett P, Grapsa J, Howard L, Mahalingam G, Dawson D, Pinto FJ, Nihoyannopoulos P, Davies SC, Gibbs JS. The association between tricuspid regurgitation velocity and 5‐year survival in a North West London population of patients with sickle cell disease in the United Kingdom. Br J Haematol. 2013;162:400–408. [DOI] [PubMed] [Google Scholar]
- 20. Choudhary G, Jankowich M, Wu WC. Elevated pulmonary artery systolic pressure predicts heart failure admissions in African Americans: Jackson Heart Study. Circ Heart Fail. 2014;7:558–564. [DOI] [PMC free article] [PubMed] [Google Scholar]
- 21. Bossone E, Rubenfire M, Bach DS, Ricciardi M, Armstrong WF. Range of tricuspid regurgitation velocity at rest and during exercise in normal adult men: implications for the diagnosis of pulmonary hypertension. J Am Coll Cardiol. 1999;33:1662–1666. [DOI] [PubMed] [Google Scholar]
- 22. Mahjoub H, Levy F, Cassol M, Meimoun P, Peltier M, Rusinaru D, Tribouilloy C. Effects of age on pulmonary artery systolic pressure at rest and during exercise in normal adults. Eur J Echocardiogr. 2009;10:635–640. [DOI] [PubMed] [Google Scholar]
- 23. Chemla D, Castelain V, Humbert M, Hebert JL, Simonneau G, Lecarpentier Y, Herve P. New formula for predicting mean pulmonary artery pressure using systolic pulmonary artery pressure. Chest. 2004;126:1313–1317. [DOI] [PubMed] [Google Scholar]
- 24. Sterne JA, Egger M, Smith GD. Systematic reviews in health care: investigating and dealing with publication and other biases in meta‐analysis. BMJ. 2001;323:101–105. [DOI] [PMC free article] [PubMed] [Google Scholar]
- 25. Duval S, Tweedie R. Trim and fill: a simple funnel‐plot‐based method of testing and adjusting for publication bias in meta‐analysis. Biometrics. 2000;56:455–463. [DOI] [PubMed] [Google Scholar]
- 26. Rao G, Lopez‐Jimenez F, Boyd J, D'Amico F, Durant NH, Hlatky MA, Howard G, Kirley K, Masi C, Powell‐Wiley TM, Solomonides AE, West CP, Wessel J. Methodological standards for meta‐analyses and qualitative systematic reviews of cardiac prevention and treatment studies: a scientific statement from the American Heart Association. Circulation. 2017;136:e172–e194. [DOI] [PubMed] [Google Scholar]
- 27. Maron BA, Abman SH. Translational advances in the field of pulmonary hypertension: focusing on developmental origins and disease inception for the prevention of pulmonary hypertension. Am J Respir Crit Care Med. 2017;195:292–301. [DOI] [PMC free article] [PubMed] [Google Scholar]
- 28. Kaymaz C, Akbal OY, Hakgor A, Tokgoz HC, Tanboga IH, Aktemur T, Turkday S, Tanyeri S, Poci N, Keskin B, Dogan C, Bayram Z, Acar RD, Ozdemir N. Reappraisal of the reliability of Doppler echocardiographic estimations for mean pulmonary artery pressure in patients with pulmonary hypertension: a study from a tertiary centre comparing four formulae. Pulm Circ. 2018;8:2045894018762270. [DOI] [PMC free article] [PubMed] [Google Scholar]
- 29. Fisher MR, Forfia PR, Chamera E, Housten‐Harris T, Champion HC, Girgis RE, Corretti MC, Hassoun PM. Accuracy of Doppler echocardiography in the hemodynamic assessment of pulmonary hypertension. Am J Respir Crit Care Med. 2009;179:615–621. [DOI] [PMC free article] [PubMed] [Google Scholar]
- 30. Maron BA, Brittain EL, Choudhary G, Gladwin MT. Redefining pulmonary hypertension. Lancet Respir Med. 2018;6:168–170. [DOI] [PubMed] [Google Scholar]
- 31. ClinicalTrials.gov . NCT02290613 Early Treatment of Borderline Pulmonary Arterial Hypertension Associated With Systemic Sclerosis (SSc‐APAH) (EDITA). 2017. https://clinicaltrials.gov/ct2/show/NCT02290613. Accessed March 21, 2018.


