

Abstract
Background
The SWEET (Sugars Will Eventually be Exported Transporters) gene family is a recently identified group of sugar transporters that play an indispensable role in sugar efflux, phloem loading, plant-pathogen interaction, nectar secretion, and reproductive tissue development. However, little information on Saccharum SWEET is available for this crop with a complex genetic background.
Results
In this study, 22 SWEET genes were identified from Saccharum spontaneum Bacterial Artificial Chromosome libraries sequences. Phylogenetic analyses of SWEETs from 11 representative plant species showed that gene expansions of the SWEET family were mainly caused by the recent gene duplication in dicot plants, while these gene expansions were attributed to the ancient whole genome duplication (WGD) in monocot plant species. Gene expression profiles were obtained from RNA-seq analysis. SWEET1a and SWEET2s had higher expression levels in the transitional zone and maturing zone than in the other analyzed zones. SWEET1b was mainly expressed in the leaf tissues and the mature zone of the leaf of both S. spontaneum and S. officinarum, and displayed a peak in the morning and was undetectable in both sclerenchyma and parenchyma cells from the mature stalks of S. officinarum. SsSWEET4a\4b had higher expression levels than SWEET4c and were mainly expressed in the stems of seedlings and mature plants. SWEET13s are recently duplicated genes, and the expression of SWEET13s dramatically increased from the maturing to mature zones. SWEET16b’s expression was not detected in S. officinarum, but displayed a rhythmic diurnal expression pattern.
Conclusions
Our study revealed the gene evolutionary history of SWEETs in Saccharum and SWEET1b was found to be a sucrose starvation-induced gene involved in the sugar transportation in the high photosynthetic zones. SWEET13c was identified as the key player in the efflux of sugar transportation in mature photosynthetic tissues. SWEET4a\4b were found to be mainly involved in sugar transportation in the stalk. SWEET1a\2a\4a\4b\13a\16b were suggested to be the genes contributing to the differences in sugar contents between S. spontaneum and S. officinarum. Our results are valuable for further functional analysis of SWEET genes and utilization of the SWEET genes for genetic improvement of Saccharum for biofuel production.
Electronic supplementary material
The online version of this article (10.1186/s12870-018-1495-y) contains supplementary material, which is available to authorized users.
Keywords: Gene expression, Gene evolution, Saccharum officinarum, Saccharum spontaneum, Sugar transport, SWEET
Background
In mesophyll cells, carbon fixation allows the production of sugars by photosynthesis. Sugars are not only key energy sources for many biological activities in plants and human, but also function as important signaling molecules [1]. In plants, sugars are transported from prototrophic tissues (leaves, source) to heterotrophic cells or tissues (seeds, sink) via plasmodesmata or the apoplastic pathway. There are three gene families of transporters that play a key role in the intercellular transport of sugars: MonoSaccharide Transporters (MSTs), Sucrose Transporters/SucroseCarriers (SUTs) [2–5], and SWEETs [6–8]. The first two gene families of sugar transporter, MSTs and SUTs, have been extensively studied in higher plants in the last two decades [4, 9–16], whereas the SWEET gene family was recently identified as sugar effluxers [7] based the role of its members in the transport of hexose or sucrose across cell membranes.
The first member of the MtN3/saliva/SWEET gene family, MtN3, was identified as nodulin in the interaction between the legume Medicago truncatula and Rhizobium during nodule development [17], and another SWEET-type gene, saliva, was identified in Drosophila as a salivary gland specific gene during embryonic development [18]. Since 2010, SWEETs and their prokaryotic homologues have been identified in various organisms, spanning from Archaea to plants and humans, based on their sugar transporter function [6, 8, 19–21]. In rice, the paralogous OsSWEET11/Os8N3/Xa13 and OsSWEET14/Xa25 are targeted by the pathogenic bacterium Xanthomonas oryzae pv. oryzae (Xoo) and hijacked for nutritional gain to support their own growth, which results in bacterial blight [22]. A more recent study showed that both rice OsSWEET4 and its maize ortholog ZmSWEET4c encode for hexose transporters, and the mutants of these two genes are defective in seed filling, indicating that a lack of hexose transport in the basal endosperm transfer layer (BETL) fails to sustain development of the large starch-storing endosperm of cereal grains [19]. In Arabidopsis, AtSWEET11 and AtSWEET12 localize to the plasma membrane of the phloem parenchyma cells. Analysis of atsweet11/12 double mutant plants showed an impaired ability to export sucrose from leaves [8]. AtSWEET16 and AtSWEET17 have been identified as vacuolar hexose transporters controlling leaf fructose content [20, 21]. AtSWEET9 was shown to be a nectary-specific sugar transporter and responsible for nectar production [6]. Eom [23] and Chen [24] recently reviewed the function of the SWEET family proteins in diverse biological and physiological processes including phloem loading, leaf and senescence fructose conservation, pollen nutrition and seed filling, pathogen susceptibility, nectar secretion.
Sugarcane contributes to approximately 80% of the sugar and 40% of ethanol world production [25]. Remarkably, sugarcane can accumulate vast amounts of sucrose up to 700 mM or more than 50% of the dry weight (DW) in its stems [26]. Modern sugarcane cultivars are hybrids derived from the cross between S. officinarum and S. spontaneum, resulting in extreme allopolyploidy levels that can range from octoploidy (x = 8) to dodecaploidy (x = 12). The genetic background for sugar accumulation of modern sugarcane cultivars has been suggested to be conferred by S. officinarum, while stress tolerance was attributed to S. spontaneum. Sucrose photosynthesized in the sugarcane leaf (source) is transported to phloem parenchyma cells for loading [27]. Allocation of sucrose is facilitated by long and short-distance transport systems [28, 29]. Ultimately, it is unloaded from the phloem and imported into parenchyma cells in the stem (sink) storage tissue for further metabolism. During the whole process, some of the sucrose is exported into the cell wall, where is hydrolyzed by invertases into fructose and glucose to sustain growth at specific sites [30, 31], demonstrating that the apoplast solution of sugarcane stalk tissues contains high concentrations of sucrose. Recently, the gene families related to sugar accumulation in sugarcane have been extensively studied [32–36].
In spite of the great significance of SWEETs in sugarcane, the SWEET gene family had not been identified in sugarcane until now because sugarcane genome information was unavailable, and SWEETs are a recently identified class of sugar transporters. In this study, given the multiple roles of SWEETs particularly in sugar transport and pathogen susceptibility, based on our high coverage BAC libraries, we investigated the SWEET genes in Saccharum. To understand the molecular and evolutionary characterization and gene functions of the SWEET family in sugarcane, we investigated the phylogenetic relationships among different species, analyzed exon/intron organization, and gene expression. The results presented here provide a reference for further studies on the biological and physiological functions of SWEET genes, and shed light on the mechanisms of sugar accumulation in sugarcane.
Results
Identification of SWEET genes in sugarcane and other species
Based on the reference sequences of SWEETs from previous studies in Oryza sativa [37] and Arabidopsis thaliana [38], the SWEET genes were searched from 10 representative plant genomes downloaded from phytozome 10 [39]. Moreover, the hidden Markov model-based HMMER program [40] was run for the 10 representative plant genomes, confirming 173 SWEET genes with high homology (Fig. 1), which included 4 in Chlamydomonas reinhardtii, 8 in Amborella trichopoda, 15 in Vitis vinifera, 17 in Arabidopsis thaliana, 23 in Medicago truncatula, 25 in Populus trichocarpa,12 in Ananus comosus, 23 in Sorghum bicolor, 23 in Zea mays, and 23 in Oryza sativa.
Fig. 1.

Phylogenetic relationships of SWEET families based on the current data for angiosperms were used in this study [94]. The number of SWEET genes found in the genome of each species is indicated
Using the protein sequences of sorghum SWEET genes as a reference, we identified 22 S. spontaneum SWEET haplotypes, excluding gene alleles from the high coverage BAC sequence database. The recently published tetraploidy S. spontaneum genome [41] combined with the sorghum genome were further used as reference, each of these genes were observed to have an average of 3 allelic haplotypes in the S. spontaneum genome. Of the 22 SWEET gene members in S. spontaneum, two genes(SsSWEET12, SsSWEET16a), were located on chromosome 1, four genes (SsSWEET11b, SsSWEET13a, SsSWEET13b, SsSWEET13c) were located on chromosome 2, seven genes (SsSWEET1a, SsSWEET2a, SsSWEET2b, SsSWEET3b, SsSWEET4d, SsSWEET6, SsSWEET16b) were located on chromosome 3, four genes (SsSWEET4a, SsSWEET4b, SsSWEET4c, SsSWEET15) were located on chromosome 4, two genes(SsSWEET11a, SsSWEET14), were located on chromosome 6, and three genes (SsSWEET1b, SsSWEET3a, SsSWEET5) were located on chromosome 7. Noteworthy, the three SWEET13s and three of SsSWEET4s (SsSWEET4a, SsSWEET4b, SsSWEET4c) were originated from tandem duplications, respectively (Additional file 1). For consistency, S. spontaneum SWEET genes were named based on the previously reported O. sativa SWEET nomenclature [22, 42] and phylogenetic relationships. If two or more S. spontaneum genes were equally close to a single rice gene, then the same name was used followed by the letters “a”, “b”, “c” “d” and “e”. More details about other features, including protein and expressed sequence tags (EST) sequence information, are presented in Table 1. The 22 S. spontaneum SWEET genes nucleotide sequences were submitted to GenBank with accession numbers MG204840-MG204861.
Table 1.
Comparison of the information of the SWEETs between Saccharum spontaneum and Sorghum bicolor
| Sorghum bicolor | Saccharum spontaneum | ||||||||||||
|---|---|---|---|---|---|---|---|---|---|---|---|---|---|
| Gene | AA | Mw (kDa) |
pI | TM | MtN3/saliva domain position | Gene | AA | Mw (kDa) |
pI | TM | MtN3/saliva domain position | ESTs | Similarities |
| Sb03g041740 | 269 | 29.07 | 9.36 | 6 | 7–96,130–215 | SsSWEET1a | 269 | 29.23 | 9.34 | 6 | 7–92,130–216 | 21 | 93% |
| Sb09g020860 | 256 | 27.27 | 9.12 | 7 | 8–95,134–215 | SsSWEET1b | 277 | 28.69 | 9.05 | 8 | 31–113,152–232 | 7 | 94% |
| Sb03g024250 | 243 | 26.82 | 8.86 | 7 | 26–108,145–226 | SsSWEET2a | 243 | 26.95 | 8.86 | 7 | 26–108,145–226 | 10 | 98% |
| Sb03g032190 | 231 | 25.15 | 9.18 | 7 | 13–99,136–219 | SsSWEET2b | 227 | 23.09 | 9.13 | 6 | 13–99,156–204 | 5 | 88% |
| Sb09g006950 | 246 | 27.34 | 8.75 | 7 | 7–98,132–218 | SsSWEET3a | 412 | 45.31 | 8.87 | 7 | 8–97,143–226 | 3 | 75% |
| Sb03g001520 | 259 | 28.39 | 8.94 | 7 | 10–98,134–217 | SsSWEET3b | 292 | 32.16 | 8.62 | 6 | 10–98,162–244 | – | 83% |
| Sb04g015420 | 250 | 27.20 | 9.36 | 7 | 11–94,133–217 | SsSWEET4a | 253 | 26.49 | 9.46 | 7 | 11–94,133–217 | 23 | 98% |
| Sb04g012910 | 250 | 27.43 | 9.54 | 7 | 11–94,133–217 | SsSWEET4b | 254 | 26.78 | 9.44 | 7 | 10–94,133–217 | 36 | 97% |
| Sb04g012920 | 252 | 27.62 | 9.38 | 7 | 11–92,133–217 | SsSWEET4c | 251 | 27.61 | 9.26 | 7 | 11–92,133–217 | 7 | 93% |
| Sb03g003470 | 213 | 23.69 | 4.53 | 7 | 5–87,120–203 | SsSWEET4d | 362 | 36.87 | 6.24 | 6 | 162–240,279–361 | – | 33% |
| Sb03g003480 | 242 | 26.18 | 6.87 | 6 | 12–95,135–194 | N/A | N/A | N/A | N/A | N/A | N/A | N/A | N/A |
| Sb09g030270 | 239 | 25.93 | 6.81 | 7 | 10–97,133–215 | SsSWEET5 | 239 | 24.68 | 7.62 | 7 | 10–97,133–215 | – | 93% |
| Sb03g027260 | 244 | 27.20 | 9.30 | 7 | 10–97,133–216 | SsSWEET6 | 291 | 30.40 | 9.53 | 8 | 10–97,202–263 | 3 | 80% |
| Sb07g026040 | 310 | 33.52 | 9.45 | 7 | 17–100,136–218 | SsSWEET11a | 308 | 31.66 | 9.36 | 7 | 17–100,136–219 | 7 | 98% |
| Sb02g029430 | 273 | 29.75 | 9.03 | 7 | 15–99,136–218 | SsSWEET11b | 286 | 29.30 | 9.08 | 7 | 15–99,136–220 | 1 | 90% |
| Sb01g035490 | 314 | 34.39 | 6.84 | 7 | 11–95,133–214 | SsSWEET12 | 308 | 33.72 | 5.41 | 7 | 11–94,132–213 | – | 93% |
| Sb08g014040 | 303 | 33.01 | 9.50 | 7 | 13–99,134–218 | SsSWEET13a | 304 | 31.57 | 9.57 | 7 | 13–99,134–218 | 13 | 95% |
| Sb08g013840 | 303 | 33.24 | 9.74 | 7 | 13–99,134–218 | SsSWEET13b | 302 | 33.14 | 9.50 | 7 | 13–99,134–218 | 13 | 93% |
| Sb08g013620 | 305 | 33.25 | 9.48 | 7 | 13–98,134–218 | SsSWEET13c | 303 | 33.11 | 9.55 | 7 | 13–99,134–218 | 14 | 97% |
| Sb05g018110 | 292 | 31.82 | 9.21 | 7 | 13–101,136–219 | SsSWEET14 | 272 | 28.39 | 9.12 | 6 | 11–79,114–197 | 8 | 86% |
| Sb04g021000 | 338 | 35.69 | 7.61 | 7 | 14–99,135–219 | SsSWEET15 | 327 | 33.21 | 5.96 | 7 | 14–99,135–219 | 6 | 87% |
| Sb01g035840 | 330 | 35.19 | 9.30 | 7 | 7–92,129–212 | SsSWEET16a | 320 | 32.72 | 9.50 | 7 | 7–92,128–212 | 4 | 89% |
| Sb03g012930 | 242 | 26.38 | 6.41 | 6 | 6–93,129–215 | SsSWEET16b | 240 | 25.22 | 6.27 | 7 | 7–92,130–214 | 1 | 93% |
The 22 identified SsSWEET genes contain full open reading frames (ORFs) with predicted molecular weights ranging between 23.09 to 45.31 kDa with an average of 30.7 kDa (Table 1). Two hundred thirty-one pair-wise sequence comparisons among the SsSWEETs showed that three pairs of SsSWEET13s shared the highest similarities in protein sequences ranging from 93 to 95%, and three pairs SsSWEET4s (a, b, and c) had the second highest protein sequence similarities ranging from 83 to 93%. The remaining 225 gene pairs had protein sequences identities ranging from 27 to 73% with an average of 39% (Additional file 2).
Comparisons of SsSWEETs with their orthologs in sorghum showed that two SsSWEETs (SsSWEET3a and SsSWEET4d) had larger protein sizes than their sorghum orthologs (Table 1). SsSWEET3a had one additional exon (the last exon) compared to its sorghum ortholog (Sb09g006950), whereas SsSWEET4d harbored a first exon larger than its ortholog (Sb03g003470) (Fig. 2). Deduced protein sequences comparisons showed that S. spontaneum and sorghum shared identities ranging from 33 to 98% with an average of 88%. Saccharum ESTs from the NCBI Genbank database were searched for SsSWEETs (Table 1).
Fig. 2.
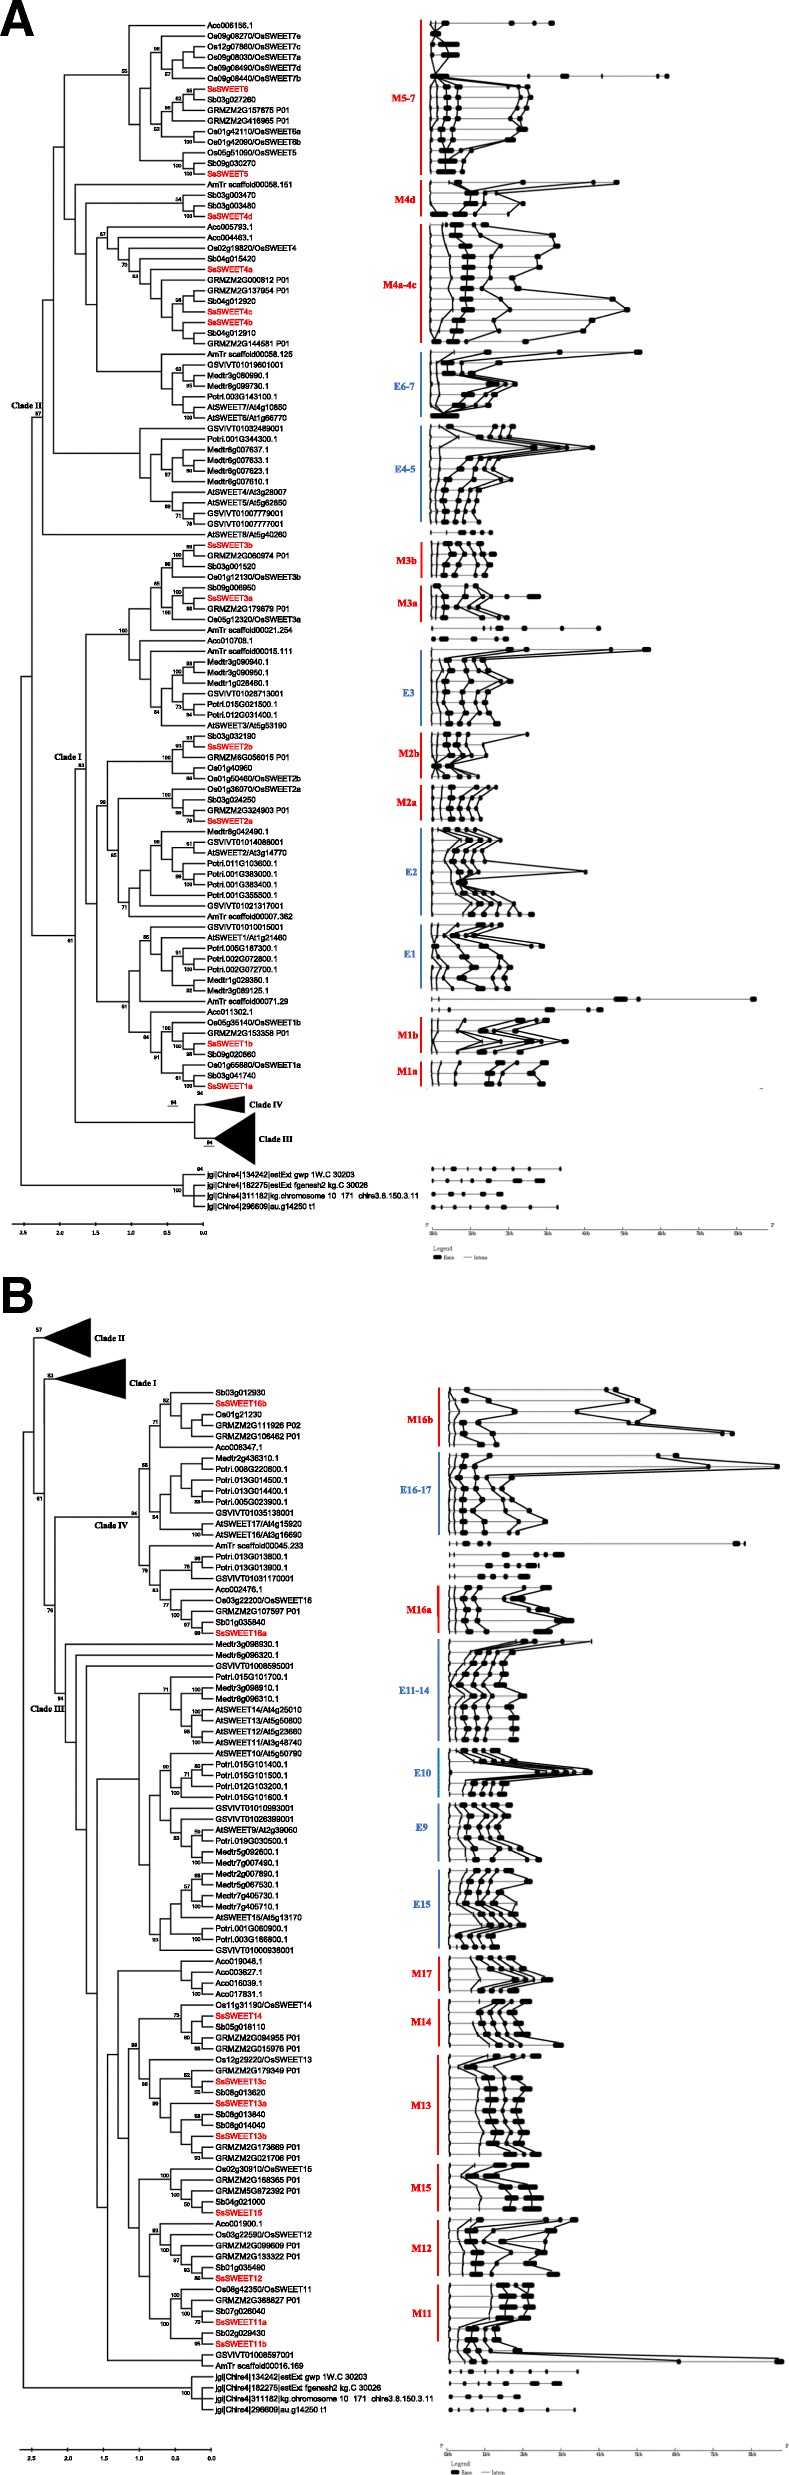
Phylogeny and schematic diagram for intron/exon organization of SWEET genes from 11 plant species. The corresponding exons with similar sequences based on sequence alignments were indicated with solid lines. a Clade I and Clade II. b Clade III and Clade IV
To investigate the possible evolutionary functional constraints after the split of sorghum and Saccharum, the nonsynonymous to synonymous substitution ratio (Ka/Ks) was analyzed for orthologous gene pairs of SWEETs between sorghum and S. spontaneum. Apart from SsSWEET4d, the Ka/Ks ratios were less than 0.5, indicating that purifying selection was the dominant force for driving the evolution of SsSWEET genes (Table 2).
Table 2.
Calculation of substitution rates of homologues SWEET genes between Saccharum spontaneum and Sorghum bicolor
| Gene pair | S-Sites | N-Sites | Ka | Ks | Ka/Ks | ||
|---|---|---|---|---|---|---|---|
| Clade I | SsSWEET1 | Sb09g020860 | 105.1 | 644.9 | 0.0451 | 0.1673 | 0.2696 |
| SsSWEET2 | Sb03g032190 | 106.2 | 646.8 | 0.0613 | 0.3314 | 0.1851 | |
| SsSWEET3a | Sb09g006950 | 73.1 | 643.9 | 0.096 | 0.2051 | 0.4679 | |
| SsSWEET3b | Sb03g001520 | 83.1 | 648.9 | 0.0413 | 0.1782 | 0.232 | |
| Clade II | SsSWEET4d | Sb03g003470 | 159.7 | 420.2 | 0.5298 | 0.5749 | 0.9215 |
| N/A | Sb03g003480 | N/A | N/A | N/A | N/A | N/A | |
| SsSWEET4a | Sb04g015420 | 203.5 | 573.5 | 0.0086 | 0.3632 | 0.0238 | |
| SsSWEET4b | Sb04g012910 | 135.9 | 614.1 | 0.0095 | 0.267 | 0.0355 | |
| SsSWEET4c | Sb04g012920 | 140.9 | 372.1 | 0.0233 | 0.3578 | 0.0652 | |
| SsSWEET5 | Sb09g030270 | 113.5 | 654.5 | 0.0256 | 0.3868 | 0.0661 | |
| SsSWEET6 | Sb03g027260 | 92.8 | 528.2 | 0.02 | 0.4329 | 0.0461 | |
| Clade III | SsSWEET11a | Sb07g026040 | 164.6 | 744.4 | 0.008 | 0.1685 | 0.0475 |
| SsSWEET11b | Sb02g029430 | 109.1 | 676.9 | 0.0291 | 0.1804 | 0.161 | |
| SsSWEET12 | Sb01g035490 | 159.9 | 821.1 | 0.0186 | 0.1214 | 0.1535 | |
| SsSWEET13a | Sb08g014040 | 148.2 | 775.8 | 0.0177 | 0.4333 | 0.0408 | |
| SsSWEET13b | Sb08g013840 | 113.9 | 810.1 | 0.0484 | 0.4496 | 0.1077 | |
| SsSWEET13c | Sb08g013620 | 108.8 | 707.2 | 0.0091 | 0.3827 | 0.0237 | |
| SsSWEET14 | Sb05g018110 | 142.2 | 763.8 | 0.0443 | 0.4067 | 0.1089 | |
| SsSWEET15 | Sb04g021000 | 161.9 | 741.1 | 0.0499 | 0.2817 | 0.1771 | |
| Clade IV | SsSWEET16a | Sb01g035840 | 109.8 | 844.2 | 0.037 | 0.2446 | 0.1512 |
| SsSWEET16b | Sb03g012930 | 102.9 | 386.1 | 0.0377 | 0.0916 | 0.4117 | |
Phylogeny and divergence of SWEET genes in S. spontaneum and angiosperms
To better understand the evolution of SWEET orthologs in different plants, we constructed an unrooted phylogenetic tree with 195 SWEET genes from 11 representative plant species using Maximum Likelihood (ML) and Neighbor-Joining (NJ) methods, respectively (Fig. 2, Additional file 3). The 11 representative plant species included dicots (V. vinifera, A. thaliana, P trichocarpa and M. truncatula), monocots (A. comosus, O.sativa, Z. mays, S. bicolor and S. spontaneum), A. trichopoda (basal angiosperms), and C. reinhardtii. Consistently with a previous study [7], SWEETs from different species could be divided into four clades (I, II, III and IV) (Additional file 3). In the earliest diverging angiosperm, A.trichopoda, there were only 8 SWEETs, whereas in dicots and monocots the number of SWEETs varied between 12 and 25, indicating that gene expansion had occurred in SWEET genes in both monocot and dicot lineages (Fig. 1). Within the four clades, clade III was observed to have a great expansion of SWEET genes in both monocot and dicot lineages as highlighted by the evidence that there is only 1 in A. trichopoda, while there are at least 5 SWEETs in both monocots and dicots (Fig. 1).
Based on their phylogenetic distribution, angiosperm SWEET genes can be approximately divided into 27 subfamilies including 10 from dicots and 17 from monocots. These subfamilies are referred to as 10 eudicot subfamilies E1 (Eudicot1), E2, E3, E4–5, E6–7, E9, E10, E11–14, E15, and E16–17, and 17 monocot subfamilies, M1a (Monocot1), M1b, M2a, M2b, M3a, M3b, M4a-4c, M4d, M5–7, M11, M12, M13, M14, M15, M16a, M16b and M17 (Fig. 2). These eudicot subfamilies generally contained SWEETs from all four examined eudicot species (V. vinifera, P. trichocarpa, A. thaliana, and M. truncatula), but had a different number among the eudicot species. Among all monocot subfamilies, only the M1, M4, M5–7, M12, and M16 subfamilies included SWEET genes from all five examined Poaceae species, indicating that the progenitors of those genes may have already existed prior to the split of Poaceae. Eight subfamilies, M2a, M2b, M3a, M3b, M11, M13, M14 and M15, existed in four monocotyledonous plant species, excluding A. comosus, thus demonstrating that these subfamilies originated before the pan-grass ρWGD event and after the rise of Poales from commelinids [43].
Recent duplications were observed to be frequent in SWEETs in both dicots and monocots. For example, SWEETs in A. thaliana within E4–5, E6–7, E16–17 and E11–14, P. trichocarpa within E1, E2, E3, E10, E15 and E16–17, A. comosus within M4a-4c and M17, S. bicolor in M4d, M11 and M13. These results suggested that SWEET families undergo active gene expansion in angiosperms.
We estimated the divergence time among four clades of SsSWEET gene family based on the pairwise synonymous substitution rates (Ks) in S. spontaneum (Table 3). The median values of pairwise Ks ranged from 3.483 to 3.682, corresponding to a divergence time ranging from 285.5 to 301.8 Mya, suggesting that the SWEETs in the four clades were ancient and divergent. Moreover, the divergence time among the three SWEET13s ranged from 19.7 to 22.1 Mya with an average of 20.1 Mya (Table 4). These results indicate that the SsSWEET family is an ancient gene family with recent gene duplication events in Saccharum.
Table 3.
Divergence time among four Clade of SsSWEET gene family in Saccharum spontaneum
| Clade | Median Ks | Gene pairs used | Divergence time (mya) |
|---|---|---|---|
| Clade I/Clade II | 3.548 | 36 | 290.8 |
| Clade I/Clade III | 3.619 | 48 | 296.7 |
| Clade I/Clade IV | 3.682 | 12 | 301.8 |
| Clade II/Clade III | 3.483 | 48 | 285.5 |
| Clade II/Clade IV | 3.593 | 12 | 294.5 |
| Clade III/Clade IV | 3.610 | 16 | 295.9 |
Table 4.
Divergence between paralogous SsSWEET gene pairs in Saccharum spontaneum
| Gene1 | Gene2 | Ka | Ks | Ka/Ks | Divergence time (Mya) | P-Value(Fisher) |
|---|---|---|---|---|---|---|
| SsSWEET4a | SsSWEET4b | 0.036 | 0.866 | 0.042 | 71.0 | 1.07E-28 |
| SsSWEET4a | SsSWEET4c | 0.093 | 0.968 | 0.096 | 79.4 | 7.20E-24 |
| SsSWEET4b | SsSWEET4c | 0.071 | 1.044 | 0.068 | 85.6 | 3.04E-21 |
| SsSWEET13a | SsSWEET13b | 0.020 | 0.269 | 0.076 | 22.1 | 1.39E-16 |
| SsSWEET13a | SsSWEET13c | 0.023 | 0.240 | 0.095 | 19.7 | 7.44E-14 |
| SsSWEET13b | SsSWEET13c | 0.021 | 0.250 | 0.085 | 20.5 | 1.04E-14 |
Exon–intron organizations of SsSWEET genes
To investigate the structural characteristics and evolution of the SWEET gene family, we analyzed the pattern of intron/exon distribution and position of the SWEET genes, and then mapped them to the phylogenic tree (Fig. 2). The corresponding exons with similar sequences, based on sequence alignments, are indicated with a solid line in Fig. 2. The number of exons in the SWEET family of the examined plant species varied from one to eight, with more than half of the SWEET genes (107/195, 54.8%) having six exons, suggesting that the last common ancestor (LCA) of angiosperm SWEETs had six exons. Moreover, in the examined SWEETs, the exon sizes were conserved, whereas the variation in gene size was observed to be caused by intron insertions (Fig. 2).
Conserved domains of SWEETs in S. spontaneum
The typical structure of plant SWEET proteins consists of seven predicted transmembrane (7-TM) helices forming two MtN3_slv domains (triple-helix bundles, THB) connected by a linker transmembrane helix (TM4) [44, 45]. We analyzed the domain architecture of SWEETs from O. sativa, S. bicolor, Z. mays and S. spontaneum, and found that 95.6% of SWEETs contain two MtN3_slv domains, indicating that maintenance of two domains is important for the function of SWEET proteins. However, several members harbor only one MtN3_slv domain, i.e. LOC_Os09g08270/OsSWEET7e, and LOC_Os01g40960, which may result in non-functionalization, neo-functionalization or sub-functionalization. Consistent with previous studies in plants [46, 47], all SWEET members harbored two MtN3_slv domains with an average of 291 amino acids in S. spontaneum (Additional file 4).
To further investigate the conserved status of the MtN3_slv domain within the gene family, 22 SWEET protein sequences from S. spontaneum and one rice protein OsSWEET2b sequence [48] were aligned to predict conserved domains (Fig. 3). The alignment showed that the residues T30, F31, P47, Y48, and Y61 on THB1 and R131, G136, P150, V157, E164, P167, L170, and S171 on THB2 were completely conserved in the 22 proteins in comparison with OsSWEET2b. In addition, more than 95% of the SsSWEET family members contained G16, P27, L52, N77, G80, S162, V163, Y184, D190, P196, N197, G200, Q207, Y211, and Y214 residues, suggesting that residues in the second MtN3_slv domain are more conserved than those in the first. Among them, the prolines in transmembrane 1(TM1), TM2, TM5 and TM6 were conserved in the 22 proteins, except for a cysteine-substitution in the TM1 of SsSWEET14, this being intuitive given the important roles of the proline tetrad in the transport mechanism [44]. In addition, two conserved residues (Asn77 and Asn197) surrounding the putative substrate-binding pocket in TM3 and TM7 [44], are both essential for AtSWEET1 activity at the corresponding positions (N73 and N192) [44, 49], and are retained in SsSWEET protein sequences except for SsSWEET2 and -3a.
Fig. 3.

Sequence alignment of SsSWEETs and OsSWEET2b. Amino acid sequences of SWEETs were aligned using DNAman software. Predicted secondary structure assignment based on OsSWEET2b structure is indicated above the alignment
Expression analysis of SWEET genes in S. spontaneum and S. officinarum
To investigate the potential functions of SWEET genes in Saccharum, we compared the transcriptome expression profiles of all identified Saccharum SWEET genes using four experimental sets of RNA-seq datasets: 1) Different developmental stages 2) Leaf gradient 3) Diurnal cycles 4) Parenchyma and sclerenchyma cells. Expression levels of SsSWEET2b and SsSWEET4b were verified by reverse transcription quantitative PCR (RT-qPCR) in five tissue types from two Saccharum species, S. officinarum and S. spontaneum (Additional file 5).
Expression pattern of SWEETs at different developmental stages
To explore gene functional divergence among the founding Saccharum species, we performed RNA-seq based comparative transcriptome profiling between two Saccharum species, S. officinarum and S. spontaneum, at different developmental stages and in five different tissues including the leaf (leaf roll and mature leaf) and 3 stalks (immature,, maturing and mature) (Fig. 4). Among the 22 SWEET analyzed genes, 8 genes (SWEET3b, SWEET4c, SWEET4d, SWEET4e, SWEET6, SWEET11b, SWEET12 and SWEET14) were expressed at very low or undetectable levels in all examined tissues from the two Saccharum species. SWEET3a, SWEET5 and SWEET13a were observed to have different expression levels in the two Saccharum species, SWEET3a and SWEET5 having higher expression levels in S. spontaneum than in S. officinarum, whereas SWEET13a had much higher transcript levels in S. officinarum than S. spontaneum. Three SWEET13s (13a, 13b and 13c) displayed similar expression patterns with high expression levels, but SsSWEET13c showed the highest expression levels in all organs among the 22 analyzed genes. SWEET1b and SWEET2b also had high expression levels but displayed lower expression levels in mature stem tissues than in the other examined tissues from the two species. In contrast, SWEET4a and SWEET16a showed lower expression levels in the mature leaf and leaf roll than in the other tissues from both species.
Fig. 4.
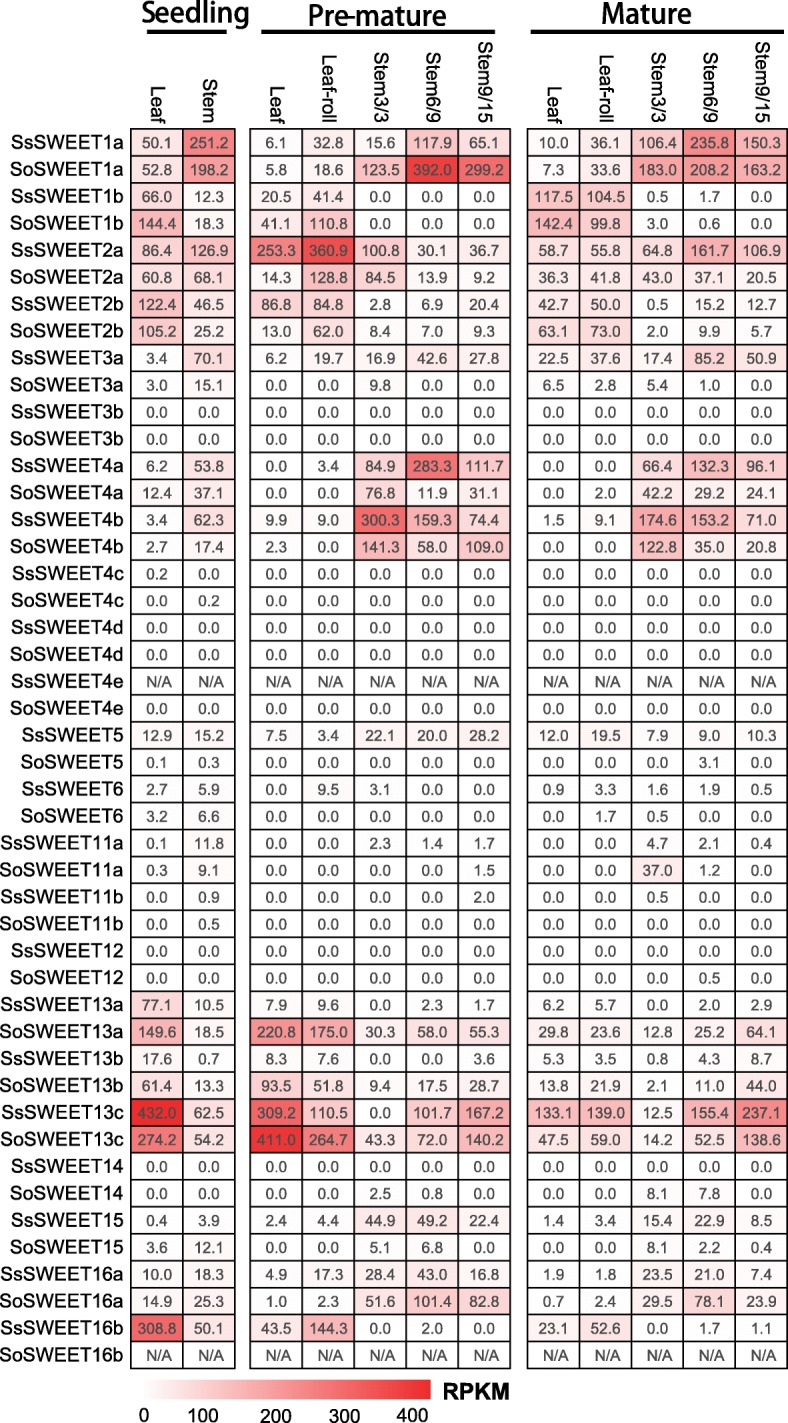
The expression pattern of SWEETs based on RPKM in different tissues of different stages in two Saccharum species
Expression patterns of SWEETs across leaf gradient segments
To further investigate the functional divergence for sugar transport in the source tissues, we exploited the continuous developmental gradient of the leaf to profile the transcriptome of SWEETs in the two Saccharum species: the high sugar content species S. officinarum, and the stress tolerant species S. spontaneum (Fig. 5a). Similarly to the maize leaf [50], the Saccharum leaf can be divided into four zones: a basal zone (base, 1 cm above the leaf two ligules, sink tissue), a transitional zone (5 cm, 1 cm below the leaf one ligule, undergoing the sink-source transition), a maturing zone (10 cm, 4 cm above the leaf one ligule), and a mature zone (tip, 1 cm below the leaf two tip, fully differentiated and with active C4 photosynthetic zones). Consistently, 8 genes (SWEET3b, SWEET4c, SWEET4d, SWEET4e, SWEET6, SWEET11b, SWEET12 and SWEET14), together with SWEET5 and SWEET15, displayed undetectable levels, suggesting that these genes play a very small role in sugar transport in Saccharum leaves (Fig. 5a). SWEET1a showed higher expression levels in the transitional zone than in the other three zones of the leaf in both Saccharum species, whereas SWEET2a displayed higher expression levels in the transitional zone and maturing zone than in the other two zones in both Saccharum species. SWEET1b’s expression gradually increased from the base to the tip of the leaf of S. sponteneum but had higher levels of expression in the maturing zone than the other three zones of S. officinarum. The expression of SWEET3a gradually decreased from the base to the tip of the leaf in S. sponteneum, and showed higher levels in S. sponteneum than in S. officinarum. The overall expression levels of both SWEET4a and SWEET4b decreased from the leaf base to the tip in the two Saccharum species.
Fig. 5.

a The expression patterns of SWEETs based on RPKM across leaf gradients in two Saccharum species. b The expression level of SWEETs based on RPKM in Parenchyma cells and sclerenchyma cells from S. officinarum
As with SWEET3a, SWEET4b presented higher expression levels in S. sponteneum than in S. officinarum. SWEET11a had much higher expression levels in the basal zone than in the other zones, suggesting that SWEET11a has an important role in sugar transport. Expression of three SWEET13s (a, b and c) dramatically increased in the maturing and mature zones of the leaf, indicating that these genes are involved in sugar transport for photosynthesis. SWEET13c had the highest expression levels among the SWEETs of the Saccharum species with higher expression in the maturing and mature zones than other zones of the leaf. Nevertheless, SWEET16b, which was undetectable in S. officinarum, showed higher levels in the maturing and mature zones than in the other examined zones of S. sponteneum.
Expression pattern of SWEETs during the diurnal cycles
Many sugar-metabolizing enzymes, for example cell-wall invertases (CWINVs), vacuolar invertases (VINVs), and sucrose synthases are regulated by the circadian clock [51]. To investigate the expression patterns of SWEETs during the diurnal cycles, we collected samples for RNA-seq at 2-h intervals over a 24-h period, and at 4-h intervals over an additional 24-h from both S. officinarum and S. spontanenum. Consistently, 8 genes (SWEET3b, SWEET4c, SWEET4d, SWEET4e SWEET6, SWEET11b, SWEET12 and SWEET14) were undetectable in the two Saccharum species, further supporting their limited role for sugar transport in Saccharum (Fig. 6). Moreover, SWEET4a, SWEET4b, SWEET11a, SWEET15, and SWEET16a also showed very low expression levels over the two 24-h periods. 8 SWEETs (SWEET1a, SWEET1b, SWEET2a, SWEET2b, SWEET5, SWEET13a, SWEET13b, SWEET13c and SWEET16b) were observed to have different diurnal expression patterns in the two Saccharum species, with SWEET1a having a peak expression by the late afternoon in S. spontaneum, while S. officinarum peaked in the morning. Except for SWEET1a, the remaining 7 genes had peak expression levels in S. spontaneum in the morning. In S. officinarum, SWEET1b and SWEET2b had a peak in expression in the morning, whereas SWEET13a, SWEET13b, SWEET13c, and SWEET2a had a peak expression at noon, suggesting SWEETs correlated with diurnal rhythms in both S. spontaneum and S. officinarum, and that the difference in gene expression observed during the circadian rhythm may be related to carbohydrates metabolism.
Fig. 6.

The expression pattern of SWEETs based on RPKM at different time periods
Expression levels of SWEETs in parenchyma and sclerenchyma cells from the high sugar content S. officinarum
Parenchyma cells in mature sugarcane stalks can accumulate sugars to levels with an osmotic potential of − 2.2 MPa [52]. To further investigate the functional divergence for sugar accumulation, we compared the transcriptome profiles of parenchyma cells and sclerenchyma cells separated from mature sugarcane stalk in S. officinarum (Fig. 5b). The expression levels of SWEETs varied between the two cell types. SoSWEET1a had higher expression levels than the other 21 SWEET genes, and together with SoSWEET2a and SoSWEET16a had higher expression levels in parenchyma than in sclerenchyma cells, indicating that these genes may be involved in the accumulation of sugars in parenchyma cells. In contrast, the expression of five genes (SoSWEET4a, SoSWEET4b, SoSWEET13a, SoSWEET13b and SoSWEET13c) in sclerenchyma cells was significantly higher than that in parenchyma cells, indicating that these genes play a role in sugar transport in Saccharum.
Expression of SWEET16b was undetectable in S. officinarum
SWEET16b was expressed in S. spontaneum but undetectable from the transcript of S. officinarum, indicating the absence of this SWEET gene in S. officinarum. Genomic DNA was analyzed by polymerase chain reaction (PCR) and the results confirmed that SWEET16b was lost in S. officinarum (Additional file 6).
Discussion
The SWEET family of sugar transporters has been recently identified in higher plants [7] . SWEETs also play a key role in pathogen susceptibility related to their function in sugar transport. Therefore, it is understandable that the SWEET gene family is the center of interest in the study of sugar accumulation and disease resistance in sugarcane. However, in spite of the great advantages offered by genome sequencing technologies in the last decade, the sugarcane genome remains unavailable due to its complex genetic background. Here, we identified 22 full-length SWEET genes from S. sponteaneum. Phylogenetic trees were made to study the evolution of SWEETs in sugarcane and other representative plants. Furthermore, based on RNA-seq data, Saccharum SWEET genes displayed specific temporal and spatial expression patterns, which provided the clues for investigating their specific functions.
Evolution of the SWEET family in Saccharum and angiosperms
The occurrence of WGDs, or polyploidy, is thought to be a common driving force for the evolution of angiosperms, the most recently evolved and most successful lineage of land plants [53–55]. These WGDs, which are associated with the origin of the recent common ancestor of extant angiosperms (ε), pan-core eudicots (γ), and monocots (ρ), have been revealed by integrated synteny, age estimates of gene duplication, and phylogenomic analysis [53, 55]. Recent studies revealed that pineapple has one fewer ancient WGD (ρ) event than the other sequenced grass genomes. This recently available WGD information, together with the 11 plant species representing major WGD events in angiosperm, made it possible to study SWEETs gene evolution in angiosperms. Consistently with previous studies [23, 42, 56, 57], our results showed that SWEETs from different species could be divided into four clades in duplicated descending order: clade II, clade I, clade III and clade IV. Based on the estimate of divergence in paralogous SWEET genes in pear, plant SWEET genes were predicted to have emerged in the Neoproterozoic period [57], which was much earlier than the origin of angiosperms. Thus, SWEETs were deduced to have multiple last common ancestors in angiosperms. In this study, based on estimation of the divergence time among four clades of SsSWEET gene family, the SsSWEET families originated (about 285.5 to 301.8 Mya, Table 3) before ε WGD in angiosperms (about 200Mya) and after ζ WGD in seed plants (about 330Mya) [53]. Therefore, the last common ancestors of the four clades in angiosperms were deduced to be retained from the ζ WGD.
In clade I, three groups, M3a/M3b/E3, M2a/M2b/E2, and M1a/M1b/E1 could be assumed to have originated from three LCAs in angiosperms, which was supported by the evidence that each of the three groups contained the genes from all the representative plants (Fig. 2). One hypothesis is that the LCAs of M2a/M2b/E2 and M1a/M1b/E1 originated from the ε WGD event after these two groups split from the LCA of clade I. The ρ duplication occurred before the origin of the lineages leading to rice, wheat and maize but after separation of the lineages leading to the grasses and pineapple 95–115 million years ago [58, 59]. Therefore, we can assume that M1a/M1b originated from the ρ duplication as each of the pair of group genes were observed to originate from a duplication event after the divergence of the lineages leading to the grasses and pineapple. In contrast, M2b may have diverged from M2a before the origin of angiosperms as M2b was separated from the subclade M2a/E2, which contained all the representative plant species. The group of M3a/M3b/E3 contained two genes (AmTr-scaffold00021.254 and AmTr-scaffold00015.111) from A. trichopoda, with one clustered with monocot genes and another clustered with dicot genes, which is explainable given that the sister of all other extant angiosperms, A. trichopoda, underwent gene duplication before the separation of dicots and monocots.
Furthermore, either monocots or dicots were subjected to gene loss in the early stages of their splits. In contrast, the expansions of SWEETs in dicots in this clade were caused by the recent gene duplication event rather than the ancient WGD event. This is demonstrated by Arabidopsis having two additional WGDs (α and β) but not containing additional SWEET members. In addition, SWEET genes from the same plant species were phylogenetically distributed together (for example, SWEET genes from P. trichocarpa within E1 and E2, SWEET genes from M. truncatula within E3). Based on the phylogenetic analysis, the evolutionary history of SWEETs in Saccharum can be sorted by age in duplicated descending order: SsSWEET2b, SsSWEET2a, SsSWEET3b/SsSWEET3a and SsSWEET1a/ SsSWEET1b.
In clade II, SWEETs expansion in Poales were also assumed to be mainly caused by ρ WGD. M5–7 groups have two subgroups of genes, of which one clustered with one pineapple SWEET, whereas the recent gene duplications contributed to SWEET expansion in rice. In M4a-4c groups, Poales plants likely retained the SWEETs inherited from σ WGD (for example: Aco005793.1 and Aco004463.1), and one of the ancestors (the common ancestor of SsSWEET4b/4c) underwent ρ WGD in the lineages leading to rice, sorghum and maize and sugarcane which generated two SWEETs (for example: SsSWEET4b/4c). M4d was only found in the Trib. Andropogoneae, making it possible to hypothesize that this group of genes originated within the Trib. Andropogoneae. Moreover, the divergence times of SsSWEET4a/b/c were estimated to range from 71 to 85 Mya (Table 4), which are consistent with the occurrence of the ρ WGD event in the cereal lineage about 70 million years ago [60, 61], supporting the hypothesis SWEETs expansion in Poales was mainly caused by ρ WGD.
Similarly to clade I, in dicots, recent duplications (tandem duplication) were the main driving force for SWEET expansion. Specifically for example, SWEETs from V. vinifera within E4–5, and SWEETs from M. truncatula within E6–7. Therefore, we can assume that the age in duplicated descending order for SWEETs in S. spontaneumis: SsSWEET4d, SsSWEET4a, SsSWEET4b/SsSWEET4c/SsSWEET5/ SsSWEET6.
Synteny could have been lost after chromosome rearrangements, fusion, and fractionation in the plant genome, complicating the phylogenetic analysis for gene evolution. In clade III, M12 containing SWEETs from the four Poales plants indicated that SWEETs were inherited from σ WGD. M11, M13, M14 and M15 were suggested to have originated from the lineages leading to rice, sorghum and maize as pineapple SWEETs were absent in these groups.One subgroup (containing Sb02029430 and SsSWEET11b) in M11 was indicated to have originated from its sister subgroup in a recent duplication in Trib. Andropogoneae. Subgroups M11/M12/M15 and M13/M14 were assumed to have originated from an LCA after the split of dicots and monocots. Subgroups M13 contained the recently duplicated SWEETs in Panicoideae. The estimated divergence times of SsSWEET13a/b/c in M13 ranged from 19.7 to 22.1 Mya (Table 3), which were similar to the divergence time between maize and Trib. Andropogoneae (sorghum) about 20 Mya [62]. Therefore, these SWEETs of M13 in Panicoideae were duplicated after the rise of Panicoideae in Gramineae. Similarly, SWEET expansion in dicots was mainly attributed to the recent duplications, especially the tandem duplication. Based on this deduction, we can speculate that the age in duplicated descending order for S. spontaneum SWEETs is: SsSWEET15, SsSWEET12, SsSWEET11a, SsSWEET11b for the group M11/M12/M15, and SsSWEET14, SsSWEET13c, SsSWEET13a/SsSWEET13b for the group M13/M14.
Clade IV contained the fewest SWEET genes among the four groups. SWEETs in both M16a and M16b were indicated to be inherited from σ WGD as both of these groups contained SWEETs from the four Poales plants. Furthermore, consistent with the other three groups, SWEET expansion in dicots was mainly attributed to the recent single gene duplications. In S. spontaneum, both SsSWEET16b and SsSWEET16a were clustered with the five examinated monocot species including pineapple, thus were predicted to have originated before the rise of Poales from commelinids and not generated by the ρ WGD. Moreover, SsSWEET16a was suggested to have been inherited from the LCA of angiosperms.
Gene families were retained from WGDs or single-gene duplicates during the evolutionary process. Among the single-gene duplications, transposed duplicates were suggested to evolve faster than tandem or proximal duplicates [63–66]. Moreover, single-gene duplicates have higher levels of expression divergence [64–67], functional innovation [68, 69], network rewiring [69] and epigenetic changes [65] than duplicated genes retained from WGDs. Based on these theories, monocot SWEET genes may in general have higher levels of gene functional divergence than dicot SWEET genes.
In parallel to phylogenetic distributions, the structure of SsSWEET genes underwent substantial variation during evolution, with the number of introns varying from one to eight. For eudicots, the finding that most (82.5%) SWEETs are six-exon genes led us to speculate that a basic gene model consisting of six exons and five introns could be deduced in the ancestral eudicot SWEET genes, from which all gene structures can evolve by the insertion and / or loss of introns. However, the exon/intron organization in monocot SWEET genes is more diverse than in dicots, which may be because SWEETs in monocot were mainly retained from WGDs, while SWEETs in dicots mainly originated from the recent single-gene duplicates. Given the fact that 20.0%, 30.9% and 40.2% of SWEET genes from monocots contain four, five and six exons, respectively, it is reasonable to postulate that apart from the six-exon ancestral genes of many clades (such as M1a, M1b, M5–7 etc.), four-exon and five-exon genes are the next ancestral genes since they are present in the ancestor of Poaceae plants, for example, the ancestral genes of subfamily M15, M14 and M11.. More unexpectedly, all members in M14 harbor 6 exons except for OsSWEET14 and SsSWEET14, which contain five exons. In contrast, its sister clade M13 was composed of five-exon genes except the six-exon LOC_Os12g29220/OsSWEET13 and GRMZM2G179349_P01 (4 exons), suggesting that the gain of an intron or fusion of exons have occurred in the ancestor of the subfamilies M14 and M13, respectively.
Typically, SWEETs contain seven transmembrane domains (TMs) consisting of two tandem repeats of 3-TM units separated by a single TM unit [44, 45], but ExtraSWEET proteins with more TMs have been reported in Vitis vinifera [70]. In this study, the 22 identified SsSWEETs possess 6–8 TMs, with a large proportion of SsSWEETs (68%) containing seven TMs (Table 1). All SWEET members contained two MtN3_slv domains, implying that SWEET proteins in S. spontaneum were generated by the duplication and fusion of a SemiSWEET [45]. The pI values of the SsSWEETs ranged from 5.41 (SsSWEET12) to 9.57 (SsSWEET13a), with the majority of members (18) exhibiting pI values > 7(Table 1). The pI values of the remaining four (SsSWEET4d, SsSWEET12, SsSWEET15 and SsSWEET16b) were lower than 7, and were distributed in clade II (SsSWEET4d), clade III (SsSWEET12 and SsSWEET15), and clade IV (SsSWEET16b), suggesting the independence between pI divergence and gene evolution.
Gene expression and functional divergence of SWEETs in Saccharum
Gene expression patterns are highly correlated with gene function in plants [71]. Previous studies on the SWEET sucrose/hexose efflux transporter genes have shown that they may play multiple roles during plant development based on their transport activity in the heterologous expression system and expression patterns in some plant species [7, 8, 45, 72]. In this study, with the aim of understanding the potential functions of SWEET in Saccharum species, we investigated SWEET gene expression patterns based on four sets of RNAseq data.
SWEET1s: SWEET1a has higher expression levels in the transitional zone and maturing zone than in the other analyzed zones, and is the dominant gene expressed in these two zones in the developmental gradient leaf sections, indicating that SWEETs have complementary gene expression for transporting sugar in different leaf sections. SWEET1a and SWEET13s were suggested to have functional specificity in the different leaf sections as SWEET13s (mostly is SWEET13c) displayed a dominant expression pattern in highly photosynthetic zones, while SWEET1a was predominantly expressed in the low photosynthetic zones. SWEET1a was also observed to be mainly expressed in the stem and had higher expression levels in the stem of S. officinarum than that of S. spontaneum at the premature stage. In many plants, sugar accumulation in meristematic sinks is source-limited and is sink-limited in storage sinks [73]. SWEET1a is also expressed at high levels in the sclerenchyma and parenchyma cells from the mature stalk (RPKM> = 250). It is possible that SWEET1a contributed to breaking through the limitations of the storage sink, and thus gave rise to the high sugar content in S. officinarum. In contrast, SWEET1b was mainly expressed in the leaf tissue and the mature zone of the leaf in the two Saccharum species, and displayed peak expression levels in the morning, while it was undetectable in both sclerenchyma cells and parenchyma cells of the mature stalk in S. officinarum. Therefore, SWEET1b appeared to be a sucrose starvation-induced gene involved in sugar transport in the highly photosynthetic zones in Saccharum.
SWEET2s: Similarly to SWEET1a, both SWEET2s were more abundant in the middle zone than in the other zones of the leaf sections, and were expressed at higher levels in S. spontaneum than in S. officinarum. SWEET2a was also observed to be upregulated in S. spontaneum in comparison to S. officinarum in the leaf tissue, especially at the maturing stage, but had lower expression levels in the leaf than in the stem at the mature stage in S. spontaneum. In sugarcane, the leaf photosynthetic activity decreased significantly during maturation due to senescence and negative feedback from the increased culm sucrose content [74–77]. Thus, we speculated that SWEET2a is involved in regulating source capacity and sink accumulation during the maturing stage in S. spontaneum. SWEET2b was mainly expressed in the leaf tissues in the two Saccharum, similarly to its orthologs in sorghum [78], indicating that this gene may be involved in sugar transport within the source tissues.
SWEET4s: SWEET4c have been well characterized in maize [19]. SWEET4 genes have three copies (SWEET4a, SWEET4b and SWEET4c) in Saccharum, sorghum and maize, and only one copy in rice (Oryza sativa), suggesting that three paralogs in the three Panicoideae species evolved from an LCA of rice and the Panicoideae species. Moreover, both ZmSWEET4c and OsSWEET4 were revealed to be responsible for transporting sugar into the endosperm and contributing to seed filling [19], suggesting a conserved function for SWEET after the divergence of maize and rice. In contrast to maize, in the two Saccharum species, SWEET4c displayed very low expression levels in all tissues, while the other two paralogs (SsSWEET4a, −4b) with higher expression levels than SWEET4c were mainly expressed in stems of seedlings and mature plants. This led us to speculate that SWEET4 genes may also be specifically related to hexose transport across the basal endosperm transfer layer, and contribute to sink strength in sugarcane, but SWEET4c may not be the pivotal player among the three SWEET4s for this reproductive process in Saccharum. SWEET4d was undetectable in the examined tissues, and similarly, its ortholog (Sb03003480) showed no expression in sorghum [78]. SWEET4d was assumed to have originated after the split of sorghum and Saccharum based on the evolutionary analysis herein before, adding further support that the SWEET4d lineage in Trib. Andropogoneae is functionally redundant. Furthermore, the absence of another orthologous tandem duplication gene (Sb03g003480) in the Saccharum species was assumed to be caused by gene fusion after the divergence of sorghum and Saccharum, together with a high divergence of sequence similarity of SWEET4d/Sb03g003470 (33%), suggesting that the SWEETs in M4d were potentially functionally redundant in Trib. Andropogoneae. The Ka/Ks of SWEET4d/Sb03g003470 was 0.92, which adds further support to the hypothesis that SWEETs in M4d are potentially functionally redundant in Trib. Andropogoneae.
SWEET11s: SWEET11a has a higher expression level in the basal zone of the leaf, and its ortholog (Sb07g026040) was specifically expressed in the panicle in sorghum [78]. In sugarcane, SWEET11a may coordinate the delivery of sucrose from the leaf with the needs of the development of panicle. SWEET11b displayed very low expression levels in the examined tissues in the two Saccharum species, and its ortholog was also specifically expressed in the panicle in sorghum [78]. OsSWEET11, the close ortholog of both SWEET11a and SWEET 11b, together with five phylogenetically close OsSWEETs were revealed to confer TAL effector-mediated susceptibility to Xanthomonas in rice [22]. Therefore, we hypothesized that the two SWEET11s were the candidates which may mediate the infection of the pathogen in Saccharum.
SWEET13s: SWEET13s were recently duplicated genes. Three paralogues SWEET13a, −13b, and -13c showed similar expression patterns in the examined tissues, where SWEET13c was highly expressed in all the examined tissues including leaves and stems. Consistently, SWEET13c (Sb08g013620) had the highest expression among the SWEET families in sorghum [78]. SWEET13c appeared to be the pivotal player among the SWEETs for sugar accumulation in Saccharum when expressed in mature leaves and stalks. SWEET13a had a diurnal peak expression in the morning in S. spontaneum, but in S. officinarum SWEET13a had its diurnal peak expression was at noon. This can be explained as SWEET13a is a sucrose starvation-induced gene since depletion of nocturnal reserves leads to the activation of sucrose in the low sugar content in S. spontaneum. In contrast to SWEET1a, the expression of SWEET13s dramatically increased from the maturing to mature zones, indicating that SWEET13s are mainly involved in photosynthesis for sugar transport. Therefore, we hypothesized that SWEET13s might play a role in removing the photo assimilated sugar from source leaves, thus minimizing sugar repression of photosynthesis. In maize, SWEET13s were suggested to also serve as potential key transporters in the evolution of C4 photosynthesis [79], adding further support that SWEET13s are key players for the sugar efflux of sugar transportation in photosynthetic tissues. Furthermore, SWEET13s were mainly expressed in sclerenchyma cells of mature stems in S. officinarum (Fig. 5b), and both SWEET13a and SWEET13b have higher expression levels in S. officinarum than in S. spontaneum. Consequently, we considered SWEET13c as a strong candidate for sucrose transport from source to sink, while SWEET13a and SWEET13b may contribute to the sugar content difference between S. officinarum and S. spontaneum.
The SWEET family members in clade III were revealed to transport sucrose and small amounts of fructose [7, 23, 56, 80]. In Saccharum, at least 6 sucrose transporters (SUTs) were identified, and SUT1 was dominantly expressed among the families [34, 81]. SUT1 has been shown to have high expression levels in premature internodes, and decreased expression levels in mature internodes in Saccharum hybrid and S.officinarum [34, 81]. SUT1’s expression increased with stem maturation in Saccharum and had higher gene expression in S. officinarum than in S. spontaneum. SUT1 was also demonstrated to be highly selective for sucrose and to function in loading sucrose from the vascular tissue into the stem parenchyma cells [81, 82]. It is possible that 13a, 13b, and 13c cooperate with SUT1 for sucrose transport. Subsequently, SUTs load sucrose into the phloem of leaf minor veins, and also function to retrieve sucrose from the apoplast during transport, sucrose is concentrated in the sieve element–companion cell complex [78].
SWEET16s: SWEET16a presented higher expression levels in the stem tissues than in other tissues of the two Saccharum species, and had two times the level of transcripts in parenchyma cells compared to sclerenchyma cells (Fig. 5b). In sorghum, the ortholog of SWEET16a (Sb01g035840) was mainly expressed in the panicle [78]. In Arabidopsis, the close orthologs AtSWEET16 and AtSWEET17 distributed in clade IV, localize to the tonoplast, and AtSWEET17 is a key determinant of leaf fructose content [21]. SWEET16b’s expression was not detected in S. officinarum, but displayed rhythmic diurnal expression patterns with higher expression levels in the early developmental compared to mature developmental stages in the leaf tissues of S. spontaneum. These results led to the speculation that SWEET16a may be involved in the sugar accumulation in the sink tissues of Saccharum, and SWEET16b may contribute to the sugar content divergence between the two Saccharum species.
In this study, 8 genes (SWEET3b, SWEET4c, SWEET4d, SWEET4e, SWEET6, SWEET11b, SWEET12 and SWEET14) had very low or undetectable levels of expression in all the examined tissues from the two Saccharum species. These results led us to deduce that these 8 genes have insignificant roles for sugar accumulation in Saccharum. However, four of the eight orthologs, SWEET4c, SWEET6, SWEET11b and SWEET14, were expressed in the panicle tissues in sorghum [78], indicating that these 4 genes take part in sugar transport for reproductive rather than vegetative growth. Two of the rice orthologs, SWEET3b and SWEET12 were induced by arbuscular mycorrhizal fungi (AMF) symbiosis in the root tissues [83], indicating that SWEET3b and SWEET12 could have potential functions in creating symbiotic relationships at the root interface.
Synthesized sucrose is transported from the leaf through the sieve elements and accumulates in the parenchyma cells of sugarcane stalks. Based on the expression patterns of these 22 SsSWEET genes, we produced a model (Fig. 7) illustrating the spatial and temporal expression of these genes in sugarcane plant tissues and cells. In the photosynthetic leaf tissue, specifically in the maturing zones of the leaf, SWEET1b, 2b, 13a, 13b, and 13c are the predominant players in efflux of photosynthesized sucrose to the leaf apoplast and eventually to the sink. Moreover, SWEET1b/13a/13b presented rhythmic diurnal expression patterns, indicating that the three genes are regulated by sunlight. In the maturing zone of the leaf, SWEET1a and 2a served the same role as SWEET1b in the mature zone for sugar transportation. In the transition zone of the leaf, where the photosynthesis is much less active than the maturing and mature zones, SWEET1a, 2a, and 2b are responsible for sugar transport. The basal zone acts as the immediate sink tissue and here SWEET1a, 2a, 4b, and 11a play major roles in the accommodation of the products of photosynthesis and the unloading of these products from the leaves to stems. SWEET1a, 4a, and 4b are constitutively expressed in the whole stalk, thus suggesting their involvement in sucrose transport from companion cells to the apoplast and to parenchyma cells for the complete process of sucrose accumulation. SWEET2a and SWEET13c were mainly expressed in the immature and maturing/mature stem, respectively, suggesting their tissue-specific roles in sucrose efflux from the source to the sink tissues. SWEET2a may be involved in sugar accumulation in parenchyma cells and sugar transport in sclerenchyma cells. SWEET4a, SWEET4b, SWEET13c may contribute to sugar transport in sclerenchyma cells mostly for cellulose synthesis.
Fig. 7.

Schematic models for roles of SWEET proteins in phloem loading and unloading based on gene expression profiles in sugarcane. Notes: In the leave tissues, SWEET13a/13b/13c were the dominant expressional genes in mature and maturing zones, SWEET1b was expressed predominantly in the mature zone, SWEET2b was expressed in the transitional zone and the maturing zone, SWEET1a/2a were expressed in the basal zone (sink tissues), transitional zone and maturing zone, and SWEET4b/11a were expressed in the basal zone (sink tissues). These observations suggested that SWEET1b/2b/13a/13b/13c are associated with sucrose efflux in the photosynthetic tissues, while, SWEET1a/4b/11a are associated with sucrose unloading from the leaf to the stem. Sucrose is synthesized by the Calvin cycle from carbon dioxide and water in mesophyll cells. SWEET13a/b/c was the most abundantly expressed gene in the maturing and mature zones of leaves, and was suggested to play a role in the efflux of photosynthesized sucrose to the leaf apoplast on the basis of the function of its homologs in Arabidopsis (AtSWEET11 and AtSWEET12) [95]. Moreover, SWEET1b/13a/13b presented a diurnal expression pattern, indicating that these three genes are regulated by sunlight. In the stem tissues, SWEET1a/4a/4b were constitutively expressed in the whole stalk, SWEET2a was mainly expressed in the immature stem, SWEET13c was expressed in the maturing and mature stem, suggesting that SWEET1a/4a/4b are involved in sucrose unloading and accumulation in sink tissues, whereas SWEET2a is associated with sucrose efflux from the source to the sink tissues, and SWEET13c is likely to be involved in sugar accumulation in the mature stem. Synthesized sucrose is transported from the leaf through sieve elements and accumulates in the parenchyma cells of sugarcane stalks. Therefore, SoSWEET2a may be involved in the accumulation of sugars in parenchyma cells and sugar transporting in sclerenchyma cells. SoSWEET4a, SoSWEET4b, SoSWEET13c may contribute to the sugar transport in sclerenchyma cells. SoSWEET16a had higher expression in parenchyma cells than in sclerenchyma cells, indicating that these genes may be involved in the accumulation of sugars in parenchyma. Reference: Chen LQ, Cheung LS, Feng L, Tanner W, Frommer WB. Transport of sugars. Annu Rev. Biochem. 2015; 84(84):865–94
Conclusions
In this study, we identified 22 SWEET genes from S. spontaneum. Phylogenetic analyses based on orthologs from 11 representative plant species revealed four clades which could subsequently be sorted by age in duplicated descending order: clade II, clade I, clade III and clade IV. The expansions of SWEET genes were mainly caused by recent gene duplications in dicot plants, while SWEETs were mainly retained from the ancient WGD in monocot plant species. In Saccharum, SWEET16a/16b were retained from ε WGD; three gene pairs, SWEET1a/1b, SWEET3a/3b and SWEET5/6 were assumed to be retained from ρ WGD; two subgroups, SWEET13a/13b/13c/14 and SWEET11a/11b/12/15, originated from ρ WGD, and subsequently SWEET13a/13b/13c were generated by tandem duplicates, while SWEET11b was recently duplicated from SWEET11a in Trib. Andropogoneae; and SWEET4d originated with the rise of Trib. Andropogoneae. Gene expression patterns and ortholog comparisons provided the clues to understand the potential function of the SWEET families in Saccharum. We established that SWEET1b was a sucrose starvation-induced gene involved in sugar transport in highly photosynthetic zones; SWEET13c was the key player in the efflux of sugar transportation in the mature photosynthesis tissues, SWEET4a and SWEET4b were mainly involved in sugar transport in the stalk. SWEET1a\2a\4a4b\13a\16b appeared to be genes contributing to the differences in sugar content between S. spontaneum and S. officinarum. Despite the large amounts of gene expression data for SWEETs, it remains unknown how SWEETs are coordinated with other sugar transporter genes for sugar metabolism, and how they support the accumulation of sugars in Saccharum. These results offer a useful basis for future research aiming to understand the physiological roles of SWEET gene and molecular mechanisms of sucrose metabolism in sugarcane. Experiments such as yeast-one-hybrid screens, characterization and dissection of the spatio-temporal expression, chromosome immune precipitation (ChIP) assays, yeast complementation and uptake assays and gene editing technology like CRISPR-Cas9 system, could be performed to elucidate the function of these genes.
Materials and methods
Plant materials
Two Saccharum species, LA-Purple (S. officinarum, 2n = 8x = 80, originated in USA) and SES-208 (S. spontaneum, 2n = 8x = 64, originated in USA) were used in this study [33].
For the different developmental stages experiment: Tissue samples were obtained from leaf roll, leaf, top immature internode (i.e. Stem3), premature internode (i.e. Stem 9 for LA-Purple and Stem 6 for SES-208) and mature internode (i.e. Stem 15 for LA-Purple and Stem 9 for SES-208) as previously described [34, 35].
For the leaf gradient experiment:Saccharum plants were grown with lamps at light intensity of 350 μmol/m2/sec, 14:10 l/D, 30 °C L/22 °C D and 60% relative humidity. Tissue was collected after planting 3 h into the L period. 11-day-old second leaves of S. spontaneum (SES-208) were cut into 15 1-cm segments, 15-day-old second leaves of S. officinarum (LA-purple) were cut into 15 1-cm segments. Samples were pooled from an average of four plants per biological replicate, and three biological replicates in total were prepared. The previously described approach by Li et al. was followed [50].
For the diurnal cycle experiment: Leaves from Saccharum were collected from a field at Fujian Agriculture and Forestry University (Fuzhou, Fujian, 119°16′48″E, 26°4′48″N) for RNA extraction. The mature leaves of S. spontaneum (SES-208) was collected from one plant as one replicate, and three biological replicates were collected every hour between 6 a.m. on March, 2 2017 and 4 a.m. on March 3, 2017, 12 time points (6 a.m., 8 a.m., 10 a.m., noon, 2 p.m., 4 p.m., 6 p.m., 8 p.m., 10 p.m., midnight, 2 a.m., 4 a.m.) were chosen for RNA-seq library construction. At the same time, a mature leaf was collected every hour between 6 a.m. on the 2nd March 2017 and 6 a.m. on the 3rd March 2017, seven time points (6 a.m., 10 a.m., 2 p.m., 6 p.m., 10 p.m., 2 a.m., 6 a.m.) were chosen for RNA-seq library construction. The collection of S. officinarum (LA-purple) leaves was performed in the same way. The sunset time on 2 March was 6 p.m. The previously described approach by Ming et al. was followed [43].
For the parenchyma and sclerenchyma cells experiment:We generated RNA from parenchyma cells and sclerenchyma cells isolated by hand sectioning from internode 13 of 11-month-old S. officinarum (LA-purple), which were grown in a field at Fujian Agriculture and Forestry University.
BAC sequencing
A total of 38,400 BAC clones were constructed from S. spontaneum AP85–441 (2n = 4x = 32), a haploid clone of S. spontaneum following the method described by Ming et al. [34, 35, 84].
Homolog searches
The completely sequenced genomes and predicted protein sequences of plants were downloaded from Phytozome version 10.0 [39] and the National Center for Biotechnology Information (NCBI) databases [85]. To identify proteins containing MtN3_slv domains in the proteome datasets, the MtN3_slv domain PF03083 model profile from the Pfam database [86] was used to perform local searches in the four proteome datasets using the HMMER program [87].
Phylogenetic analysis
The sequence annotation, functional prediction of SsSWEETs following the method described in previous studies [34, 35]. Based on the alignment of protein sequences, the phylogenetic tree of the SWEET gene family was constructed using neighbor-joining (NJ) and maximum likelihood (ML) methods. The construction of NJ tree was carried out using MEGA (version 5.0) [88] with the ‘pairwise deletion’ option and the ‘Poisson correction’ model [88]. Reliability of internal branches of the tree was valued by the bootstrapping of 1000 replicates. PhyML (version 3.0) was applied to construct a ML tree, with 100 nonparametric bootstrap replicates, γ-distribution, and WAG amino acid substitution model [89].
Calculation of Ka/Ks
Ka/Ks ratios were calculated in KaKs_Calculator v2.0 using the maximum-likelihood MA method [90]. Meanwhile, Fisher’s exact test for small samples was applied to justify the validity of Ka and Ks calculated by this method [91]. The divergence time (T) was calculated by T = Ks/ (2 × 6.1 × 10− 9) × 10− 6 Mya [92].
Analysis of the expression profiling of SWEETs in Saccharum based on RNA-seq
The cDNA libraries preparation was performed according to the manufacturer’s protocol (TruSeq® RNA, Illumina). The RNA-seq libraries were pooled and sequenced with 100 nt paired-end on an Illumina HiSeq2500 platform at the Center for Genomics and Biotechnology, Fujian Agriculture and Forestry University. Raw data were aligned to reference gene models (sorghum gene models) using TRINITY [93]. RNA-seq quantitative analysis was completed through Trinity Transcript Quantification and the RPKM value of the gene was calculated by RSEM method.
Experimental validation of SWEET gene expression levels by RT-qPCR
The expression levels of two SWEET genes (SsSWEET2 and SsSWEET4b) in five tissues (Stem 3, 9, 15, leaves and leaf roll in LA-Purple, and Stem 3, 6, 9, leaves and leaf roll in SES-208) from two 12-months old Saccharum species were validated by RT-qPCR (Additional file 7). The real time PCR reaction program and method to calculate the relative expression levels was performed as previously described [34, 35].
Experimental validation of SWEET16b gene by PCR
Extraction of sugarcane genomic DNA was performed by the cetyltrimethyl ammonium bromide (CTAB) method. Gene-specific primer pairs (Additional file 8) were designed using the Primer 5 software. PCRs were performed using PrimeSTAR® Max DNA Polymerase (TakaRa, R045A). PCR reaction program: 95 °C for 3 min; 95 °C for 30s, 57 °C for 30s, 72 °C for 2 min, 34 cycles; 72 °C 5 min; 4 °C save.
Additional files
The SWEET gene alleles in S. spontaneum. (XLSX 12 kb)
Percentage similarity between SWEET proteins in sugarcane was calculated using NCBI BLASTP software. (DOCX 23 kb)
A schematic diagram for the relationship of the four clades of the phylogenetic tree constructed by the ML method. (PDF 42 kb)
An unrooted tree using SWEET amino acid sequences from sugarcane, sorghum, maize and rice SWEET genes and the MtN3_slv domain architecture of those proteins. (PDF 2012 kb)
A RT-qPCR verification of SWEET2b and SWEET4b in partial tissues of two Saccharum species. Note: IN, internode; LR, leaf roll. Internodes 3, 9, 15 and internodes 3, 6, 9 were from S. officinarum LA-Purple and S. spontaneum SES-208, respectively. B Correlation coefficient between RNA-seq (X axis) and RT-qPCR (Y axis) of two SsSWEET genes (SsSWEET2b and SsSWEET4b). (PDF 47 kb)
PCR verification of SWEET4e and SWEET16b in two Saccharum species. (PDF 53 kb)
The primers for RT-qPCR verification of SWEET2b and SWEET4b in two Saccharum species. (DOCX 17 kb)
The primers for PCR verification of SWEET4e and SWEET16b in two Saccharum species. (DOCX 17 kb)
Acknowledgments
We thank Plant BioPress Editing for the language editing.
Funding
This work was supported by grants from the National High-tech R&D Program [863 Program, 2013AA102604], the National Natural Science Foundation of China [NSFC, 31201260], the Program for New Century Excellent Talents in Fujian Province [KLa17073A] and the Science and Technology Major Project of Fujian Province[2016NZ0001]. The funders had no role in study design, data collection and analysis, decision to publish, or preparation of the manuscript.
Availability of data and materials
The 22 sequences of SsSWEETs were deposited into Genbank (accession numbers: MG204840-MG204861).The S. spontaneum genome project [41] was deposited into Genbank with accession numbers: QVOL00000000.
Abbreviations
- AMF
Arbuscular mycorrhizal fungi
- BAC
Bacterial Artificial Chromosome
- BETL
Basal endosperm transfer layer
- CDS
Coding domain sequence
- CTAB
Cetyltrimethyl ammonium bromide
- CWINVs
Cell-wall invertases
- DW
Dry weight
- eEF-1a
Eukaryotic elongation factor 1a
- ESTs
Expressed sequence tags
- GAPDH
Glyceraldehyde-3-phosphate dehydrogenase
- Ka/Ks
Nonsynonymous to synonymous substitution ratio
- LCA
Last common ancestor
- MSTs
MonoSaccharide Transporters
- ORFs
Open reading frames
- PCR
Polymerase chain reaction
- RNA-seq
RNA Sequencing
- RPKM
Reads Per Kilobase per Million mapped reads
- RT-qPCR
Reverse transcription quantitative PCR
- 7-TM
seven predicted transmembrane
- SUTs
Sucrose Transporters/Sucrose Carriers
- SWEET
Sugars Will Eventually be Exported Transporters
- THB
Triple-helix bundles
- TM
Transmembrane domain
- VINVs
Vacuolar invertases
- WGD
Whole genome duplication
Authors’ contributions
WH, XH and JZ conceived the study and designed the experiments. WH, XH, QZ, JW, QS, XZ, KW, QY, YRL, RM and JZ carried out the experiments and analyzed the data. JZ, WH, and XH wrote the manuscript. All authors read and approved the final paper.
Ethics approval and consent to participate
Not applicable.
Consent for publication
Not applicable.
Competing interests
The authors declare that they have no competing interests.
Publisher’s Note
Springer Nature remains neutral with regard to jurisdictional claims in published maps and institutional affiliations.
Contributor Information
Weichang Hu, Email: 654919671@qq.com.
Xiuting Hua, Email: xiutinghua@126.com.
Qing Zhang, Email: zhangqing970@126.com.
Jianping Wang, Email: wangjp@ufl.edu.
Qiaochu Shen, Email: 422462669@qq.com.
Xingtan Zhang, Email: zhangxt@fafu.edu.cn.
Kai Wang, Email: kwang@fafu.edu.cn.
Qingyi Yu, Email: qyu@ag.tamu.edu.
Yann-Rong Lin, Email: ylin@ntu.edu.tw.
Ray Ming, Email: rming@life.uiuc.edu.
Jisen Zhang, Email: zjisen@126.com.
References
- 1.Wind J, Smeekens S, Hanson J. Sucrose: metabolite and signaling molecule. Phytochemistry. 2010;71(14–15):1610–1614. doi: 10.1016/j.phytochem.2010.07.007. [DOI] [PubMed] [Google Scholar]
- 2.Lohaus G, Burba M, Heldt HW. Comparison of the contents of sucrose and amino acids in the leaves, phloem sap and taproots of high and low sugar-producing hybrids of sugar beet (Beta vulgaris L.) J Exp Bot. 1994;45(277):1097–1101. doi: 10.1093/jxb/45.8.1097. [DOI] [Google Scholar]
- 3.Srivastava AC, Ganesan S, Ismail IO, Ayre BG. Functional characterization of the Arabidopsis AtSUC2 sucrose/H+ symporter by tissue-specific complementation reveals an essential role in phloem loading but not in long-distance transport. Plant Physiol. 2008;148(1):200–211. doi: 10.1104/pp.108.124776. [DOI] [PMC free article] [PubMed] [Google Scholar]
- 4.Riesmeier JW, Willmitzer L, Frommer WB. Isolation and characterization of a sucrose carrier cDNA from spinach by functional expression in yeast. EMBO J. 1992;11(13):4705–4713. doi: 10.1002/j.1460-2075.1992.tb05575.x. [DOI] [PMC free article] [PubMed] [Google Scholar]
- 5.Slewinski TL, Meeley R, Braun DM. Sucrose transporter1 functions in phloem loading in maize leaves. J Exp Bot. 2009;60(3):881. doi: 10.1093/jxb/ern335. [DOI] [PMC free article] [PubMed] [Google Scholar]
- 6.Lin IW, Sosso D, Chen LQ, Gase K, Kim SG, Kessler D, Klinkenberg PM, Gorder MK, Hou BH, Qu XQ. Nectar secretion requires sucrose phosphate synthases and the sugar transporter SWEET9. Nature. 2014;508(7497):546–549. doi: 10.1038/nature13082. [DOI] [PubMed] [Google Scholar]
- 7.Chen LQ, Hou BH, Lalonde S, Takanaga H, Hartung ML, Qu XQ, Guo WJ, Kim JG, Underwood W, Chaudhuri B. Sugar transporters for intercellular exchange and nutrition of pathogens. Nature. 2010;468(7323):527–532. doi: 10.1038/nature09606. [DOI] [PMC free article] [PubMed] [Google Scholar]
- 8.Chen LQ, Qu XQ, Hou BH, Sosso D, Osorio S, Fernie AR, Frommer WB. Sucrose efflux mediated by SWEET proteins as a key step for phloem transport. Science. 2012;335(6065):207. doi: 10.1126/science.1213351. [DOI] [PubMed] [Google Scholar]
- 9.Chang AB, Lin R, Studley WK, Tran CV, Saier JMH. Phylogeny as a guide to structure and function of membrane transport proteins (Review). Mol Membr Biol. 2004;21(3):171–81. [DOI] [PubMed]
- 10.Hackel A, Schauer N, Carrari F, Fernie AR, Grimm B, Kühn C. Sucrose transporter LeSUT1 and LeSUT2 inhibition affects tomato fruit development in different ways. Plant J. 2006;45(2):180–192. doi: 10.1111/j.1365-313X.2005.02572.x. [DOI] [PubMed] [Google Scholar]
- 11.Sivitz AB, Reinders A, Ward JM. Arabidopsis sucrose transporter AtSUC1 is important for pollen germination and sucrose-induced anthocyanin accumulation. Plant Physiol. 2008;147(1):92. doi: 10.1104/pp.108.118992. [DOI] [PMC free article] [PubMed] [Google Scholar]
- 12.Srivastava AC, Dasgupta K, Ajieren E, Costilla G, Mcgarry RC, Ayre BG. Arabidopsis plants harbouring a mutation in AtSUC2, encoding the predominant sucrose/proton symporter necessary for efficient phloem transport, are able to complete their life cycle and produce viable seed. Ann Bot. 2009;104(6):1121–1128. doi: 10.1093/aob/mcp215. [DOI] [PMC free article] [PubMed] [Google Scholar]
- 13.Payyavula Raja S., Tay Kate H.C., Tsai Chung-Jui, Harding Scott A. The sucrose transporter family in Populus: the importance of a tonoplast PtaSUT4 to biomass and carbon partitioning. The Plant Journal. 2011;65(5):757–770. doi: 10.1111/j.1365-313X.2010.04463.x. [DOI] [PubMed] [Google Scholar]
- 14.Chincinska I, Gier K, Krügel U, Liesche J, He H, Grimm B, Harren FJM, Cristescu SM, Kühn C. Photoperiodic regulation of the sucrose transporter StSUT4 affects the expression of circadian-regulated genes and ethylene production. Front Plant Sci. 2013;4(2):26. doi: 10.3389/fpls.2013.00026. [DOI] [PMC free article] [PubMed] [Google Scholar]
- 15.Turgeon R, Wolf S. Phloem transport: cellular pathways and molecular trafficking. Annu Rev Plant Biol. 2009;60(1):207–221. doi: 10.1146/annurev.arplant.043008.092045. [DOI] [PubMed] [Google Scholar]
- 16.Ayre BG. Membrane-transport systems for sucrose in relation to whole-plant carbon partitioning. Mol Plant. 2011;4(3):377–394. doi: 10.1093/mp/ssr014. [DOI] [PubMed] [Google Scholar]
- 17.Gamas P, Niebel FN, Cullimore JV. Use of a subtractive hybridization approach to identify new MEDICAGO TRUNCATULA genes induced during root nodule development. Mol Plant-Microbe Interact. 1996;9(4):233–242. doi: 10.1094/MPMI-9-0233. [DOI] [PubMed] [Google Scholar]
- 18.Artero RD, Terolalcayde J, Paricio N, Ring J, Bargues M, Torres A, Perezalonso M. Saliva, a new Drosophila gene expressed in the embryonic salivary glands with homologues in plants and vertebrates. Mech Dev. 1998;75(1–2):159–162. doi: 10.1016/S0925-4773(98)00087-2. [DOI] [PubMed] [Google Scholar]
- 19.Sosso D, Luo D, Li QB, Sasse J, Yang J, Gendrot G, Suzuki M, Koch KE, Mccarty DR, Chourey PS. Seed filling in domesticated maize and rice depends on SWEET-mediated hexose transport. Nat Genet. 2015;47(12):1489–1493. doi: 10.1038/ng.3422. [DOI] [PubMed] [Google Scholar]
- 20.Klemens PA, Patzke K, Deitmer J, Spinner L, Le HR, Bellini C, Bedu M, Chardon F, Krapp A, Neuhaus HE. Overexpression of the vacuolar sugar carrier AtSWEET16 modifies germination, growth, and stress tolerance in Arabidopsis. Plant Physiology. 2013;163(3):1338–1352. doi: 10.1104/pp.113.224972. [DOI] [PMC free article] [PubMed] [Google Scholar]
- 21.Guo WJ, Nagy R, Chen HY, Pfrunder S, Yu YC, Santelia D, Frommer WB, Martinoia E. SWEET17, a facilitative transporter, mediates fructose transport across the tonoplast of Arabidopsis roots and leaves. Plant Physiol. 2014;164(2):777–789. doi: 10.1104/pp.113.232751. [DOI] [PMC free article] [PubMed] [Google Scholar]
- 22.Streubel J, Pesce C, Hutin M, Koebnik R, Boch J, Szurek B. Five phylogenetically close rice SWEET genes confer TAL effector-mediated susceptibility to Xanthomonas oryzae pv. oryzae. New Phytologist. 2013;200(3):808. doi: 10.1111/nph.12411. [DOI] [PubMed] [Google Scholar]
- 23.Eom JS, Chen LQ, Sosso D, Julius BT, Lin IW, Qu XQ, Braun DM, Frommer WB. SWEETs, transporters for intracellular and intercellular sugar translocation. Curr Opin Plant Biol. 2015;25:53–62. doi: 10.1016/j.pbi.2015.04.005. [DOI] [PubMed] [Google Scholar]
- 24.Chen LQ. SWEET sugar transporters for phloem transport and pathogen nutrition. New Phytol. 2014;201(4):1150. doi: 10.1111/nph.12445. [DOI] [PubMed] [Google Scholar]
- 25.Zhang J, Zhou M, Walsh J, Zhu L, Chen Y, Ming R. Sugarcane genetics and genomics. In: Sugarcane: physiology, biochemistry, and functional biology. Edited by Moore PH, Botha FC. Wiley-Blackwell physiology, biochemistry, and functional biology. Edited by Moore PH, Botha FC. Wiley-Blackwell Publishing; 2014. p. 623–43.
- 26.Moore PH. Temporal and spatial regulation of sucrose accumulation in the sugarcane stem. Aust J Plant Physiol. 1995;22(4):661–680. doi: 10.1071/PP9950661. [DOI] [Google Scholar]
- 27.Jacobsen KR, Fisher DG, Maretzki A, Moore PH. Developmental changes in the anatomy of the sugarcane stem in relation to phloem unloading and sucrose storage. Plant Biol. 2015;105(1):70–80. [Google Scholar]
- 28.Lemoine R, La CS, Atanassova R, Dédaldéchamp F, Allario T, Pourtau N, Bonnemain JL, Laloi M, Coutos-Thévenot P, Maurousset L. Source-to-sink transport of sugar and regulation by environmental factors. Front Plant Sci. 2013;4(272):272. doi: 10.3389/fpls.2013.00272. [DOI] [PMC free article] [PubMed] [Google Scholar]
- 29.Braun DM, Slewinski TL. Genetic control of carbon partitioning in grasses: roles of sucrose transporters and tie-dyed loci in phloem loading. Plant Physiol. 2009;149(1):71. doi: 10.1104/pp.108.129049. [DOI] [PMC free article] [PubMed] [Google Scholar]
- 30.Lalonde S, Tegeder M, Throne-Holst MFrommer WB, Patrick JW. Phloem loading and unloading of sugars and amino acids. Plant Cell Environ. 2003;26(1):37–56. doi: 10.1046/j.1365-3040.2003.00847.x. [DOI] [Google Scholar]
- 31.Welbaum GE, Meinzer FC, Grayson RL, Thornham KT, Welbaum GE, Meinzer FC, Grayson RL, Thornham KT. Evidence for the consequences of a barrier to solute diffusion between the Apoplast and vascular bundles in sugarcane stalk tissue. Funct Plant Biol. 1992;19(6):611–623. [Google Scholar]
- 32.Zhu L, Zhang JS, Chen YQ, Pan HY, Ming R. Identification and genes expression analysis of ATP-dependent phosphofructokinase family members among three Saccharum species. Funct Plant Biol. 2013;40(4):369–378. doi: 10.1071/FP12182. [DOI] [PubMed] [Google Scholar]
- 33.Zhang J, Jie A, Chen Y, Ming R. Haplotype analysis of sucrose synthase gene family in three Saccharumspecies. BMC Genomics. 2013;14(1):314. doi: 10.1186/1471-2164-14-314. [DOI] [PMC free article] [PubMed] [Google Scholar]
- 34.Zhang Q, Hu W, Zhu F, Wang L, Yu Q, Ming R, Zhang J. Structure, phylogeny, allelic haplotypes and expression of sucrose transporter gene families in Saccharum. BMC Genomics. 2016;17:88. doi: 10.1186/s12864-016-2419-6. [DOI] [PMC free article] [PubMed] [Google Scholar]
- 35.Chen Y, Zhang Q, Hu W, Zhang X, Wang L, Hua X, Yu Q, Ming R, Zhang J. Evolution and expression of the fructokinase gene family in Saccharum. BMC Genomics. 2017;18(1):197. doi: 10.1186/s12864-017-3535-7. [DOI] [PMC free article] [PubMed] [Google Scholar]
- 36.Wang L, Zheng Y, Ding S, Zhang Q, Chen Y, Zhang J. Molecular cloning, structure, phylogeny and expression analysis of the invertase gene family in sugarcane. BMC Plant Biol. 2017;17(1):109. doi: 10.1186/s12870-017-1052-0. [DOI] [PMC free article] [PubMed] [Google Scholar]
- 37.Ouyang S, Zhu W, Hamilton J, Lin H, Campbell M, Childs K, Thibaudnissen F, Malek RL, Lee Y, Zheng L. The TIGR Rice genome annotation resource: improvements and new features. Nucleic Acids Res. 2007;35(Database issue):883–887. doi: 10.1093/nar/gkl976. [DOI] [PMC free article] [PubMed] [Google Scholar]
- 38.Lamesch P, Berardini TZ, Li D, Swarbreck D, Wilks C, Sasidharan R, Muller R, Dreher K, Alexander DL, Garciahernandez M. The Arabidopsis information resource (TAIR): improved gene annotation and new tools. Nucleic Acids Res. 2012;40(Database issue):1202–1210. doi: 10.1093/nar/gkr1090. [DOI] [PMC free article] [PubMed] [Google Scholar]
- 39.Phytozome version 10.0. 2015. [https://phytozome.jgi.doe.gov/pz/portal.html]. Accessed 24 Dec 2015.
- 40.Finn RD, Clements J, Eddy SR. HMMER web server: interactive sequence similarity searching. Nucleic Acids Res. 2011;39(Web Server issue):29–37. doi: 10.1093/nar/gkr367. [DOI] [PMC free article] [PubMed] [Google Scholar]
- 41.Zhang Jisen, Zhang Xingtan, Tang Haibao, Zhang Qing, Hua Xiuting, Ma Xiaokai, Zhu Fan, Jones Tyler, Zhu Xinguang, Bowers John, Wai Ching Man, Zheng Chunfang, Shi Yan, Chen Shuai, Xu Xiuming, Yue Jingjing, Nelson David R., Huang Lixian, Li Zhen, Xu Huimin, Zhou Dong, Wang Yongjun, Hu Weichang, Lin Jishan, Deng Youjin, Pandey Neha, Mancini Melina, Zerpa Dessireé, Nguyen Julie K., Wang Liming, Yu Liang, Xin Yinghui, Ge Liangfa, Arro Jie, Han Jennifer O., Chakrabarty Setu, Pushko Marija, Zhang Wenping, Ma Yanhong, Ma Panpan, Lv Mingju, Chen Faming, Zheng Guangyong, Xu Jingsheng, Yang Zhenhui, Deng Fang, Chen Xuequn, Liao Zhenyang, Zhang Xunxiao, Lin Zhicong, Lin Hai, Yan Hansong, Kuang Zheng, Zhong Weimin, Liang Pingping, Wang Guofeng, Yuan Yuan, Shi Jiaxian, Hou Jinxiang, Lin Jingxian, Jin Jingjing, Cao Peijian, Shen Qiaochu, Jiang Qing, Zhou Ping, Ma Yaying, Zhang Xiaodan, Xu Rongrong, Liu Juan, Zhou Yongmei, Jia Haifeng, Ma Qing, Qi Rui, Zhang Zhiliang, Fang Jingping, Fang Hongkun, Song Jinjin, Wang Mengjuan, Dong Guangrui, Wang Gang, Chen Zheng, Ma Teng, Liu Hong, Dhungana Singha R., Huss Sarah E., Yang Xiping, Sharma Anupma, Trujillo Jhon H., Martinez Maria C., Hudson Matthew, Riascos John J., Schuler Mary, Chen Li-Qing, Braun David M., Li Lei, Yu Qingyi, Wang Jianping, Wang Kai, Schatz Michael C., Heckerman David, Van Sluys Marie-Anne, Souza Glaucia Mendes, Moore Paul H., Sankoff David, VanBuren Robert, Paterson Andrew H., Nagai Chifumi, Ming Ray. Allele-defined genome of the autopolyploid sugarcane Saccharum spontaneum L. Nature Genetics. 2018;50(11):1565–1573. doi: 10.1038/s41588-018-0237-2. [DOI] [PubMed] [Google Scholar]
- 42.Yuan M, Wang S. Rice MtN3/saliva/SWEET family genes and their homologs in cellular organisms. Mol Plant. 2013;6(3):665–674. doi: 10.1093/mp/sst035. [DOI] [PubMed] [Google Scholar]
- 43.Ming R, Vanburen R, Wai CM, Tang H, Schatz MC, Bowers JE, Lyons E, Wang ML, Chen J, Biggers E. The pineapple genome and the evolution of CAM photosynthesis. Nat Genet. 2015;47(12):1435. doi: 10.1038/ng.3435. [DOI] [PMC free article] [PubMed] [Google Scholar]
- 44.Tao Y, Cheung LS, Li S, Eom JS, Chen LQ, Xu Y, Perry K, Frommer WB, Feng L. Structure of a eukaryotic SWEET transporter in a homotrimeric complex. Nature. 2015;527(7577):259. doi: 10.1038/nature15391. [DOI] [PMC free article] [PubMed] [Google Scholar]
- 45.Xuan YH, Hu YB, Chen LQ, Sosso D, Ducat DC, Hou BH, Frommer WB. Functional role of oligomerization for bacterial and plant SWEET sugar transporter family. Proc Natl Acad Sci U S A. 2013;110(39):E3685. doi: 10.1073/pnas.1311244110. [DOI] [PMC free article] [PubMed] [Google Scholar]
- 46.Guan Y, Huang X, Zhu J, Gao J, Zhang H, Yang Z. RUPTURED POLLEN GRAIN1, a member of the MtN3/saliva gene family, is crucial for Exine pattern formation and cell integrity of microspores in Arabidopsis. Plant Physiol. 2008;147(2):852–863. doi: 10.1104/pp.108.118026. [DOI] [PMC free article] [PubMed] [Google Scholar]
- 47.Yuan M, Zhao J, Huang R, Li X, Xiao J, Wang S. Rice MtN3/saliva/SWEET gene family: evolution, expression profiling, and sugar transport. J Integr Plant Biol. 2014;56(6):559–570. doi: 10.1111/jipb.12173. [DOI] [PubMed] [Google Scholar]
- 48.Wang L, Czedik-Eysenberg A, Mertz RA, Si Y, Tohge T, Nunes-Nesi A, Arrivault S, Dedow LK, Bryant DW, Zhou W. Comparative analyses of C4 and C3 photosynthesis in developing leaves of maize and rice. Nat Biotechnol. 2014;32(11):1158–1165. doi: 10.1038/nbt.3019. [DOI] [PubMed] [Google Scholar]
- 49.Xu Y, Tao Y, Cheung LS, Fan C, Chen LQ, Xu S, Perry K, Frommer WB, Feng L. Structures of bacterial homologues of SWEET transporters in two distinct conformations. Nature. 2014;515(7527):448. doi: 10.1038/nature13670. [DOI] [PMC free article] [PubMed] [Google Scholar]
- 50.Li P, Ponnala L, Gandotra N, Wang L, Si Y, Tausta SL, Kebrom TH, Provart N, Patel R, Myers CR. The developmental dynamics of the maize leaf transcriptome. Nat Genet. 2010;42(12):1060. doi: 10.1038/ng.703. [DOI] [PubMed] [Google Scholar]
- 51.Bläsing OE, Stitt M. Sugars and circadian regulation make major contributions to the global regulation of diurnal gene expression in Arabidopsis. Plant Cell. 2005;17(12):3257. doi: 10.1105/tpc.105.035261. [DOI] [PMC free article] [PubMed] [Google Scholar]
- 52.Welbaum GE. Compartmentation of solutes and water in developing sugarcane stalk tissue. Plant Physiol. 1990;93(3):1147. doi: 10.1104/pp.93.3.1147. [DOI] [PMC free article] [PubMed] [Google Scholar]
- 53.Jiao Y, Wickett NJ, Ayyampalayam S, Chanderbali AS, Landherr L, Ralph PE, Tomsho LP, Hu Y, Liang H, Soltis PS. Ancestral polyploidy in seed plants and angiosperms. Nature. 2011;473(7345):97. doi: 10.1038/nature09916. [DOI] [PubMed] [Google Scholar]
- 54.Edger PP, Pires JC. Gene and genome duplications: the impact of dosage-sensitivity on the fate of nuclear genes. Chromosome Res. 2009;17(5):699. doi: 10.1007/s10577-009-9055-9. [DOI] [PubMed] [Google Scholar]
- 55.Jiao Y, Li J, Tang H, Paterson AH. Integrated syntenic and phylogenomic analyses reveal an ancient genome duplication in monocots. Plant Cell. 2014;26(7):2792–2802. doi: 10.1105/tpc.114.127597. [DOI] [PMC free article] [PubMed] [Google Scholar]
- 56.Chong J, Piron MC, Meyer S, Merdinoglu D, Bertsch C, Mestre P. The SWEET family of sugar transporters in grapevine: VvSWEET4 is involved in the interaction with Botrytis cinerea. J Exp Bot. 2014;65(22):6589. doi: 10.1093/jxb/eru375. [DOI] [PubMed] [Google Scholar]
- 57.Li J, Qin M, Qiao X, Cheng Y, Li X, Zhang H, Wu J. A new Insight into the evolution and functional divergence of SWEET transporters in Chinese white pear (Pyrus bretschneideri) Plant Cell Physiol. 2017;58(4):839. doi: 10.1093/pcp/pcx025. [DOI] [PubMed] [Google Scholar]
- 58.Magallón S, Al E. A metacalibrated time-tree documents the early rise of flowering plant phylogenetic diversity. New Phytol. 2015;207(2):437. doi: 10.1111/nph.13264. [DOI] [PubMed] [Google Scholar]
- 59.Givnish TJ, Barfuss MH, Van EB, Riina R, Schulte K, Horres R, Gonsiska PA, Jabaily RS, Crayn DM, Smith JA. Adaptive radiation, correlated and contingent evolution, and net species diversification in Bromeliaceae. Mol Phylogenet Evol. 2014;71(2):55. doi: 10.1016/j.ympev.2013.10.010. [DOI] [PubMed] [Google Scholar]
- 60.Paterson AH, Bowers JE, Chapman B. Ancient polyploidization predating divergence of the cereals, and its consequences for comparative genomics. Proc Natl Acad Sci U S A. 2004;101(26):9903–9908. doi: 10.1073/pnas.0307901101. [DOI] [PMC free article] [PubMed] [Google Scholar]
- 61.Wang X, Shi X, Hao B, Ge S, Luo J. Duplication and DNA segmental loss in the rice genome: implications for diploidization. New Phytol. 2005;165(3):937–946. doi: 10.1111/j.1469-8137.2004.01293.x. [DOI] [PubMed] [Google Scholar]
- 62.Gaut BS, Dennequin MLT, Peek AS, Sawkins MC. Maize as a model for the evolution of plant nuclear genomes. Proc Natl Acad Sci U S A. 2000;97(13):7008–7015. doi: 10.1073/pnas.97.13.7008. [DOI] [PMC free article] [PubMed] [Google Scholar]
- 63.Ganko EW, Meyers BC, Vision TJ. Divergence in expression between duplicated genes in Arabidopsis. Mol Biol Evol. 2007;24(10):2298. doi: 10.1093/molbev/msm158. [DOI] [PubMed] [Google Scholar]
- 64.Wang Y, Wang X, Tang H, Tan X, Ficklin SP, Feltus FA, Paterson AH. Modes of gene duplication contribute differently to genetic novelty and redundancy, but show parallels across divergent angiosperms. PLoS One. 2011;6(12):e28150. doi: 10.1371/journal.pone.0028150. [DOI] [PMC free article] [PubMed] [Google Scholar]
- 65.Wang Y, Wang X, Lee TH, Mansoor S, Paterson AH. Gene body methylation shows distinct patterns associated with different gene origins and duplication modes and has a heterogeneous relationship with gene expression in Oryza sativa (rice) New Phytol. 2013;198(1):274–283. doi: 10.1111/nph.12137. [DOI] [PubMed] [Google Scholar]
- 66.Li Z, Zhang H, Ge S, Gu X, Gao G, Luo J. Expression pattern divergence of duplicated genes in rice. BMC Bioinformatics. 2009;10(S6):S8. doi: 10.1186/1471-2105-10-S6-S8. [DOI] [PMC free article] [PubMed] [Google Scholar]
- 67.Casneuf T, Bodt SD, Raes J, Maere S, Peer YVD. Nonrandom divergence of gene expression following gene and genome duplications in the flowering plant Arabidopsis thaliana. Genome Biol. 2006;7(2):R13. doi: 10.1186/gb-2006-7-2-r13. [DOI] [PMC free article] [PubMed] [Google Scholar]
- 68.Hakes L, Pinney JW, Lovell SC, Oliver SG, Robertson DL. All duplicates are not equal: the difference between small-scale and genome duplication. Genome Biol. 2007;8(10):R209. doi: 10.1186/gb-2007-8-10-r209. [DOI] [PMC free article] [PubMed] [Google Scholar]
- 69.Guan Y, Dunham MJ, Troyanskaya OG. Functional analysis of gene duplications in Saccharomyces cerevisiae. Genetics. 2007;175(2):933–943. doi: 10.1534/genetics.106.064329. [DOI] [PMC free article] [PubMed] [Google Scholar]
- 70.Patil G, Valliyodan B, Deshmukh R, Prince S, Nicander B, Zhao M, Sonah H, Song L, Lin L, Chaudhary J. Soybean ( Glycine max ) SWEET gene family: insights through comparative genomics, transcriptome profiling and whole genome re-sequence analysis. BMC Genomics. 2015;16(1):520. doi: 10.1186/s12864-015-1730-y. [DOI] [PMC free article] [PubMed] [Google Scholar]
- 71.Niehrs C, Pollet N. Synexpression groups in eukaryotes. Nature. 1999;402(6761):483–487. doi: 10.1038/990025. [DOI] [PubMed] [Google Scholar]
- 72.Xuan YH, Zhu YY, Yibing HU. Research advances of the SWEET proteins family. Sci China Earth Sci. 2014;44(7):676–684. [Google Scholar]
- 73.Smith AM, Stitt M. Coordination of carbon supply and plant growth. Plant Cell Environ. 2007;30(9):1126. doi: 10.1111/j.1365-3040.2007.01708.x. [DOI] [PubMed] [Google Scholar]
- 74.Mccormick AJ, Cramer MD, Watt DA. Regulation of photosynthesis by sugars in sugarcane leaves. J Plant Physiol. 2008;165(17):1817. doi: 10.1016/j.jplph.2008.01.008. [DOI] [PubMed] [Google Scholar]
- 75.Mccormick AJ, Watt DA, Cramer MD. Supply and demand: sink regulation of sugar accumulation in sugarcane. J Exp Bot. 2009;60(2):357. doi: 10.1093/jxb/ern310. [DOI] [PubMed] [Google Scholar]
- 76.Watt DA, Mccormick AJ, Govender C, Carson DL, Cramer MD, Huckett BI, Botha FC. Increasing the utility of genomics in unravelling sucrose accumulation. Field Crop Res. 2005;92(2–3):149–158. doi: 10.1016/j.fcr.2005.01.012. [DOI] [Google Scholar]
- 77.Mccormick AJ, Cramer MD, Watt DA. Sink strength regulates photosynthesis in sugarcane. New Phytol. 2006;171(4):759. doi: 10.1111/j.1469-8137.2006.01785.x. [DOI] [PubMed] [Google Scholar]
- 78.Mizuno H, Kasuga S, Kawahigashi H. The sorghum SWEET gene family: stem sucrose accumulation as revealed through transcriptome profiling. Biotechnol Biofuels. 2016;9:127. doi: 10.1186/s13068-016-0546-6. [DOI] [PMC free article] [PubMed] [Google Scholar]
- 79.Emms DM, Covshoff S, Hibberd JM, Kelly S. Independent and parallel evolution of new genes by gene duplication in two origins of C4 photosynthesis provides new insight into the mechanism of phloem loading in C4 species. Mol Biol Evol. 2016;33(7):1796–1806. doi: 10.1093/molbev/msw057. [DOI] [PMC free article] [PubMed] [Google Scholar]
- 80.Wei X, Liu F, Chen C, Ma F, Li M. The Malus domestica sugar transporter gene family: identifications based on genome and expression profiling related to the accumulation of fruit sugars. Front Plant Sci. 2014;5:569. doi: 10.3389/fpls.2014.00569. [DOI] [PMC free article] [PubMed] [Google Scholar]
- 81.Reinders A, Sivitz AB, Hsi A, Grof CPL, Perroux JM, Ward JM. Sugarcane ShSUT1: analysis of sucrose transport activity and inhibition by sucralose. Plant Cell Environ. 2006;29(10):1871–1880. doi: 10.1111/j.1365-3040.2006.01563.x. [DOI] [PubMed] [Google Scholar]
- 82.Casu RE, Grof CPL, Rae AL, Mcintyre CL, Dimmock CM, Manners JM. Identification of a novel sugar transporter homologue strongly expressed in maturing stem vascular tissues of sugarcane by expressed sequence tag and microarray analysis. Plant Mol Biol. 2003;52(2):371–386. doi: 10.1023/A:1023957214644. [DOI] [PubMed] [Google Scholar]
- 83.Sameeullah Muhammad, Demiral Tijen, Aslam Noreen, Baloch Faheem Shehzad, Gurel Ekrem. Plant, Soil and Microbes. Cham: Springer International Publishing; 2016. In Silico Functional Analyses of SWEETs Reveal Cues for Their Role in AMF Symbiosis; pp. 45–58. [Google Scholar]
- 84.Ming R, Moore PH, Zee F, Abbey CA, Ma H, Paterson AH. Construction and characterization of a papaya BAC library as a foundation for molecular dissection of a tree-fruit genome. Theor Appl Genet. 2001;102(6–7):892–899. doi: 10.1007/s001220000448. [DOI] [Google Scholar]
- 85.NCBI. 2015. [https://www.ncbi.nlm.nih.gov/]. Accessed 24 Dec 2015.
- 86.Pfam. 2016. [http://pfam.xfam.org/search]. Accessed 6 Oct 2016.
- 87.Finn RD, Bateman A, Clements J, Coggill P, Eberhardt RY, Eddy SR, Heger A, Hetherington K, Holm L, Mistry J. Pfam: the protein families database. Nucleic Acids Res. 2014;42(Database issue):D222. doi: 10.1093/nar/gkt1223. [DOI] [PMC free article] [PubMed] [Google Scholar]
- 88.Tamura K, Peterson D, Peterson N, Stecher G, Nei M, Kumar S. MEGA5: molecular evolutionary genetics analysis using maximum likelihood, evolutionary distance, and maximum parsimony methods. 2011. [DOI] [PMC free article] [PubMed] [Google Scholar]
- 89.Guindon S, Gascuel O. PhyML—A simple, fast, and accurate algorithm to estimate large phylogenies by maximum likelihood. Syst Biol. 2003;52(5):696. doi: 10.1080/10635150390235520. [DOI] [PubMed] [Google Scholar]
- 90.Posada D. Using MODELTEST and PAUP* to select a model of nucleotide substitution. Curr Protoc Bioinformatics. 2003;Chapter 6:Unit 6.5. doi: 10.1002/0471250953.bi0605s00. [DOI] [PubMed] [Google Scholar]
- 91.Wang DP, Wan HL, Song Z, Yu J. γ -MYN: a new algorithm for estimating Ka and Ks with consideration of variable substitution rates. Biol Direct. 2009;4(1):1–18. doi: 10.1186/1745-6150-4-20. [DOI] [PMC free article] [PubMed] [Google Scholar]
- 92.Lynch M, Conery JS. The evolutionary fate and consequences of duplicate genes. Science. 2000;290(5494):1151–1155. doi: 10.1126/science.290.5494.1151. [DOI] [PubMed] [Google Scholar]
- 93.TRINITY. 2017. [https://github.com/trinityrnaseq/trinityrnaseq/wiki]. Accessed 15 June 2017.
- 94.Gough Julian, Karplus Kevin, Hughey Richard, Chothia Cyrus. Assignment of homology to genome sequences using a library of hidden Markov models that represent all proteins of known structure. Journal of Molecular Biology. 2001;313(4):903–919. doi: 10.1006/jmbi.2001.5080. [DOI] [PubMed] [Google Scholar]
- 95.Chen Li-Qing, Cheung Lily S., Feng Liang, Tanner Widmar, Frommer Wolf B. Transport of Sugars. Annual Review of Biochemistry. 2015;84(1):865–894. doi: 10.1146/annurev-biochem-060614-033904. [DOI] [PubMed] [Google Scholar]
Associated Data
This section collects any data citations, data availability statements, or supplementary materials included in this article.
Supplementary Materials
The SWEET gene alleles in S. spontaneum. (XLSX 12 kb)
Percentage similarity between SWEET proteins in sugarcane was calculated using NCBI BLASTP software. (DOCX 23 kb)
A schematic diagram for the relationship of the four clades of the phylogenetic tree constructed by the ML method. (PDF 42 kb)
An unrooted tree using SWEET amino acid sequences from sugarcane, sorghum, maize and rice SWEET genes and the MtN3_slv domain architecture of those proteins. (PDF 2012 kb)
A RT-qPCR verification of SWEET2b and SWEET4b in partial tissues of two Saccharum species. Note: IN, internode; LR, leaf roll. Internodes 3, 9, 15 and internodes 3, 6, 9 were from S. officinarum LA-Purple and S. spontaneum SES-208, respectively. B Correlation coefficient between RNA-seq (X axis) and RT-qPCR (Y axis) of two SsSWEET genes (SsSWEET2b and SsSWEET4b). (PDF 47 kb)
PCR verification of SWEET4e and SWEET16b in two Saccharum species. (PDF 53 kb)
The primers for RT-qPCR verification of SWEET2b and SWEET4b in two Saccharum species. (DOCX 17 kb)
The primers for PCR verification of SWEET4e and SWEET16b in two Saccharum species. (DOCX 17 kb)
Data Availability Statement
The 22 sequences of SsSWEETs were deposited into Genbank (accession numbers: MG204840-MG204861).The S. spontaneum genome project [41] was deposited into Genbank with accession numbers: QVOL00000000.