Abstract
Characterizing highly dynamic, transient, and vertically lofted emissions from open area sources poses unique measurement challenges. This study developed and applied a multipollutant sensor and time-integrated sampler system for use on mobile applications such as vehicles, tethered balloons (aerostats) and unmanned aerial vehicles (UAVs) to determine emission factors. The system is particularly applicable to open area sources, such as forest fires, due to its light weight (3.5 kg), compact size (6.75 L), and internal power supply. The sensor system, termed “Kolibri”, consists of sensors measuring CO2 and CO, and samplers for particulate matter (PM) and volatile organic compounds (VOCs). The Kolibri is controlled by a microcontroller which can record and transfer data in real time through a radio module. Selection of the sensors was based on laboratory testing for accuracy, response delay and recovery, cross-sensitivity, and precision. The Kolibri was compared against rack-mounted continuous emissions monitoring system (CEMs) and another mobile sampling instrument (the “Flyer”) that has been used in over ten open area pollutant sampling events. Our results showed that the time series of CO, CO2, and PM2.5 concentrations measured by the Kolibri agreed well with those from the CEMs and the Flyer, with a laboratory- tested percentage error of 4.9%, 3%, and 5.8%, respectively. The VOC emission factors obtained using the Kolibri were consistent with existing literature values that relate concentration to combustion efficiency. The potential effect of rotor downwash on particle sampling was investigated in an indoor laboratory and the preliminary results suggested that its influence is minimal. Field application of the Kolibri sampling open detonation plumes indicated that the CO and CO2 sensors responded dynamically and their concentrations co-varied with emission transients. The Kolibri system can be applied to various challenging open area scenarios such as fires, lagoons, flares, and landfills.
Keywords: Sensor system, emission sampling, air quality, VOC, PM2.5
1. Introduction
Open burning, particularly forest and agricultural fires, is one of the largest sources of trace gases and aerosol particles in the atmosphere and plays an important role in the atmospheric chemistry and climate by affecting chemical composition, radiation budget, and biogeochemical cycles (Crutzen and Andreae 1990, Andreae and Merlet 2001, Bond et al. 2004). To better understand its impact on human health and the climate system, various models (Reid et al. 2009, Nassar et al. 2009, Wiedinmyer et al. 2006, Akagi et al. 2011) have characterized this process quantitatively based on emission factors, which are the amount of pollutant quantity per unit amount of the raw material burned (e.g., biomass) (Reid et al. 2005). Emission factors can be derived from laboratory as well as field measurements. Compared with field measurements, laboratory experiments allow more extensive instrumentation to be located within close proximity to the burning materials and are exposed to higher plume concentration, which can translate to better detectability for some chemical compounds (Burling et al. 2011). However, field measurements of the emissions from biomass burning are considered more representative of the actual fire process, fuel types, and environmental conditions (Aurell and Gullett 2013, Christian et al. 2003, Akagi et al. 2011). In general, field measurements can be difficult to perform because of high operational costs and safety concerns. The two main field sampling methods for open-burn fires are ground- and aerial- based sampling (Hegg et al. 1987, Burling et al. 2011). Ground-based sampling methods often face sensor placement problems due to changes in wind direction and the need to maximize detectability (by moving closer to the burning sources) without compromising the safety of both the sensors and the operating personnel. In contrast, aerial sampling methods overcome this problem with high maneuverability. However, piloted airplanes and helicopters can be problematic for quick response actions and near-source plume air sampling. Operating costs, flight planning requirements, safety concerns when flying at low altitude under poor visibility, and strong near- ground turbulence further limit their applicability. The use of remotely controlled unmanned aerial vehicles (UAVs) such as multi-copters could be a cost-effective and reliable candidate for air sampling (McGonigle et al. 2008, Pieri et al. 2013, Khan et al. 2012). However, the limited payload capacity on these systems prevents the use of heavy onboard batteries, sensors, and data loggers, restricting flight time and versatility. Additionally, there are questions about the potential effect of the multi-copter rotor “downwash” on the integrity of gas and particle sampling (Avissar et al. 2009, Siebert et al. 2006).
To overcome this payload challenge, a small, lightweight, and power-efficient air monitoring sensor system (the “Kolibri”) was designed for mobile applications. The Kolibri consists of low- cost air quality sensors, particulate matter (PM) and volatile organics samplers, a black carbon analyzer, a microcontroller, a global positioning system (GPS) unit, and a radio module. Real-time data can be recorded in the onboard secure digital memory card and transferred wirelessly to the ground personnel, the latter aiding in the positioning of the remote-controlled UAV into the source plume. The technical feasibility of the sensors depends on multiple criteria including accuracy, precision, response and recovery time, zero-drift, resolution, and sensitivity. The onboard sensors include a nondispersive infrared (NDIR) carbon dioxide (CO2) gas analyzer (DX6220), an electrochemical carbon monoxide (CO) sensor (EC4–500), and miniature filter and sorbent samplers for particulate matter with an aerodynamic diameter of 2.5 μm or less (PM2.5), and volatile organic compounds (VOCs), respectively. All instruments were first evaluated against continuous emissions monitoring system (CEMs) and the Flyer system (Aurell et al. 2011) in an 70 m3 Open Burn Test Facility (OBTF) located at EPA’s Research Triangle Park, North Carolina (USA) campus. The OBTF, described in detail elsewhere (Grandesso et al. 2011), has been used to quantify emissions from biomass combustion, including sugarcane (Gullett et al. 2006) and forest matter (Aurell and Gullett 2013). Measurement accuracy, noise, response and recovery time, and zero-drift were quantified on select sensors to ensure the system’s applicability to the transient nature of most open area emission events.
2. Methods
A sensor system was designed to measure CO, CO2, PM2.5, and VOCs using the criteria of technical feasibility, low weight, and limited power consumption. This system would enable the determination of emission factors, or the amount of pollutant per amount of material burned, by measuring the cumulative pollutant mass (e.g., PM2.5 and VOCs) divided by the time-integrated sum of sampled carbon as CO and CO2. Then with knowledge of the material’s carbon content, the total pollutant mass per material mass can be calculated. The sensor response time and recovery time are particularly challenging for sensors in applications such as forest fires where the concentrations fluctuate rapidly and response delays are unacceptable. The limitation on sensor/sampler weight is particularly critical for UAV applications to maximize flight time. In addition, sensor selectivity is particularly important as many sensors are affected by other pollutants as well as relative humidity and temperature. The technical feasibility of selected sensors/samplers is evaluated against benchmark CEMs and calibration gases in this paper.
The CO2 concentration on the Kolibri is measured by a NDIR gas analyzer (DX6220) manufactured by RMT Ltd., (Moscow, Russia). The selection of this sensor is a combination of sensor performance, portability, and cost. We tested several small and light-weight CO2 sensors against a benchmark Licor 820 (LI-COR, Inc., Lincoln, NE, USA) NDIR analyzer, and the DX6220 sensor is selected with best performance and cost for our application. The NDIR gas analyzer has a stated accuracy and noise of less than 20 ppm and 10 ppm, respectively, when the CO2 concentration is less than 1,000 ppm. According to the manual, the DX6220 sensor can operate at humidity level up to 95%, which is suitable for sampling typical combustion events. Its maximum sampling frequency is 10 Hz, and was set to be 1Hz to be compatible with other sensors in the Kolibri. This sensor is based on the double channel optical design, where two infrared light beams are emitted on one side of the sampling cell and detected on the other side. The spectrum of these two beams is calibrated so that only one of the beams can be absorbed by CO2, and the other beam is used as a reference. The intensity of the light beam before and after absorption is measured from the emitter and the detector, respectively. These data can be used to estimate CO2 concentration through the Beer-Lambert law given the path length of the light beam and the gas absorption coefficient for a chosen spectrum (McDonagh et al. 2008). The measurement of the reference light beam is used to eliminate background environmental influences (optics imperfections, transparency of gas, etc.). In addition, temperature and pressure effects are compensated based on the ideal gas law using built-in temperature and pressure sensors.
The CO concentration is measured by an electrochemical sensor (EC4–500-CO) manufactured by SGX Sensortech (High Wycombe, Buckinghamshire, UK). Electrochemical sensors either oxidize or reduce the contacting gas at an electrode, which produces an electrical current and its magnitude is linearly proportional to the gas concentration (Bakker 2004). They have low cross-sensitivity with interfering gases, high sensitivity, low power consumption (hundreds of μW), and are relatively inexpensive (50 to 100 USD) (Piedrahita et al. 2014). An additional amplifying circuit was incorporated to make the output from the electrochemical sensor compatible with the Kolibri data logging system.
PM2.5 was sampled using a small and lightweight filter sampler (a personal environmental monitor from SKC, Eighty Four, PA, USA) including an inertial impactor operating at a constant flow rate of 10 L/min. The sampler contained a 37 mm diameter polytetrafluoroethylene (PTFE) filter with a pore size of 2.0 μm. A micro air pump (Sensidyne, LP, St. Petersburg, FL, USA) is automatically managed by a control board (detailed in Section 3.3) to maintain the constant flow rate. The controlled board is designed to turn on the pump when two criteria are met: the Kolibri is positioned within the emission-caused plume and the control board is capable of maintaining the 10 L/min flow rate. The first criterion is implemented to avoid mixing ambient- and emission- caused PM2.5 samples, which will lead to a bias in emission factor estimation of the true combustion source. In aerial or mobile applications, it’s not easy to keep the Kolibri always in the plume since the wind may shift. Consequently, we used the CO2 concentration as an indicator of combustion pollutants motivated by the previous studies of an aerial sampling system (Aurell et al. 2011, Aurell et al. 2015). The in-plume (out-of-plume) positioning of the Kolibri was determined when the CO2 concentration was higher (lower) than a user-specified value, which was determined locally during the warming up phase of the Kolibri system when the CO2 sensor was mainly measuring background CO2 concentrations. To avoid the possibility of frequent on/off cycles when the real-time CO2 concentration is close to the trigger value, a moving average of CO2 concentration can be used as the trigger setting. The second criterion is to ensure the impactor- specific flow rate, which will be affected by the accumulation of particles on the filter surface during sampling. In practice, a 10±0.5 L/min flow rate measured by the control board was considered to acceptable. If either of these two criteria were not met, the pump would be turned off. A new PM2.5 filter was loaded after each sampling of an event (e.g. detonation of a particular explosive fuel), or multiple events with the same fuels when the samples obtained per event were not enough. In all cases, however, the sampling of CO/CO2 and the on/off of the PM2.5 sampler were time-stamped and could be easily related to the specific detonation event(s) by time matching. This provided event-specific PM2.5 and CO/CO2 information which, with knowledge of the carbon content of the fuel, allows determination of the emission factor in terms of PM2.5/fuel mass.
VOCs were sampled using a Tenax sorbent tube (Tenax TA 35/60 from Supelco, Inc., Bellefonte, PA, USA), which is designed specifically for trapping certain VOCs and semi-VOCs. A control board (similar to the PM2.5 system) automatically manages a micro air pump (Sensidyne, LP, St. Petersburg, FL, USA) to maintain a prescribed flow rate (100 mL/min) through the Tenax tube. The operation of the VOC control board is similar to the PM2.5 system except for a different flow rate. The Tenax tube is analyzed for certain VOCs by thermal desorption with gas chromatography and mass spectrometry after sampling.
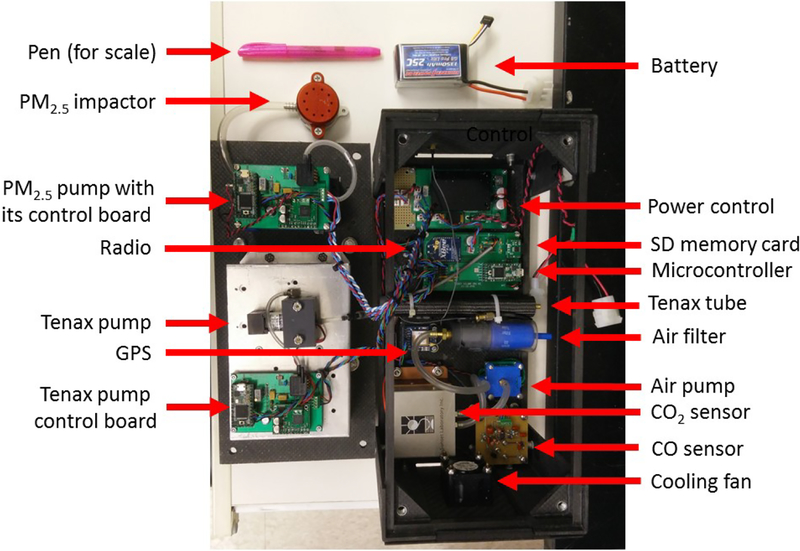
The Kolibri also includes a microcontroller (Teensy 3.1, PJRC, LLC., Sherwood, OR, USA) and a radio module (Xbee S1B, Digi International, Inc., Minnetonka, MN, USA). The control board performs three main missions: power regulation, data logging, and data transmission. A power control circuit is designed to provide a regulated voltage for all the electrical components in the sensor package. The control board is used to record sensor data into an onboard secure digital memory card and communicate between the onboard sensors and the radio module. A two-way communication is established between the Kolibri and a ground station through two Xbee radio modules sharing the same wireless network. The Kolibri can transmit sensor data continuously to the ground station to help the ground personnel determine the proximity of the Kolibri within the targeted plume, which is characterized by above-ambient CO and CO2 concentrations for combustion sources. Meanwhile, user commands that turn on/off the pumps for PM2.5 and VOC sampling can be sent from the ground station to the Kolibri. The total weight of the Kolibri system is 3.5 kg, including battery, carbon fiber frames, and screws. The dimensions of the Kolibri system are 15 cm×15 cm×30 cm (Fig. 1).
Figure 1.
View of the disassembled Kolibri system
3. Sensor Performance Evaluation
3.1. CO sensor performance
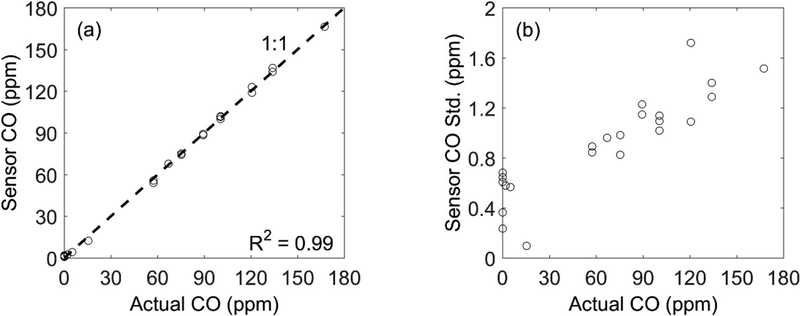
The accuracy and precision of the CO sensor was evaluated based on several laboratory tests using a gas mixer (Environics, Inc., Tolland, CT, USA), which diluted CO gas with air with a rated error of ±1.0%. After a three-point calibration, the sensor showed a very high correlation (R2 = 0.99) within the range of 0–180 ppm. The average percentage error of the CO sensor, which is calculated as the difference between the CO concentrations measured by the sensor and configured by the gas mixer and then divided by the mixer-specified CO concentration, is 4.9% excluding the zero concentrations. The averaged absolute error, which is the difference between the CO concentrations measured by the sensor and configured by the gas mixer, is 0.52 ppm at zero concentration. In addition, the standard deviation (SD) of the stabilized sensor readings is less than 1% of the CO concentration from the mixer (Fig. 2b), indicating high sensor precision relative to the typical emission concentrations from, for example, forest fire measurements (peak concentration up to hundreds of ppm) (Ward et al. 1996). We tested the sensor with an input CO calibration gas concentration as low as 2 ppm, and the calibrated sensor output was 2.54 ppm (SD = 0.58 ppm), indicating the performance of the sensor under low CO combustion conditions.
Figure 2.
Laboratory testing of CO sensor: (a) measured concentration, and (b) the standard deviation (SD) against actual CO concentration from a gas mixer.
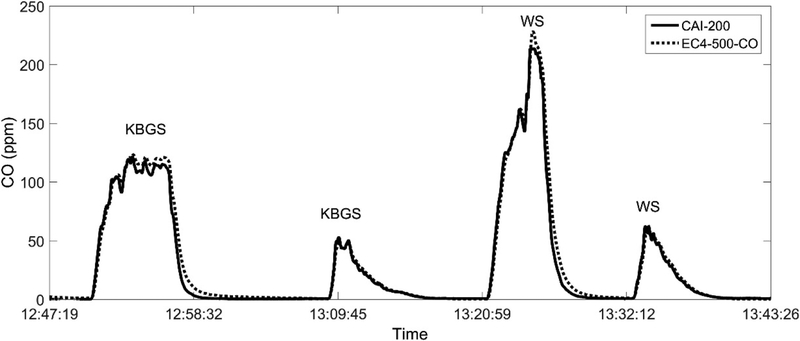
This CO sensor was also tested in the OBTF for potential interferences from other combustion gases during typical forest fire burning and compared against a CO CEM (CAI Model 200, California Analytical Instruments Inc., Orange, CA, USA). In this test, the exhaust from the CO sensor was connected to the inlet of the CEM with a flow rate of 0.6 L/min. The CO concentrations measured during four biomass burn tests using the EC4–500-CO sensor and the CAI-200 instruments are plotted in Figure 3. All instruments were calibrated based on a three-point calibration method using compressed gases (with CO concentration of 0, 25, and 100 ppm) before the actual test. Kentucky Blue Grass stubble (KBGS) was used in the first two burns and wheat stubble (WS) was used in the final two burns. The linear regression (with zero intercept) of the CO concentrations reported by the CAI-200 and the EC4–500-CO sensors revealed a slope of 1.04 with R2 = 0.98, indicating a very good agreement between these two sensors given their measurement errors (1% for CAI-200 analyzer and 4.9% for EC4–500-CO sensor, see Table 1). However, the EC4–500-CO sensor slightly overestimated the peak concentrations in the first and the third burn (around 120 and 200 ppm, respectively), which might be caused by the fact that the sensor was only calibrated up to 100 ppm.
Figure 3.
Time series of CO concentrations from Kentucky Blue Grass stubble (KBGS) biomass burn followed by a wheat stubble (WS) biomass burn measured at a laboratory burn facility using a CEM instrument (CAI-200) and the EC4–500-CO sensor.
Table 1.
Sensor package components
| Item | Model name | Manufacturer | Range | Accuracy | Power Consumption | Weight (grams) | Dimensions (mm) |
|---|---|---|---|---|---|---|---|
| CO2 | DX6220 OEM Model | RMT Ltd, Moscow, Russia | 0 – 20% | 20 (ppm) / 1%b | 700 mA (max) @ 8–15V | 180 | 42×73×92 |
| CO | EC4–500-CO | SGX Sensortech Ltd., High Wycombe, Buckinghamshire, UK | 0–500(ppm) | 0.5 (ppm) / 4.9%a | 3 mA @ 5Vc | 5 | 20×73×21 |
| PM2.5 Pump | Micro air pump (C120CNSN) | Sensidyne LP, St. Petersburg, FL, USA | 0–11 (L/min) | N/A | 550 mA (max) @ 12 V | 290 | 88×54×52 |
| Tenax Pump | Micro air pump (3A120CNSN) | Sensidyne LP, St. Petersburg, FL, USA | 0–625 (cc/min) | N/A | 26 mA (max) @ 12V | 30 | 28×15×41 |
| PM2.5 | Personal environmental monitor (761–203B) | SKC, Inc., Eighty Four, PA, USA | N/A | N/A | N/A | 53 | 64×64×22 |
| VOC | Tenax TA 35/60 (29530-U) | Supelco, Inc., Bellefonte, PA, USA | N/A | N/A | N/A | 1 | 6×6×89 |
| Temperature | K-type thermocouple with amplifier | Adafruit, New Y ork, NY, USA | −25–400 (°C) | ±2 (°C)b | <0.2 mA @ 5V | 1.1 | 20×16×2 |
| Pressure | HSC pressure sensor (HSCDRRN001ND2A5) | Honeywell International Inc., Morris Plains, NJ, USA | −1”−1” (H2O) | ±0.25%b | 3.5 mA @ 5V | 2 | 10×13×11 |
| Power | G8 Pro Lite+ 25C | Advance energy Inc., Las Vegas, NV, USA | N/A | N/A | 1350 mAh @14.8V | 126 | 26×34×102 |
| Positioning | Ultimate GPS module | Adafruit, New Y ork, NY, USA | Global | < 3 (m)b | 20 mA @ 2.2–5V | 8.5 | 26×35×7 |
| Communication | Xbee S1B | Digi International, Inc., Minnetonka, MN, USA | 0–1,600 (m)d | N/A | 250 mA @ 3.3V | 4 | 24×33×4 |
| Microcontroller | Teensy 3.1 | PJRC LLC, Sherwood, OR, USA | N/A | N/A | 12–50 mA @ 5V | 4 | 36×18×5 |
Laboratory tested
Manufacturer reported
Including the amplifying circuit.
Outdoor line-of-sight distance
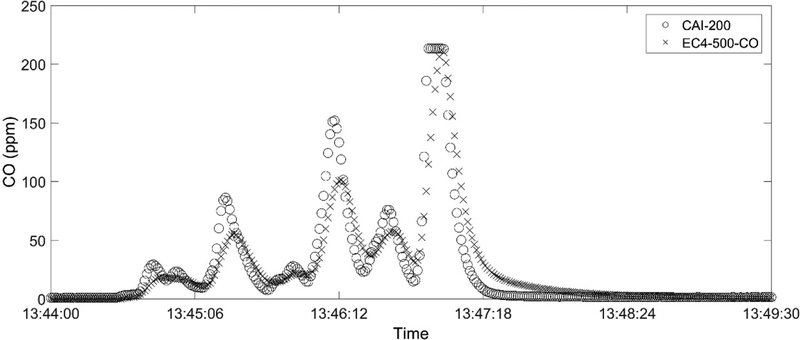
Finally, we evaluated the sensor response time, which is typically quantified as the average time the sensor took to reach 90% level of the applied concentration (t90). The t90 of the CO sensor was tested using several pulses of calibration gas, and the averaged t90 was determined as 18 seconds, similar to a previous study (Ward et al. 1996). We further tested the CO sensor against the CAI- 200 analyzer that has a rated t90 time of less than 1 second. The gas inlet was manually moved close to and away from the burning source to generate rapid fluctuations of concentrations, typical of field samplings of open burning scenarios such as a forest fire (Aurell and Gullett 2013). We plotted the results in Fig. 4, which shows that the CO sensor has a slower response than the CAI- 200 analyzer but follows the trend well. The difference between the time-integrated CO concentrations reported by these two sensors is only 4.9% of the time-integrated CO reported by the CAI-200 analyzer, relatively small compared to commonly observed emission variations. This indicates the CO sensor may fail to fully capture concentration fluctuations, but it can still be used to quantify total CO emission of open area combustion events as needed for emission factor determinations.
Figure 4.
Time series of CO concentrations from biomass (wheat stubble) burning measured at a laboratory burn facility using CAI-200 and the EC4–500-CO sensor.
3.2. CO2 sensor performance
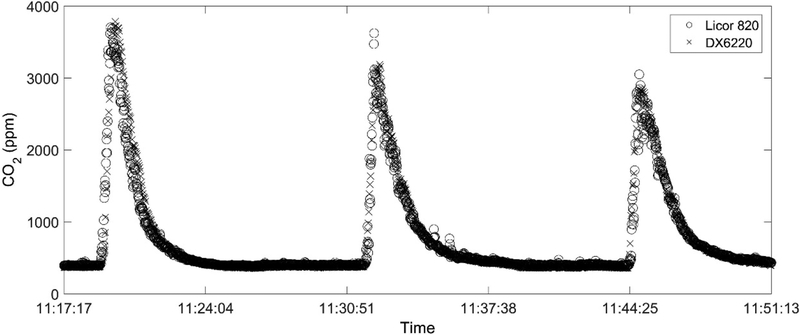
The performance of the DX6220 CO2 sensor in the Kolibri unit was compared during simultaneous measurements with the LICOR 820 (LI-COR, Inc., Lincoln, NE, USA) NDIR analyzer at the burn facility. Both sensors are based on NDIR, but the DX6220 is much smaller (10% size of Licor 820) and lighter (18% weight of Licor 820). The test results are plotted in Fig. 5 for three consecutive biomass burns. Overall, the linear regression (with zero intercept) of the CO2 concentrations reported by the DX6220 and the LICOR 820 sensors shows a slope of 1.03 with R2 = 0.91, indicating the level of agreement between the sensors. The LICOR 820 data show more variation than the DX6220, which might be caused by the higher output resolution of the LICOR 820 analyzer. We then evaluated the sensor response time (t90) by supplying several pulses of calibration gas, and it showed that t90 of the DX6220 sensor is around 6 seconds, equivalent to that of the Licor 820 analyzer (5 seconds) when evaluated using the same method.
Figure 5.
DX6220 sensor comparison against the LICOR 820 CEM during laboratory burn facility tests
3.3. Pump system performance
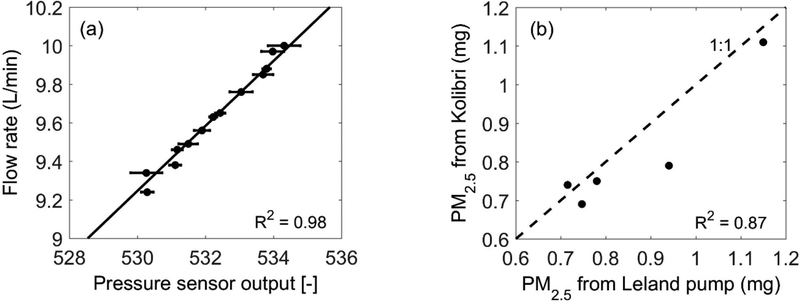
To maintain a constant flow rate for the PM2.5 sampler, we designed a control board (based on the Teensy 3.1 microcontroller) that can automatically adjust the real-time flow rate when affected by the accumulation of particles on the filter surface. The flow rate is obtained from a differential pressure sensor (HSCDRRN001ND2A5 from Honeywell International, Inc., Morris Plains, NJ, USA) at the pump outlet. Though equipped with pumps of different power ratings, this control board was designed to be used for both the PM2.5 sampler and a Tenax tube with different required flow rates. To test this system, we first examined the linearity between the flow rate measured by a Gilibrator Air Flow Calibration System (Sensidyne, LP, St. Petersburg, FL, USA), and the pressure sensor readings (Fig. 6a). A pressure-flow relationship was derived from this correlation (R2 = 0.98). The Kolibri pump system was tested against a Leland Legacy pump (SKC, Inc., Eighty Four, PA, USA) at the burn facility. Overall, the PM2.5 sampled using the Kolibri pump system correlated to that using the Leland pump with R2 = 0.87 (Fig. 6b). The average percentage error of the PM2.5 concentration obtained from the Kolibri pump system and the Leland Legacy pump is 5.8%, a value comparable to the measurement error (5%) for the Leland Legacy pump. We note that there is one case where the sampled PM2.5 concentration varied significantly (16.3%) between two pump systems, which might be caused by experimental (e.g., delayed trigger of Kolibri pump) or statistical limitations (given the low number of tests). Further tests of the Kolibri pump system would further characterize its error.
Figure 6.
Kolibri pump system evaluation: (a) the flow rate and the pressure sensor reading relationship, where the horizontal error-bar denotes one standard deviation of the stabilized pressure sensor readings, and (b) PM2.5 simultaneously sampled using the Kolibri pump and the Leland Legacy pump during several burning tests in the open burning test facility.
3.4. Tenax tube performance
3.4.1. Breakthrough test
When air passes through a sorbent tube (e.g., Tenax tube), the absorbed analytes tend to move slowly in the sorbent bed and will eventually elute after a certain volume of air has been pushed through (Peters and Bakkeren 1994). This breakthrough volume varies with the type of analyte, environmental conditions such as temperature, flow rate, vapor concentration and humidity, and absorbent resin factors such as weight and geometry (Harper 1993). We determined the amount of select VOC breakthrough from the Tenax tube after 3 L of flow volume, a value which was determined based on the designed sampling period (30 minutes) of this Kolibri system and a recommended flow rate of 100 mL/min for this type of Tenax tube.
We conducted a breakthrough experiment by flowing a known volume of TO-14 gas (Riggin et al. 1988), which was used as the source of VOCs, into a Tenax tube and then flowing through different volumes of air to determine breakthrough. Then, a pair of Tenax tubes were connected in series and 125 mL TO-14 gas was fed into the tubes. This test was repeated for three times, each time with a clean second Tenax tube. Hence, a total of 3 L of air as fed through the loaded tube, and 1 L of air for each of the three clean tubes. The whole experiment was conducted in room temperature. All Tenax tubes were then analyzed using GC-MS to determine the concentration of the absorbed analytes. More detailed experimental set-up and results are included in the supporting information.
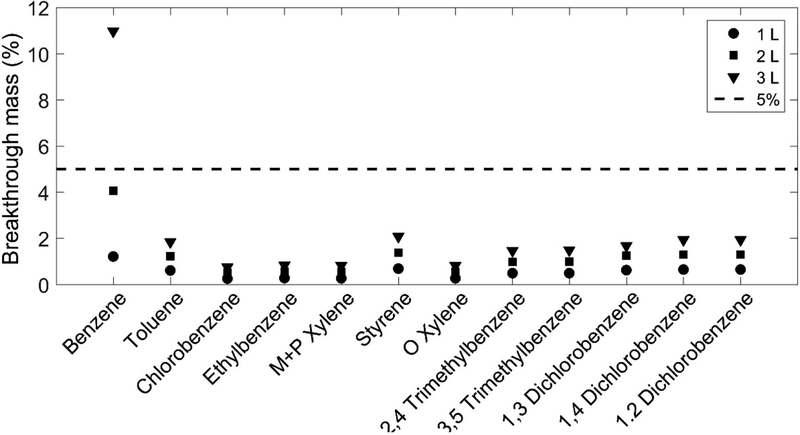
We calculated the breakthrough percentage as the ratio between the mass of compounds that broke through the first tube and was captured by the 2nd tube in series (sum of the mass in the 2nd tubes if more than one were used), and the mass that remains in the loaded tube. Considering the small amount of VOCs mass captured in the 2nd tube, it’s reasonable to assume no breakthrough from the 2nd tube. We reported the breakthrough percentage for some VOCs with different volumes of air pushing through in Fig. 7. It shows that only benzene has a >5% breakthrough and other VOCs have <2% breakthrough. More specifically, ~1% of benzene broke through in the first liter, ~4% after two liters and ~11% after three liters. As a result, it appears that the Tenax tubes could sample up to ~2 L before significant breakthrough would start at room temperature. On the other hand, the Tenax tube can be used to sample at least 3 L if Benzene is not among targeted VOC species.
Figure 7.
Breakthrough percentage for different VOCs with increasing amount of air flowing through the Tenax tube.
3.4.2. Sampling in OBTF
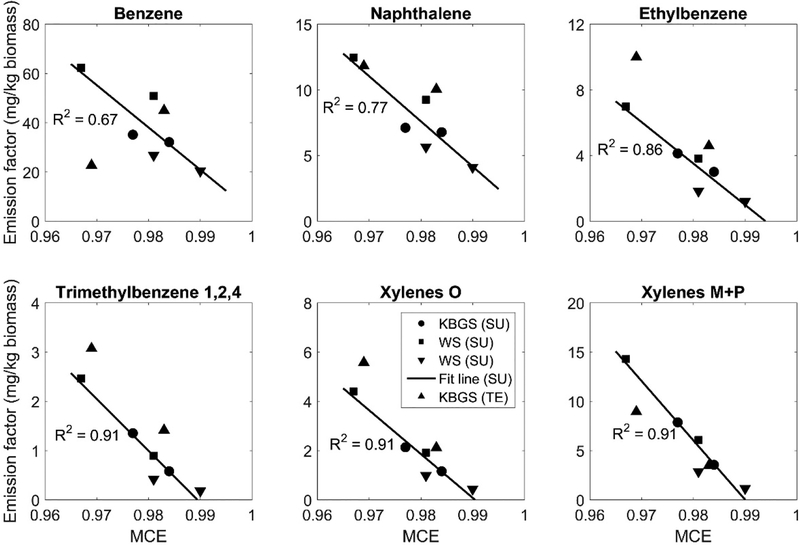
Emission factors (mass of pollutant per mass of biomass burned) of VOCs were obtained using Tenax tubes for two agricultural burns fueled with KBGS at the OBTF. We applied a carbon mass balance approach (Laursen et al. 1992), which assumes that the majority of combusted carbon is emitted and well-mixed with pollutants (such as PM2.5) into the atmosphere as CO and CO2 (Aurell and Gullett 2013). We used the concentrations above-ambient CO2 (ΔCO2) and above-ambient CO (ΔCO) to approximate the total mass of emitted carbon then the amount of biomass burned based on the carbon content of the biomass. Two Tenax tubes (on the Kolibri) were co-located and sampled for different volumes: 0.33 L for tube 1 and 3.5 L for tube 2. Tube 1 sampled only the first burn while tube 2 sampled both burns. In Figure 8, we analyzed the emission factors and their trend with the modified combustion efficiency (MCE), which can be calculated as the ratio between ΔCO2 and the sum of ΔCO2 and ΔCO (MCE = ΔCO2/(ΔCO2+ΔCO)) (Christian et al. 2003, Burling et al. 2011, Urbanski 2013). Emission factors of VOCs are negatively correlated with MCE; the data follow the trend line well, except for one benzene data point. This deviation of benzene was caused by breakthrough from the second Tenax tube with a sample volume of 3.5 L, which was confirmed by the breakthrough test in Section 3.4.1. Comparison with other emission factors determined using SUMMA canisters in the OBTF (Holder et al. in preparation) shows values of the same magnitude that follow the MCE trend (Urbanski 2013, 2014, Aurell et al. 2015) supporting the performance of the Tenax sampler.
Figure 8.
VOCs sampled from biomass burning of either Kentucky Blue Grass stubble (KBGS) or wheat stubble (WS) using a SUMMA canister (SU) and a Tenax tube (TE). Linear regression applies only to the SU data with the reported R2 value.
3.5. Evaluation of the effect of rotor wash on Kolibri sampling
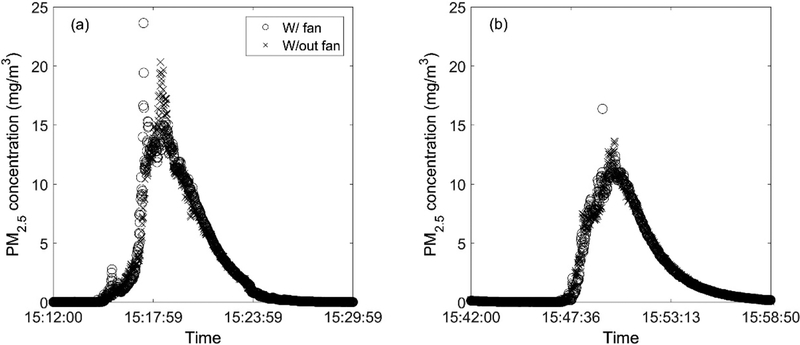
The potential effect of rotor wash on the Kolibri particle sampling was investigated in the OBTF using an electric fan (diameter ~1 meter, similar to the size of typical UAV rotor) with maximum speed to simulate the rotor wash from a multi-copter. A particle size/count instrument (DustTrak Model 8520, TSI Inc., Shoreview, MN, USA) was placed ~0.5 meter downstream of the fan and another was placed on a stack ~2 meters higher than the fan to measure particle distribution simultaneously. Each DustTrak continuously recorded PM2.5 concentration every second, with a working range from 0.001–100 mg/m3. A photometric calibration factor (PCF) was applied to calibrate the DustTrak output as recommended by the manufacturer. The PCF value, determined for each DustTrak unit, was calculated as the ratio between the averaged PM2.5 concentration measured by the DustTrak and a PM2.5 mass on a co-located Kolibri unit.
Three cardboard burning tests were conducted with two pairs of Kolibri and DustTrak units. The second test (Burn #2) was excluded from analysis since the PM2.5 impactor was improperly sealed during the experiment. The pairing of the Kolibri and DustTrak units was switched after each burn to improve sampling representativeness (Table 2). As expected, we found that the PCF values are quite different between these two units, but rather consistent for the same unit. For each burn test, the PM2.5 emission factors (the ratio between PM2.5 mass and carbon mass calculated from co- sampled ΔCO and ΔCO2) are very similar with and without the fan. As shown in Table 2, the PM2.5 emission factors estimated with fan differed less than 4% from that without the fan.
Table 2.
Fan test experiment summary
| Burn #1 | Burn #3 | |||
|---|---|---|---|---|
| Time (minutes) | 6.75 | 9.7 | ||
| Condition | W/ Fan | W/out Fan | W/ Fan | W/out Fan |
| Sampling Units | DustTrak #1 Kolibri #1 |
DustTrak #2 Kolibri #2 |
DustTrak #2 Kolibri #1 |
DustTrak #1 Kolibri #2 |
| Total Carbon (mg) | 10.30 | 10.21 | 8.99 | 8.68 |
| PM2.5 Weight (mg) | 0.555 | 0.545 | 0.445 | 0.445 |
| PCF value | 1.34 | 7.71 | 8.06 | 1.44 |
| PM2.5 emission factor | 0.0539 | 0.0534 | 0.0495 | 0.0513 |
After applying the PCF values, the time series of calibrated PM2.5 concentrations from the two DustTrak units were plotted in Fig. 9. The measured PM2.5 values from these two burns were very similar (R2=0.95) when comparing the case with and without the fan. This test suggests that the potential effect of the UAV rotor wash on particle sampling is minimal under these well-mixed conditions, which is consistent with a previous study (Bartholmai and Neumann 2011).
Figure 9.
Time series of PM2.5 concentration measured in Burn #1 (a) and Burn #3 (b) by the DustTrak with and without an upstream electric fan simulating the rotor wash effect of the multicopter.
4. Open Detonation Experiment
The performance of the Kolibri was tested on a UAV flight commissioned by the U.S. Army Corps of Engineers and operated by the Alaska Center for Unmanned Aircraft System Integration (ACUASI). The Kolibri was mounted on an electric powered rotary wing helicopter from ACUASI to sample emissions from the detonation plume. It offers a flight time of 10 minutes with a maximum payload of 3 kg, and a hover endurance of 30 minutes with 1.2 kg payload. Since the weight of the original Kolibri (3.5 kg) was higher than the maximum payload of this particular UAV, the VOC sampling system was not included in Kolibri. The reconfigured Kolibri system includes all other instruments (Table 1) and weights 3 kg. Also, it has a smaller size (15 cm by 15 cm by 22.5 cm) compared to the original Kolibri (15 cm×15 cm×30 cm) to fit to the UAV. An aerostat-borne multi-pollutant sensor package (called “Flyer”) was also used in this sampling mission, allowing direct comparison against the Kolibri. It has been described in details elsewhere (Aurell et al. 2011; Aurell et al. 2012; Aurell and Gullett 2013) and we only present a brief description here. The Flyer is equipped with an onboard computer and is programmed to perform data acquisition from sensors, wirelessly transfer data to ground personnel for real-time viewing, and receive commands from ground control some sample process. Its instruments included continuous CO2 measurement using a Licor 820 analyzer, CO and CO2 and VOC measurement using the SUMMA canisters, PM2.5 and PM10 using batch inertial impactors with a 47-mm diameter Teflon filter (pore size of 2 μm) and sampling at 10 L/min powered by a Leland Legacy pump.
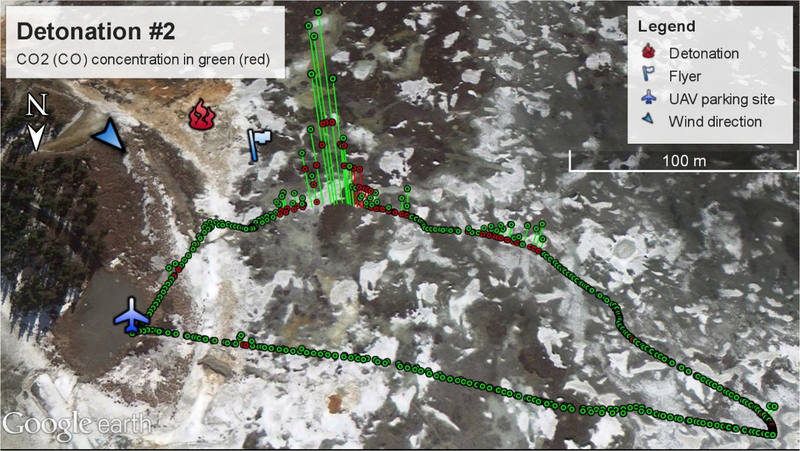
Four open detonations of C4 explosives were performed in Anchorage, AK during field experiments as part of an effort to assess the potential range contamination of energetics (e.g. HMX). Two C4 blocks (91% RDX) were used per detonation and each C4 block (“M112”) weighs 567 grams. The C4 blocks were detonated atop an ice block on a snow-covered field, little if any soil particles were ejected that may distort the PM2.5 sampling. The detonation site was located around 100 meters south of the parking location of the UAV, and the Flyer sampler was mounted on a cable system (not moving) positioned around 20 m downwind from the detonation to make independent sampling (Fig. 10). The UAV took off after the detonation, tracked the plume manually, and then returned to the parking place. A complete trip took 3–4 minutes and the Kolibri was sampling around 60–200 m away from the source (Fig. 10). Due to the small amount of fuels for each detonation, it was more like an instantaneous point source emission with transient plumes rather than continuous emissions such as wildfires. Therefore, PM2.5 concentrations were low per detonation and a single PM2.5 sample was obtained from an aggregate of four detonations.
Figure 10.
A Google Earth representation of the above-ambient CO2 (green) and CO (red) concentration measured by the Kolibri system during the 2nd detonation.
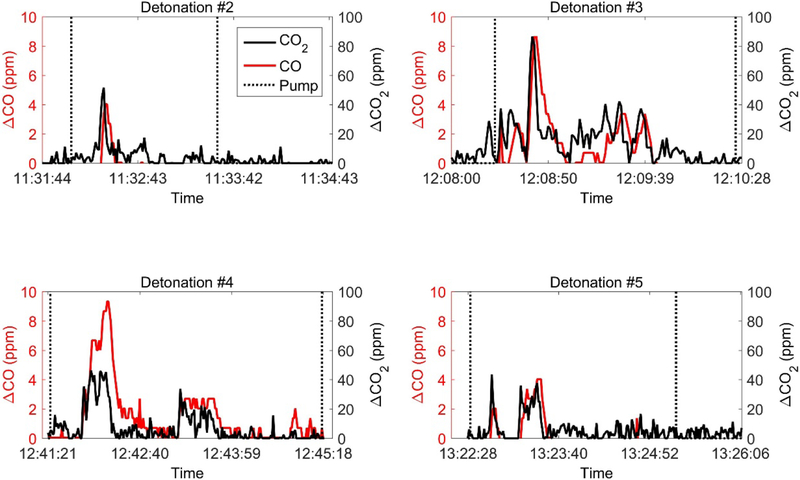
Ambient levels are determined each day by monitoring CO and CO2 levels in areas unaffected by combustion sources (e.g. the parking location). The time series of above-ambient CO and CO2 measured by the Kolibri from the four detonations are plotted in Fig. 11. For all tests, the spikes of CO and CO2 concentration coincide with each other and indicate the times when the Kolibri was successfully within the plume. For this particular application, the CO2 concentration is close to the trigger level and could cause the sampling pumps to turn on and off too slowly for effective sample gathering. To avoid this, a 3 s moving average of CO2 concentration was used as the trigger value. Calculations of the carbon mass using ΔCO2 and ΔCO when the Kolibri was sampling PM2.5 enabled the determination of a PM2.5 emission factor of the C4 explosive given its carbon fraction (0.2034). We obtained 39.4 mg PM2.5/gram C4 from the Kolibri system. With the estimated SD values of the CO (0.5 ppm when evaluated at 2 ppm CO concentration from Section 3.1) and CO2 (1% of readings), we performed a sensitivity analysis of the carbon mass calculation to incorporate sensor noise. We added (subtracted) the SD of CO2 and CO from the time series of ΔCO2 and ΔCO (Fig. 11) to estimate the higher (lower) bound of carbon mass. This resulted in a PM2.5 emission factor ranging from 27.9 to 47.8 mg PM2.5/gram C4. For comparison, the Flyer system reported 26.3 and 32.5 mg PM2.5/gram C4, indicating the degree of comparison from these limited tests.
Figure 11.
Time series of above ambient, ΔCO2 (black) and ΔCO (red) concentrations, sampled during four open detonations. Dash lines indicate the start and stop times of the PM2.5 sampling pump. No data were collected from Detonation #1.
5. Conclusions
A lightweight, operator-controlled sensor/sampler system was designed and built for ground-based (mobile vehicle) and aerial (tethered aerostat and UAV) emission sampling. The linear regression between the tested CO sensor and a CEM analyzer shows good agreement between them with a slope of 1.04 and R2 = 0.98. The CO sensor has a slower response than the CEM analyzer (average t90 is 18 seconds), but the total amounts of measured CO is similar as the CEM analyzer (normalized difference is 4.9%), suggesting its usefulness to quantify total CO emission of open area combustion events as needed for emission factor determinations. The tested CO2 sensor also agrees well with a LICOR 820 analyzer: linear regression shows a slope of 1.04 and R2 = 0.98. The PM2.5 mass obtained using the integrated PM2.5 sampling system showed good correlation (R2 = 0.87) and small bias (average percentage error = 5.8%) comparing against a calibrated commercial pump. Emission factors of VOCs sampled from the Tenax sorbent tube show results comparable to previous SUMMA canister sampling, except in the case of volatile benzene which exhibits breakthrough. Initial trials of the system in laboratory combustion tests suggest that the system’s PM2.5 values appear unaffected by rotor wash under well-mixed conditions. This newly developed Kolibri system was demonstrated while sampling detonation plumes from military explosives in Alaska and showed promising performance. In the future, we anticipate that the system can be applied to a variety of open area emission scenarios with ground-based or airborne platforms and can be modified with different sensors and samplers to suit application-specific scenarios. Meanwhile, we also noticed that more laboratory and field tests are needed to better characterize its operating performance on higher emitting and longer duration sources. Additional verification of PM2.5 sampling through the use of a time- and size-resolved PM sampler will better characterize PM capture performance and potential rotor wash effects in UAV applications.
Supplementary Material
Acknowledgements
The authors wish to acknowledge the partial support of the Department of Defense’s Strategic Research and Development Program (SERDP) through a grant to Dr. Michael Walsh and the U.S. Army Corps of Engineers Cold Regions Research Engineering Laboratory (ER2219). Dr. Xiaochi Zhou is supported through a Student Services Contract with the U.S. EPA (EP14C000013). UAV flight operations were led by Michael Hatfield and Leonard Ligon, ACUASI. The authors also thank Ron Williams and Gayle Hagler from EPA for their help to improve the manuscript. This publication has been subjected to the U.S. EPA’s peer and administrative review and has been approved for publication as a U.S. EPA document.
Reference
- Akagi SK, Yokelson RJ, Wiedinmyer C, Alvarado MJ, Reid JS, Karl T, Crounse JD, and Wennberg PO. 2011. “Emission factors for open and domestic biomass burning for use in atmospheric models.” Atmospheric Chemistry and Physics 11 (9):4039–4072. doi: 10.5194/acp-11-4039-2011. [DOI] [Google Scholar]
- Andreae MO, and Merlet P. 2001. “Emission of trace gases and aerosols from biomass burning.” Global Biogeochemical Cycles 15 (4):955–966. doi: Doi 10.1029/2000gb001382. [DOI] [Google Scholar]
- Aurell J, and Gullett BK. 2013. “Emission factors from aerial and ground measurements of field and laboratory forest burns in the southeastern US: PM2. 5, black and brown carbon, VOC, and PCDD/PCDF.” Environmental Science & Technology 47 (15):8443–8452. doi: 10.1021/es402101k. [DOI] [PubMed] [Google Scholar]
- Aurell J, Gullett BK, Pressley C, Tabor DG, and Gribble RD. 2011. “Aerostat-lofted instrument and sampling method for determination of emissions from open area sources.” Chemosphere 85 (5):806–811. doi: 10.1016/j.chemosphere.2011.06.075. [DOI] [PubMed] [Google Scholar]
- Aurell J, Gullett BK, and Tabor D. 2015. “Emissions from southeastern US Grasslands and pine savannas: Comparison of aerial and ground field measurements with laboratory burns.” Atmospheric Environment 111:170–178. doi: 10.1016/j.atmosenv.2015.03.001. [DOI] [Google Scholar]
- Avissar R, Holder HE, Abehserra N, Bolch MA, Novick K, Canning P, Prince K, Magalhaes J, Matayoshi N, Katul G, Walko RL, and Johnson KM. 2009. “The Duke University helicopter observation platform.” Bulletin of the American Meteorological Society 90 (7):939–954. doi: 10.1175/2008BAMS2628.1. [DOI] [Google Scholar]
- Bakker E 2004. “Electrochemical sensors.” Analytical Chemistry 76 (12):3285–3298. doi: 10.1021/ac049580z. [DOI] [PubMed] [Google Scholar]
- Bartholmai M, and Neumann PP. 2011. “Adaptive ortsaufgelöste Gaskonzentrationsmessung mit einer Mikrodrohne.” tm - Technisches Messen 78 (10):470–478. doi: 10.1524/teme.2011.0158. [DOI] [Google Scholar]
- Bond TC, Streets DG, Yarber KF, Nelson SM, Woo JH, and Klimont Z. 2004. “A technology-based global inventory of black and organic carbon emissions from combustion.” Journal of Geophysical Research-Atmospheres 109 (D14). doi: 10.1029/2003JD003697. [DOI] [Google Scholar]
- Burling IR, Yokelson RJ, Akagi SK, Urbanski SP, Wold CE, Griffith DWT, Johnson TJ, Reardon J, and Weise DR. 2011. “Airborne and ground-based measurements of the trace gases and particles emitted by prescribed fires in the United States.” Atmos. Chem. Phys 11 (23):12197–12216. doi: 10.5194/acp-11-12197-2011. [DOI] [Google Scholar]
- Christian TJ, Kleiss B, Yokelson RJ, Holzinger R, Crutzen PJ, Hao WM, Saharjo BH, and Ward DE. 2003. “Comprehensive laboratory measurements of biomass-burning emissions: 1. Emissions from Indonesian, African, and other fuels.” Journal of Geophysical Research-Atmospheres 108 (D23). doi: 10.1029/2003JD003704. [DOI] [Google Scholar]
- Crutzen PJ, and Andreae MO. 1990. “Biomass burning in the tropics: Impact on atmospheric chemistry and biogeochemical Cycles.” Science 250 (4988):1669–1678. doi: 10.1126/science.250.4988.1669. [DOI] [PubMed] [Google Scholar]
- Grandesso E, Gullett B, Touati A, and Tabor D. 2011. “Effect of moisture, charge size, and chlorine concentration on PCDD/F emissions from simulated open burning of forest biomass.” Environmental Science & Technology 45 (9):3887–3894. doi: 10.1021/es103686t. [DOI] [PubMed] [Google Scholar]
- Gullett BK, Touati A, Huwe J, and Hakk H. 2006. “PCDD and PCDF emissions from simulated sugarcane field burning.” Environmental Science & Technology 40 (20):6228–6234. doi: 10.1021/es060806k. [DOI] [PubMed] [Google Scholar]
- Harper Martin. 1993. “Evaluation of solid sorbent sampling methods by breakthrough volume studies.” Annals of Occupational Hygiene 37 (1):65–88. [Google Scholar]
- Hegg DA, Radke LF, Hobbs PV, Brock CA, and Riggan PJ. 1987. “Nitrogen and sulfur emissions from the burning of forest products near large urban areas.” Journal of Geophysical Research-Atmospheres 92 (D12):14701–14709. doi: 10.1029/JD092id12p14701. [DOI] [Google Scholar]
- Holder A, Gullett BK, Elleman R, Urbanski SP, O’Neill S, and Mitchell W. In preparation. Khan A, Schaefer D, Tao L, Miller DJ, Sun K, Zondlo MA, Harrison WA, Roscoe B, and Lary DJ. 2012. “Low power greenhouse gas sensors for unmanned aerial vehicles.” Remote Sensing 4 (5):1355–1368. doi: 10.3390/rs4051355. [DOI] [Google Scholar]
- Laursen KK, Ferek RJ, Hobbs PV, and Rasmussen RA. 1992. “Emission factors for particles, elemental carbon, and trace gases from the Kuwait oil fires.” Journal of Geophysical Research-Atmospheres 97 (D13):14491–14497. [Google Scholar]
- McDonagh C, Burke CS, and MacCraith BD. 2008. “Optical chemical sensors.” Chemical Reviews 108 (2):400–422. doi: 10.1021/cr068102g. [DOI] [PubMed] [Google Scholar]
- McGonigle AJS, Aiuppa A, Giudice G, Tamburello G, Hodson AJ, and Gurrieri S. 2008. “Unmanned aerial vehicle measurements of volcanic carbon dioxide fluxes.” Geophysical Research Letters 35 (6). doi: 10.1029/2007gl032508. [DOI] [Google Scholar]
- Nassar R, Logan JA, Megretskaia IA, Murray LT, Zhang L, and Jones DBA. 2009. “Analysis of tropical tropospheric ozone, carbon monoxide, and water vapor during the 2006 El Nino using TES observations and the GEOS-Chem model.” Journal of Geophysical Research-Atmospheres 114. doi: 10.1029/2009jd011760. [DOI] [Google Scholar]
- Peters RJB, and Bakkeren HA. 1994. “Sorbents in sampling. Stability and breakthrough measurements.” Analyst 119 (1):71–74. [Google Scholar]
- Piedrahita R, Xiang Y, Masson N, Ortega J, Collier A, Jiang Y, Li K, Dick RP, Lv Q, Hannigan M, and Shang L. 2014. “The next generation of low-cost personal air quality sensors for quantitative exposure monitoring.” Atmospheric Measurement Techniques 7 (10):3325–3336. doi: 10.5194/amt-7-3325-2014. [DOI] [Google Scholar]
- Pieri D, Diaz JA, Bland G, Fladeland M, Madrigal Y, Corrales E, Alegria O, Alan A, Realmuto V, Miles T, and Abtahi A. 2013. “In situ observations and sampling of volcanic emissions with NASA and UCR unmanned aircraft, including a case study at Turrialba Volcano, Costa Rica.” Remote Sensing of Volcanoes and Volcanic Processes: Integrating Observation and Modelling 380:321–352. doi: 10.1144/SP380.13. [DOI] [Google Scholar]
- Reid JS, Hyer EJ, Prins EM, Westphal DL, Zhang JL, Wang J, Christopher SA, Curtis CA, Schmidt CC, Eleuterio DP, Richardson KA, and Hoffman JP. 2009. “Global monitoring and forecasting of biomass-burning smoke: Description of and Lessons from the Fire Locating and Modeling of Burning Emissions (FLAMBE) program.” Ieee Journal of Selected Topics in Applied Earth Observations and Remote Sensing 2 (3):144–162. doi: 10.1109/Jstars.2009.2027443. [DOI] [Google Scholar]
- Reid JS, Koppmann R, Eck TF, and Eleuterio DP. 2005. “A review of biomass burning emissions part II: intensive physical properties of biomass burning particles.” Atmospheric Chemistry and Physics 5:799–825. [Google Scholar]
- Riggin RM, Winberry WT, and Murphy NT. 1988. Compendium of methods for the determination of toxic organic compounds in ambient air. Engineering-Science, Inc., Cary, NC (USA). [Google Scholar]
- Siebert H, Franke H, Lehmann K, Maser R, Saw EW, Schell D, Shaw RA, and Wendisch M. 2006. “Probing finescale dynamics and microphysics of clouds with helicopter-borne measurements.” Bulletin of the American Meteorological Society 87 (12):1727–1738. doi: 10.1175/Bams-87-12-1727. [DOI] [Google Scholar]
- Urbanski SP 2013. “Combustion efficiency and emission factors for wildfire-season fires in mixed conifer forests of the northern Rocky Mountains, US.” Atmospheric Chemistry and Physics 13 (14):7241–7262. [Google Scholar]
- Urbanski SP 2014. “Wildland fire emissions, carbon, and climate: emission factors.” Forest Ecology and Management 317:51–60. [Google Scholar]
- Ward DE, Hao WM, Susott RA, Babbitt RE, Shea RW, Kauffman JB, and Justice CO. 1996. “Effect of fuel composition on combustion efficiency and emission factors for African savanna ecosystems.” Journal of Geophysical Research-Atmospheres 101 (D19):23569–23576. doi: Doi 10.1029/95jd02595. [DOI] [Google Scholar]
- Wiedinmyer C, Quayle B, Geron C, Belote A, McKenzie D, Zhang XY, O’Neill S, and Wynne KK. 2006. “Estimating emissions from fires in North America for air quality modeling.” Atmospheric Environment 40 (19):3419–3432. doi: 10.1016/j.atmosenv.2006.02.010. [DOI] [Google Scholar]
Associated Data
This section collects any data citations, data availability statements, or supplementary materials included in this article.


