Abstract
Objective:
To evaluate effect of postbiopsy hemorrhage on detection of peripheral zone (PZ) prostate cancer by multiparametric MR imaging according to Gleason score and tumor volume.
Methods:
This retrospective study included 54 biopsy-proven prostate cancer patients (median age, 67.0 years) who underwent multiparametric MR imaging. Two independent readers evaluated each sextant of the PZ using the PI-RADS v2. One reader recorded the presence or absence of hemorrhage per sextant on T1 weighted MR images. Areas under the receiver operating characteristic curves (AUCs) were used to evaluate cancer detection accuracy.
Results:
Postbiopsy hemorrhage was noted in 122 (37.7%) of 324 sextants of all patients. There was no significant difference in the AUC for detection of cancer with Gleason score ≥3 + 4 or volume ≥0.5 ml between sextants with and without hemorrhage (with hemorrhage, reader 1, 0.83 for Gleason score ≥3 + 4, 0.84 for tumor volume ≥0.5 ml; reader 2, 0.74 for Gleason score ≥3 + 4, 0.77 for tumor volume ≥0.5 ml; without hemorrhage, reader 1, 0.86 for Gleason score ≥3 + 4, 0.88 for tumor volume ≥0.5 ml; reader 2, 0.79 for Gleason score ≥3 + 4, 0.83 for tumor volume ≥0.5 ml; p > 0.2 for all).
Conclusion:
Postbiopsy hemorrhage did not negatively affect the detection of clinically significant PZ prostate cancer on multiparametric MR imaging.
Advances in knowledge:
Under influence of postbiopsy hemorrhage, multiparametric MR can be useful for the detection of clinically significant PZ prostate cancer.
INTRODUCTION
Advances in prostate MR imaging have improved detection, staging and characterization of prostate cancer, using a multiparametric approach, which combines anatomical and functional data. Since the European Society of Urogenital Radiology developed originally a structured reporting system for prostate MR (Prostate Imaging Reporting and Data system, PI-RADS) to standardize the interpretation of prostate MR imaging in 2012,1 the updated PI-RADS v. 2 (PI-RADS v. 2), published in 2015, suggested a more simplified approach for interpretation scheme.2 In addition, along with increasing emphasis on a diagnostic strategy geared towards detecting prostate cancer with high Gleason score or large volume, the system included a pathologic definition of clinically significant prostate cancer.
In spite of its good performance for prostate MR imaging, postbiopsy hemorrhage was a major substantial limitation of MR examination and a common deterrent to the accurate detection of prostate cancer.3–6 To deal with this problem, many practices have imposed a delay of MRI for 3–8 weeks after biopsy.3, 6 Otherwise, the lexicon of PI-RADS v. 2 stated that the detection of clinically significant cancer was not likely to be substantially compromised by postbiopsy hemorrhage, and there might be no need to delay MR after biopsy if the purpose of the examination was to detect and characterize clinically significant cancer.2 Several investigators have also reported that the presence of hemorrhage does not negatively affect overall detection of peripheral zone (PZ) prostate cancer.4, 6,7 However, we have not found relevant studies, which support explicitly such recommendations of PI-RADS v. 2, evaluating the relationships between postbiopsy hemorrhage and cancer detectability on MR imaging with measures of Gleason score and tumor volume which is main factor determining clinically significant prostate cancer. Thus, the purpose of our study was to evaluate the effect of postbiopsy hemorrhage on the detection of PZ prostate cancer using multiparametric MR imaging according to Gleason score and tumor volume.
METHODS AND MATERIALS
The institutional review board approved this retrospective study. We performed a retrospective search of our electronic medical records between March 2013 and February 2016 and identified 61 patients fulfilling the following inclusion criteria: (a) multiparametric prostate MR examination, including diffusion-weighted images and dynamic contrast-enhanced images performed after transrectal ultrasound-guided prostate biopsy; (b) radical prostatectomy performed within 6 months of prostate MR examination; (c) available step-section pathology tumor maps. We excluded patients with any prior treatment for prostate cancer (n = 1) or technically inadequate MR images (n = 6) (Figure 1). The final study population included 54 males (median age, 67.0 years; range: 54.0–80.0 years). The median time interval between biopsy and prostate MR examination was 7 days (range: 4–27 days). Median preoperative prostate-specific antigen (PSA) level at the time of MR examination was 7.8 ng ml−1 (range, 3.4–91.7 ng ml−1). A summary of the patient characteristics is shown in Table 1.
Figure 1.
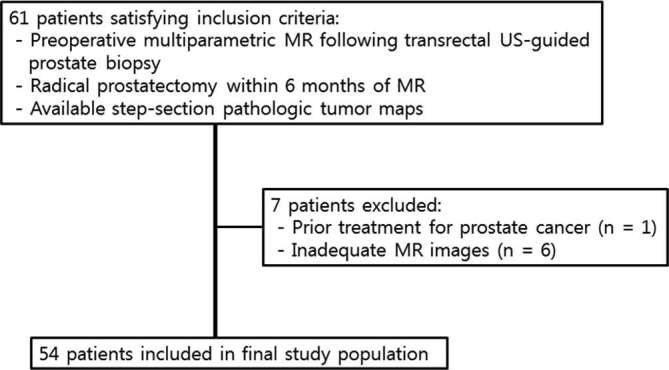
Patient selection flowchart.
Table 1.
Patient demographics and histopathological data
| Parameter | Data |
| Age at MR imaging (years) | 67.0 (54.0–80.0)a |
| PSA at time of diagnosis (ng ml–1) | 7.8 (3.4–91.7)a |
| Time between biopsy and MR imaging (days) | 7.0 (4.0–27.0)a |
| Gleason score at prostatectomy specimen | |
| 3 + 3 | 9 (16.7) |
| 3 + 4 | 23 (42.6) |
| 4 + 3 | 11 (20.1) |
| 3 + 5 | 1 (1.9) |
| 4 + 4 | 5 (9.3) |
| 4 + 5 | 4 (7.4) |
| 5 + 4 | 1 (1.9) |
Data of Gleason score are percentages in parentheses.
Data are medians in parentheses.
All patients underwent initial ultrasound-guided transrectal systematic 12-core biopsy combining 6 lateral biopsies at the base, mid-gland, and apex with a parasagittal sextant biopsy because of elevated PSA level, abnormal findings on transrectal prostate ultrasound, or abnormal digital prostate examination. Four patients required an additional 1 or 2 cores from a hypoechoic lesion that appeared suspicious on ultrasound.
MR imaging technique
All MR imaging was performed with a 3 T whole body MR unit (Magnetom Skyra, Erlangen, Germany). A body coil was used for excitation, and a multichannel pelvic phased-array coil was used for signal reception. Images were obtained by using the following sequences: transverse T1 weighted imaging with repetition time (TR)/echo time (TE) 712/11 ms; section thickness, 3 mm; intersection gap, 0.3 mm; field of view, 16 cm; matrix, 320 × 256; transverse, coronal, and sagittal T2 weighted fast spin-echo imaging with TR/RE, 4050–4710/72–83 ms; section thickness, 3 mm; intersection gap, 0.3 mm; field of view, 16 cm; matrix, 320 × 224 to 320 × 320. Spin-echo echoplanar DWI was obtained in the transverse plane with orientation and anatomical coverage identical to those for the transverse T2WI: TR/TE, 4500/64 ms; field of view, 24 cm; section thickness, 3 mm; intersection gap, 0.3 mm; matrix, 160 × 128; and b values of 0, 50, and 1000 sec mm–2 with in line reconstruction of the ADC map. DCE MR imaging was performed by using a transverse three-dimensional T1 weighted spoiled gradient-echo sequence with TR/TE, 4.2/1.4 ms; slice thickness, 3 mm; no intersection gap; field of view, 36 cm; matrix, 288 × 288; temporal resolution, 5 s. Images were acquired after intravenous injection of 0.1 mmol kg–1 of Dotarem (Guerbet Group, Villepinte, France) at a rate of 2 ml s−1 with an automatic injector (Sonic Shot GX; Nemato-Kyorindo, Tokyo, Japan). Before MR examination, 20 mg of butylscopolamine bromide (Buscopan; Boehringer-Ingelheim, Ingelheim, Germany) was injected intravenously to suppress bowel peristalsis.
Image analysis
Prostate MR images were interpreted retrospectively on a picture archiving and communication system workstation (PACS) (Centricity; GE Healthcare, Milwaukee, WI) by two radiologists (SIJ and HJJ) who were aware that the patients had biopsy-proven prostate cancer but were blinded to all other clinical and histopathological data. Reader 1 (SIJ) and reader 2 (HJJ) have 12 years and 10 year of experience in genitourinary imaging, respectively.
Cases were reviewed in two separate sessions maintaining a 4-week interval between sessions to avoid recall bias. During the first session, the peripheral zone (PZ) of the prostate in each patient was divided into sextants for the assessment of lesions: right and left regions at the level of the base, midgland, and apex. Postbiopsy hemorrhage was assessed in each sextant on axial T1 weighted MR images by one radiologist (SIJ). Hemorrhage was considered to be present when an area of high signal intensity on T1 weighted MR images was visualized in more than two-thirds of the sextant.3, 7,8 During the following session, the readers (SIJ and HJJ) independently recorded the score of the lesion using PI-RADS v. 2.2 The PI-RADS score per sextant was assigned by using a 5-point scale. The score ranged from 1 to 5, with 1 being most probably benign and 5 being most probably malignant. The interpretations of MR images based on PI-RADS v. 2 were matched with histopathological specimens after radical prostatectomy. Prostatectomy specimens were sliced from apex to base at 4 mm intervals. The distal 5 mm portion of the apex was amputated and coned. Seminal vesicles were removed and submitted separately. After paraffin embedding, microslices were placed on glass slides and stained with hematoxylin-eosin. A pathologist (SDL, with 16 years of experience in genitourinary pathology) recorded the presence of cancer foci in each sextant. A Gleason score and tumor volume were also assigned to each cancer foci according to standardized processing and reporting protocols.9 In the case of cancer foci involving both the transition zone (TZ) and PZ, those with a volume of at least 70% in the PZ were defined as PZ cancer foci; otherwise, they were considered to be TZ cancer foci.10 If multiple cancer foci were detected in the same sextant of a step-section histopathology slice, the largest cancer was chosen for analysis.
Statistical methods
Clinical and demographic data were reported using descriptive statistics. Median with interquartile range, or mean with standard deviation were used to summarize continuous variables; frequencies and percentages were used for categoric variables. Estimates were reported with 95% exact binomial confidence intervals (CI). Diagnostic performance in assessment of prostate cancer was analyzed on sextant-based levels. Sensitivity, specificity, negative predictive value and positive predictive value were estimated by treating sextants with a PI-RADS v. 2 score >4 as positive for cancer. The corresponding exact binomial 95% CIs were calculated for the analysis. Receiver operating characteristic curves and the areas under these curves (AUCs) were estimated using nonparametric methods for ordinal score assessments. The method proposed by Obuchowski was used to compare AUCs taking into account the clustered data.11 Interreader agreement was assessed by using weighted Kappa (к) statistics with quadratic weights and was interpreted by using the following scale: slight agreement,<0.20; fair agreement, 0.21–0.40; moderate agreement, 0.41–0.60; substantial agreement, 0.61–0.80; and almost perfect agreement, 0.81–1.0. The 95% CIs were reported for the estimated k statistics.12
p values ≤ 0.05 were considered to indicate statistical significance. All statistical analyses were performed with a statistical software package (MedCalc Software v. 14.10.2; MedCalc, Mariakerke, Belgium).
RESULTS
Histopathological findings and postbiopsy hemorrhage
A total of 83 cancer foci in the PZ and 4 cancer foci in the TZ were identified in the 54 patients at histopathological analysis. Our research focus was confined to PZ cancer for assessing MR imaging because of the small number of TZ cancers. At the sextant level, PZ cancer involved 189 (58.3%) of 324 sextants of all patients. Gleason scores were 6 (3 + 3) in 27 (14.3%) of the 189 sextants that showed PZ cancer, 7 (3 + 4) in 86 (45.5%) sextants, 7 (4 + 3) in 36 (19.0%) sextants, 8 (3 + 5) in one (0.5%) sextant, 8 (4 + 4) in 16 (8.5%) sextants, 9 (4 + 5) in 19 (10.1%) sextants, and 9 (5 + 4) in four (2.1%) sextants. The median volume of PZ cancer foci was 0.79 ml ± 7.09 (range, 0.002–33.95 ml). At the sextant level, PZ cancer of volume ≥0.5 ml occurred in 151 (79.9%) sextants and volume <0.5 ml in 38 (20.1%) sextants.
Postbiopsy hemorrhage in PZ was noted in 32 (59.3%) of the 54 patients and involved 122 (37.7%) of 324 sextants of all patients.
Detectability of prostate cancer in MR imaging
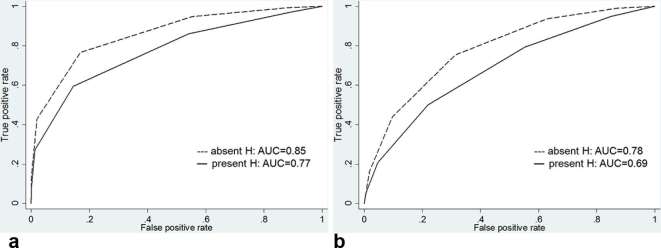
For the overall detection of prostate cancer at the sextant-based level, the AUCs for reader 1 were 0.82 [95% CI (0.77, 0.86)], and the overall AUCs for reader 2 were 0.75 [95% CI (0.70, 0.80)] (Table 2). Comparing cancer detection between sextants with and without hemorrhage, the AUCs for reader 1 were 0.85 [95% CI (0.79, 0.90)] in nonhemorrhagic sextants and decreased to 0.77 [95% CI (0.68, 0.84)] in hemorrhagic sextants (p = 0.088), while the AUCs for reader 2 were 0.78 [95% CI 0.62, 0.78)] in nonhemorrhagic sextants and decreased to 0.69 [95% CI (0.59, 0.76)] in hemorrhagic sextants (p = 0.107) (Figure 2 and Table 3). This trend towards lower accuracy in the presence of hemorrhage did not reach statistical significance. Interreader agreement for the detection of cancer was substantial (k = 0.69 in nonhemorrhagic sextants and k = 0.61 in hemorrhagic sextants).
Table 2.
Diagnostic performance for the detection of PZ prostate cancer
| Reader 1 | Reader 2 | |
| AUC | 0.82 (0.77–0.86) | 0.75 (0.70–0.80) |
| Sensitivity | 0.68 (0.61–0.74) [128/189] | 0.59 (0.52–0.66) [111/189] |
| Specificity | 0.87 (0.80–0.92) [117/135] | 0.83 (0.76–0.89) [112/135] |
| Positive predictive value | 0.88 (0.82–0.92) [128/146] | 0.83 (0.77–0.88) [111/134] |
| Negative predictive value | 0.66 (0.61–0.71) [117/178] | 0.59 (0.54–0.63) [112/190] |
Data are 95% Cis in parentheses and numerators and denominators in brackets.
Figure 2.
Graphs show receiver operating characteristic curves for overall tumor detection for reader (a) 1 and (b) 2 stratified by presence of hemorrhage. AUC, operating characteristic curve; H, hemorrhage.
Table 3.
Diagnostic performance for the detection of PZ prostate cancer stratified by presence of hemorrhage
| Reader 1 | Reader 2 | |||||
| Present hemorrhage | Absent hemorrhage | p value | Present hemorrhage | Absent hemorrhage | p value | |
| AUC | 0.77 (0.68–0.84) | 0.85 (0.79–0.90) | 0.088 | 0.69 (0.59–0.76) | 0.78 (0.62–0.78) | 0.107 |
| Sensitivity | 0.55 (0.43–0.67) [37/67] | 0.75 (0.66–0.82) [91/122] | 0.005 | 0.39 (0.27–0.52) [26/67] | 0.79 (0.68–0.87) [86/122] | <0.001 |
| Specificity | 0.89 (0.78–0.96) [49/55] | 0.85 (0.75–0.92) [68/80] | 0.503 | 0.89 (0.78–0.96) [49/55] | 0.79 (0.69–0.87)[63/80] | 0.129 |
| Positive predictive value | 0.86 (0.74–0.93) [37/43] | 0.88 (0.82–0.93) [91/103] | 0.741 | 0.81 (0.66–0.91) [26/32] | 0.84 (0.77–0.89) [86/103] | 0.692 |
| Negative predictive value | 0.62 (0.55–0.68) [49/79] | 0.69 (0.61–0.75) [68/99] | 0.329 | 0.54 (0.49–0.60) [49/90] | 0.64 (0.57–0.70) [63/99] | 0.163 |
Data are 95% Cis in parentheses and numerators and denominators in brackets.
Effect of Gleason score on cancer detection in hemorrhagic and nonhemorrhagic sextants
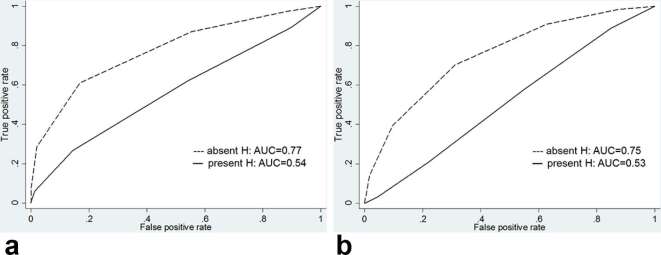
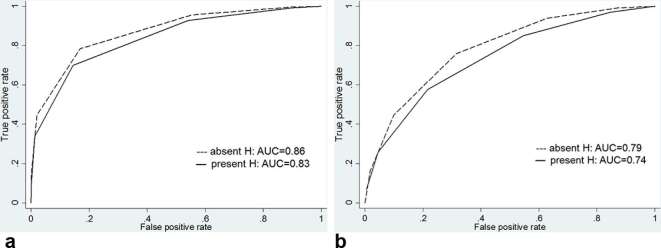
Regarding the detection of Gleason score 3 + 3 cancer, there was a significant difference in diagnostic performance between hemorrhagic and nonhemorrhagic sextants. The AUCs for reader 1 decreased from 0.77 [95% CI (0.67, 0.85)] in nonhemorrhagic sextants to 0.54 [95% CI (0.42, 0.66)] in hemorrhagic sextants (p = 0.038) and, the AUC for reader 2 also decreased from 0.75 [95% CI (0.65, 0.84)] in nonhemorrhagic sextants to 0.53 [95% CI (0.40, 0.65)] in hemorrhagic sextants (p = 0.042) (Figures 3–4 and Table 4). However, for the detection of Gleason score ≥3 +4 cancer, there was no significant difference in diagnostic performance between hemorrhagic and nonhemorrhagic sextants. The AUC for reader 1 was 0.86 [95% CI (0.80, 0.90)] in nonhemorrhagic sextants and 0.83 [95% CI (0.75, 0.90)] in hemorrhagic sextants (p = 0.607), and the AUC for reader 2 was 0.79 [95% CI (0.72, 0.84)] in nonhemorrhagic sextants and 0.74 [95% CI (0.65, 0.82)] in hemorrhagic sextants (p = 0.428) (Figures 5–6 and Table 5).
Figure 3.
Graphs show receiver operating characteristic curves for detection of tumors with Gleason score 3 + 3 for reader (a) 1 and (b) 2 stratified by presence of hemorrhage. AUC, operating characteristic curve; H, hemorrhage.
Figure 4.
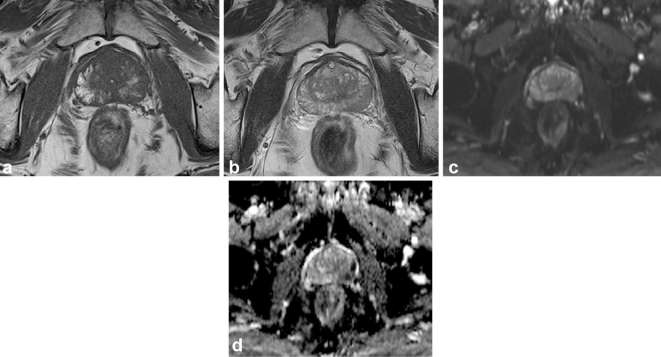
Multiparametric prostate MR Images of a 70-year-old male with Gleason score 3 + 3 tumor in the right mid-peripheral zone. T1 weighed MR image (a) shows hemorrhage as high signal intensity area in the right mid-peripheral zone and corresponding T2 weighted MR image (b) shows heterogeneous high signal intensity. Diffusion weighted image (c) and apparent diffusion coefficient map (d) show no focal lesion of marked diffusion restriction in the corresponding area. Both readers assigned PI-RADS v.n 2 score of 2 for the area.
Table 4.
Diagnostic performance for the detection of PZ prostate cancer with Gleason score 3 + 3 stratified by presence of hemorrhage
| Reader 1 | Reader 2 | |||||
| Present hemorrhage | Absent hemorrhage | p value | Present hemorrhage | Absent hemorrhage | p value | |
| AUC | 0.54 (0.42–0.66) | 0.77 (0.67–0.85) | 0.038 | 0.53 (0.40–0.65) | 0.75 (0.65–0.84) | 0.042 |
| Sensitivity | 0.27 (0.08–0.55) [4/15] | 0.58 (0.28–0.85) [7/12] | 0.110 | 0.13 (0.02–0.40) [2/15] | 0.75 (0.43–0.94) [9/12] | 0.001 |
| Specificity | 0.89 (0.78–0.96) [49/55] | 0.85 (0.75–0.92) [68/80] | 0.504 | 0.89 (0.78–0.96) [49/55] | 0.79 (0.68–0.87) [63/80] | 0.129 |
| Positive predictive value | 0.40 (0.18–0.67) [4/10] | 0.37 (0.22–0.54) [7/19] | 0.877 | 0.25 (0.07–0.60) [2/8] | 0.35 (0.24–0.47) [9/26] | 0.603 |
| Negative predictive value | 0.82 (0.76–0.86) [49/60] | 0.93 (0.87–0.96) [68/73] | 0.053 | 0.79 (0.75–0.82) [49/62] | 0.95 (0.89–0.98) [63/66] | 0.007 |
Data are 95% Cis in parentheses and numerators and denominators in brackets.
Figure 5.
Graphs show receiver operating characteristic curves for detection of tumors with Gleason score ≥3 +4 for reader (a) 1 and (b) 2 stratified by presence of hemorrhage. AUC, operating characteristic curve; H, hemorrhage.
Figure 6.
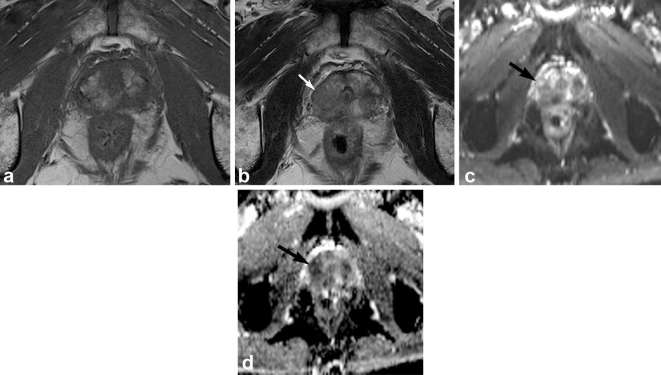
Multiparametric prostate MR Images of a 63-year-old male with Gleason score 3 + 4 tumor in the right apical peripheral zone. T1 weighed MR image (a) shows hemorrhage as high signal intensity area in the right apical peripheral zone. Corresponding T2 weighted MR image (b) shows ill-defined low signal intensity (arrow). Corresponding diffusion weighted image (c) and apparent diffusion coefficient map (d) show focal lesion of marked diffusion restriction (arrow). Both readers assigned PI-RADS v.sion 2 score of 4 for the area.
Table 5.
Diagnostic performance for the detection of PZ prostate cancer with Gleason score ≥3 +4 stratified by presence of hemorrhage
| Reader 1 | Reader 2 | |||||
| Present hemorrhage | Absent hemorrhage | p value | Present hemorrhage | Absent hemorrhage | p value | |
| AUC | 0.83 (0.75–0.90) | 0.86 (0.80–0.90) | 0.607 | 0.74 (0.65–0.82) | 0.79 (0.72–0.84) | 0.428 |
| Sensitivity | 0.63 (0.49–0.76) [33/52] | 0.76 (0.67–0.83) [84/110] | 0.087 | 0.46 (0.32–0.61) [24/52] | 0.70 (0.61–0.78) [77/110] | 0.003 |
| Specificity | 0.89 (0.78–0.96) [49/55] | 0.85 (0.75–0.92) [68/80] | 0.504 | 0.89 (0.78–0.96) [49/55] | 0.79 (0.68–0.87) [63/80] | 0.129 |
| Positive predictive value | 0.85 (0.72–0.92) [33/39] | 0.88 (0.79–0.93) [84/96] | 0.638 | 0.80 (0.64–0.90) [24/30] | 0.82 (0.73–0.89) [77/94] | 0.807 |
| Negative predictive value | 0.72 (0.64–0.79) [49/68] | 0.72 (0.62–0.81) [68/94] | 1.000 | 0.64 (0.57–0.70) [49/77] | 0.66 (0.55–0.75) [63/96] | 0.785 |
Data are 95% CI is in parentheses and numerators and denominators in brackets.
Effect of tumor volume on cancer detection in hemorrhagic and nonhemorrhagic sextants
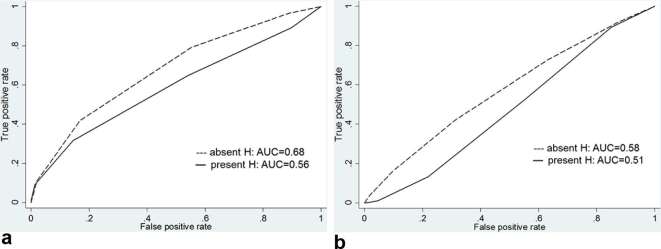
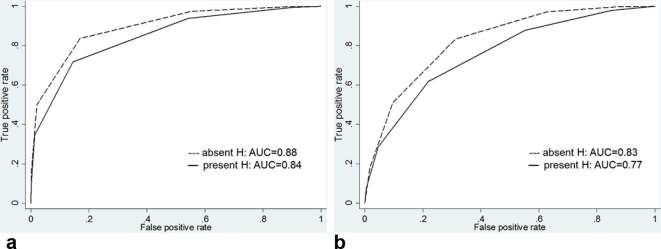
For the detection of cancer with a volume <0.5 ml, there was no significant difference in diagnostic performance between hemorrhagic and nonhemorrhagic sextants. The AUC for reader 1 was 0.68 [95% CI (0.58, 0.77)] in nonhemorrhagic sextants and 0.56 [95% CI (0.44, 0.68)] in hemorrhagic sextants (p = 0.235), and the AUC for reader 2 was 0.58 [95% CI (0.48, 0.68)] in nonhemorrhagic sextants and 0.51 [95% CI (0.39, 0.63)] in hemorrhagic sextants (p = 0.475) (Figure 7 and Table 6). For the detection of cancer with a volume ≥0.5 ml, there was also no significant difference in diagnostic performance between hemorrhagic and nonhemorrhagic sextants. The AUC for reader 1 was 0.88 [95% CI (0.83, 0.92)] in nonhemorrhagic sextants and 0.84 [95% CI (0.76, 0.91)] in hemorrhagic sextants (p = 0.369), and the AUC for reader 2 was 0.83 [95% CI (0.76, 0.88)] in nonhemorrhagic sextants and 0.77 [95% CI (0.67, 0.84)] in hemorrhagic sextants (p = 0.288) (Figure 8 and Table 7).
Figure 7.
Graphs show receiver operating characteristic curves for detection of tumors with a volume <0.5 ml for reader (a) 1 and (b) 2 stratified by presence of hemorrhage. AUC, operating characteristic curve; H, hemorrhage.
Table 6.
Diagnostic performance for the detection of PZ prostate cancer with volume <0.5 ml stratified by presence of hemorrhage
| Reader 1 | Reader 2 | |||||
| Present hemorrhage | Absent hemorrhage | p value | Present hemorrhage | Absent hemorrhage | p value | |
| AUC | 0.56 (0.44–0.68) | 0.68 (0.58–0.77) | 0.235 | 0.51 (0.39–0.63) | 0.58 (0.48–0.68) | 0.475 |
| Sensitivity | 0.33 (0.13–0.59) [6/18] | 0.40 (0.19–0.64) [8/19] | 0.663 | 0.06 (0.01–0.27) [1/18] | 0.40 (0.19–0.64) [8/20] | 0.016 |
| Specificity | 0.89 (0.78–0.96) [49/55] | 0.85 (0.75–0.92) [69/81] | 0.503 | 0.89 (0.78–0.96) [49/55] | 0.79 (0.68–0.87) [63/80] | 0.129 |
| Positive predictive value | 0.50 (0.27–0.73) [6/12] | 0.40 (0.24–0.58) [8/20] | 0.587 | 0.14 (0.02–0.56) [1/7] | 0.32 (0.19–0.48) [8/25] | 0.357 |
| Negative predictive value | 0.80 (0.74–0.85) [49/61] | 0.85 (0.80–0.89) [69/80] | 0.437 | 0.74 (0.71–0.77) [49/66] | 0.84 (0.78–0.88) [63/75] | 0.145 |
Data are 95% CI is in parentheses and numerators and denominators in brackets.
Figure 8.
Graphs show receiver operating characteristic curves for detection of tumors with a volume ≥0.5 ml for reader (a) 1 and (b) 2 stratified by presence of hemorrhage. AUC, operating characteristic curve; H, hemorrhage.
Table 7.
Diagnostic performance for the detection of PZ prostate cancer with volume ≥0.5 ml stratified by presence of hemorrhage
| Reader 1 | Reader 2 | |||||
| Present hemorrhage | Absent hemorrhage | p value | Present hemorrhage | Absent hemorrhage | p value | |
| AUC | 0.84 (0.76–0.91) | 0.88 (0.83–0.92) | 0.369 | 0.77 (0.67–0.84) | 0.83 (0.76–0.88) | 0.288 |
| Sensitivity | 0.63 (0.48–0.77) [30/48] | 0.81 (0.72–0.88) [83/102] | 0.018 | 0.51 (0.36–0.66) [24/48] | 0.76 (0.67–0.84) [78/102] | 0.002 |
| Specificity | 0.89 (0.78–0.96) [49/55] | 0.85 (0.75–0.92) [68/80] | 0.504 | 0.89 (0.78–0.96) [48/55] | 0.79 (0.68–0.87) [63/80] | 0.129 |
| Positive predictive value | 0.84 (0.70–0.92) [30/36] | 0.87 (0.80–0.92) [83/95] | 0.658 | 0.81 (0.65–0.90) [24/31] | 0.82 (0.75–0.88) [78/95] | 00.901 |
| Negative predictive value | 0.73 (0.65–0.80) [49/67] | 0.78 (0.70–0.84) [68/87] | 0.474 | 0.67 (0.60–0.73) [48/72] | 0.72 (0.65–0.79) [63/87] | 0.496 |
Data are 95% CI is in parentheses and numerators and denominators in brackets.
DISCUSSION
We observed that the diagnostic accuracy for overall PZ prostate cancer detection on multiparametric MR decreased in the presence of postbiopsy hemorrhage. However, this trend towards decreased accuracy in the presence of postbiopsy hemorrhage did not reach statistical significance. In regard to Gleason score and tumor volume, accuracy for the detection of cancer with Gleason score 3 + 3 decreased significantly in the presence of postbiopsy hemorrhage but postbiopsy hemorrhage did not affect accuracy for the detection of cancer with Gleason score ≥3 + 4. In addition, postbiopsy hemorrhage did not affect accuracy for the detection of cancers with either volume <0.5 ml or ≥0.5 ml.
Postbiopsy hemorrhage was one of the major problems for accurate tumor localization in the prostate MR images. Prolonged hemorrhage with regional spread might be attributed to the citrate, which had anticoagulant properties and was abundant in the prostate.4 High signal intensity changes on T1 weighted MR imaging have been found in 28−77% of patients after biopsy and such changes could cause over- or underestimates of tumor extent or stage on MR images.5, 6,13 Several authors have proposed adjusting the time interval between biopsy and MR examination to eliminate the influence of postbiopsy hemorrhage on MR images. However, this approach might not always be feasible or necessary due to individual variation in the period required for full resolution of hemorrhage, and clinical practice might need to be modified due to patient’s circumstances or local practice guidelines.2, 4,5,14 In fact, most of the suggestions about dealing with postbiopsy hemorrhage on MR images were derived from results using conventional T1 and T2 weighted MR images. Kaji et al15 showed the accuracy of T1 and T2 weighted MR for tumor detection in the presence of hemorrhage was 52%, and White et al6 reported 63% of accuracy of T1 and T2 weighted MR for extracapsular extension in the presence of postbiopsy hemorrhage. However, with evolving DWI and DCE MR techniques, Rosenkrantz et al4 reported that extensive hemorrhage did not negatively affect accuracy for tumor detection using multiparametric MR imaging, although T2 weighted MR alone showed a trend towards lower sensitivity. Another study of theirs also demonstrated ADC values were significantly lower in tumors compared with hemorrhagic benign PZ.16
Recently, PI-RADS v. 2 has been widely used for evaluating prostate cancer on multiparametric MR imaging, and several researchers have reported it is a valuable system to diagnose clinically significant prostate cancer.17–21 When we adopted PI-RADS v. 2 as a tool for evaluating PZ prostate cancer, we realized the presence of hemorrhage did not significantly affect overall accuracy for the diagnosis of PZ prostate cancer on multiparametric MR imaging. Our results were similar to that of Rosenkrantz et al4 who had used a five-point Likert scale as an imaging scoring system. An additional important aspect of our findings was the effect of Gleason score and tumor volume on the performance of multiparametric prostate MR imaging using PI-RADS v. 2. We demonstrated that hemorrhage did not affect detection of tumors with Gleason score ≥3 + 4 or with volume ≥0.5 ml on multiparametric prostate MR imaging. If prostate cancer with Gleason score ≥3 + 4 or volume ≥0.5 ml is usually accepted as clinically significant cancer,22, 23 we confirmed that multiparametric prostate MR imaging maintained diagnostic accuracy for the detection of clinically significant cancer in the presence of postbiopsy hemorrhage, which could be valuable evidence for timing of MR following biopsy introduced by PI-RADS v. 2. Our results also suggested that the usefulness of multiparametric prostate MR imaging for risk stratification of prostate cancer was not hindered by postbiopsy hemorrhage.
We acknowledge several limitations of our study. It was a retrospective analysis inherently biased by patient selection. Second, prostate cancer in TZ was not included in the analysis. However, hemorrhage is less frequent and lasts for a shorter time in this zone than in the PZ.5 Third, all patients experienced a time delay between transrectal ultrasound-guided biopsy and MR examination of less than 4 weeks. Although this was shorter than that of similar studies,4, 5,16 such a time-frame had positive aspect in that we could easily assess the effect of hemorrhage due to the high prevalence of hemorrhage. Fourth, specific finding for tumor detection on T1 wieghted MR, such as hemorrhagic exclusion sign, was not evaluated in this study.7 However, that was out of the scope of our research because we used PI-RADS v. 2 which does not incorporate T1-weighted MR as the dominant sequence.
In conclusion, the present study showed that postbiopsy hemorrhage had a variable effect on the diagnostic accuracy of multiparametric MR imaging for the detection of PZ prostate cancer according to Gleason score and tumor volume. However, it did not negatively affect the detection of tumor with Gleason score ≥3 + 4 or with volume ≥0.5 ml. These results warrant that multiparametric MR imaging in the presence of postbiopsy hemorrhage can be useful for the detection of clinically significant PZ prostate cancer.
Contributor Information
Sung Il Jung, Email: radsijung@kuh.ac.kr.
Hae Jeong Jeon, Email: haejeong@kuh.ac.kr.
Hee Sun Park, Email: heesun@kuh.ac.kr.
Mi Hye Yu, Email: 20140130@kuh.ac.kr.
Young Jun Kim, Email: yjkim@kuh.ac.kr.
Seung Eun Lee, Email: 20150063@kuh.ac.kr.
So Dug Lim, Email: sdlim@kuh.ac.kr.
REFERENCES
- 1.Barentsz JO, Richenberg J, Clements R, Choyke P, Verma S, Villeirs G, et al. . European Society of Urogenital Radiology ESUR prostate MR guidelines 2012. Eur Radiol 2012; 22: 746–57. doi: 10.1007/s00330-011-2377-y [DOI] [PMC free article] [PubMed] [Google Scholar]
- 2.Weinreb JC, Barentsz JO, Choyke PL, Cornud F, Haider MA, Macura KJ, et al. . PI-RADS prostate imaging - reporting and data system: 2015, version 2. Eur Urol 2016; 69: 16–40. doi: 10.1016/j.eururo.2015.08.052 [DOI] [PMC free article] [PubMed] [Google Scholar]
- 3.Qayyum A, Coakley FV, Lu Y, Olpin JD, Wu L, Yeh BM, et al. . Organ-confined prostate cancer: effect of prior transrectal biopsy on endorectal MRI and MR spectroscopic imaging. AJR Am J Roentgenol 2004; 183: 1079–83. doi: 10.2214/ajr.183.4.1831079 [DOI] [PubMed] [Google Scholar]
- 4.Rosenkrantz AB, Mussi TC, Hindman N, Lim RP, Kong MX, Babb JS, et al. . Impact of delay after biopsy and post-biopsy haemorrhage on prostate cancer tumour detection using multi-parametric MRI: a multi-reader study. Clin Radiol 2012; 67: e83–e90. doi: 10.1016/j.crad.2012.08.014 [DOI] [PubMed] [Google Scholar]
- 5.Tamada T, Sone T, Jo Y, Yamamoto A, Yamashita T, Egashira N, et al. . Prostate cancer: relationships between postbiopsy hemorrhage and tumor detectability at MR diagnosis. Radiology 2008; 248: 531–9. doi: 10.1148/radiol.2482070157 [DOI] [PubMed] [Google Scholar]
- 6.White S, Hricak H, Forstner R, Kurhanewicz J, Vigneron DB, Zaloudek CJ, et al. . Prostate cancer: effect of postbiopsy hemorrhage on interpretation of MR images. Radiology 1995; 195: 385–90. doi: 10.1148/radiology.195.2.7724756 [DOI] [PubMed] [Google Scholar]
- 7.Barrett T, Vargas HA, Akin O, Goldman DA, Hricak H. Value of the hemorrhage exclusion sign on T1-weighted prostate MR images for the detection of prostate cancer. Radiology 2012; 263: 751–7. doi: 10.1148/radiol.12112100 [DOI] [PMC free article] [PubMed] [Google Scholar]
- 8.Woodfield CA, Tung GA, Grand DJ, Pezzullo JA, Machan JT, Renzulli JF. Diffusion-weighted MRI of peripheral zone prostate cancer: comparison of tumor apparent diffusion coefficient with Gleason score and percentage of tumor on core biopsy. AJR Am J Roentgenol 2010; 194: W316–W322. doi: 10.2214/AJR.09.2651 [DOI] [PubMed] [Google Scholar]
- 9.Egevad L, Srigley JR, Delahunt B. International society of urological pathology consensus conference on handling and staging of radical prostatectomy specimens. Adv Anat Pathol 2011; 18: 301–5. doi: 10.1097/PAP.0b013e3182211ce0 [DOI] [PubMed] [Google Scholar]
- 10.Jung SI, Donati OF, Vargas HA, Goldman D, Hricak H, Akin O. Transition zone prostate cancer: incremental value of diffusion-weighted endorectal MR imaging in tumor detection and assessment of aggressiveness. Radiology 2013; 269: 493–503. doi: 10.1148/radiol.13130029 [DOI] [PubMed] [Google Scholar]
- 11.Obuchowski NA. Nonparametric analysis of clustered ROC curve data. Biometrics 1997; 53: 567–78. doi: 10.2307/2533958 [DOI] [PubMed] [Google Scholar]
- 12.Landis JR, Koch GG. The measurement of observer agreement for categorical data. Biometrics 1977; 33: 159–74. doi: 10.2307/2529310 [DOI] [PubMed] [Google Scholar]
- 13.Schnall MD, Imai Y, Tomaszewski J, Pollack HM, Lenkinski RE, Kressel HY. Prostate cancer: local staging with endorectal surface coil MR imaging. Radiology 1991; 178: 797–802. doi: 10.1148/radiology.178.3.1994421 [DOI] [PubMed] [Google Scholar]
- 14.You JY, Lee HJ, Hwang SI, Bae YJ, Kim H, Hong H, et al. . Value of T1/T2-weighted magnetic resonance imaging registration to reduce the postbiopsy hemorrhage effect for prostate cancer localization. Prostate Int 2015; 3: 80–6. doi: 10.1016/j.prnil.2015.06.005 [DOI] [PMC free article] [PubMed] [Google Scholar]
- 15.Kaji Y, Kurhanewicz J, Hricak H, Sokolov DL, Huang LR, Nelson SJ, et al. . Localizing prostate cancer in the presence of postbiopsy changes on MR images: role of proton MR spectroscopic imaging. Radiology 1998; 206: 785–90. doi: 10.1148/radiology.206.3.9494502 [DOI] [PubMed] [Google Scholar]
- 16.Rosenkrantz AB, Kopec M, Kong X, Melamed J Dakwar G, Babb JS, et al. . Prostate cancer vs. post-biopsy hemorrhage: diagnosis with T2- and diffusion-weighted imaging. J Magn Reson Imaging 2010; 31: 1387–94. doi: 10.1002/jmri.22172 [DOI] [PubMed] [Google Scholar]
- 17.Chen F, Cen S, Palmer S. Application of prostate imaging reporting and data system version 2 (PI-RADS v2): interobserver agreement and positive predictive value for localization of intermediate- and high-grade prostate cancers on multiparametric magnetic resonance imaging. Acad Radiol 2017; 24: 1101-1106. doi: 10.1016/j.acra.2017.03.019 [DOI] [PubMed] [Google Scholar]
- 18.Kasel-Seibert M, Lehmann T, Aschenbach R, Guettler FV, Abubrig M, Grimm MO, et al. . Assessment of PI-RADS v2 for the detection of prostate cancer. Eur J Radiol 2016; 85: 726–31. doi: 10.1016/j.ejrad.2016.01.011 [DOI] [PubMed] [Google Scholar]
- 19.Park SY, Jung DC, Oh YT, Cho NH, Choi YD, Rha KH, et al. . Prostate cancer: PI-RADS version 2 helps preoperatively predict clinically significant cancers. Radiology 2016; 280: 108–16. doi: 10.1148/radiol.16151133 [DOI] [PubMed] [Google Scholar]
- 20.Seo JW, Shin SJ, Taik Oh Y, Jung DC, Cho NH, Choi YD, et al. . PI-RADS version 2: detection of clinically significant cancer in patients with biopsy gleason score 6 prostate cancer. AJR Am J Roentgenol 2017; 209: W1–W9. doi: 10.2214/AJR.16.16981 [DOI] [PubMed] [Google Scholar]
- 21.Woo S, Kim SY, Lee J, Kim SH, Cho JY. PI-RADS version 2 for prediction of pathological downgrading after radical prostatectomy: a preliminary study in patients with biopsy-proven Gleason Score 7 (3+4) prostate cancer. Eur Radiol 2016; 26: 3580–7. doi: 10.1007/s00330-016-4230-9 [DOI] [PubMed] [Google Scholar]
- 22.Oon SF, Watson RW, O’Leary JJ, Fitzpatrick JM. Epstein criteria for insignificant prostate cancer. BJU Int 2011; 108: 518–25. doi: 10.1111/j.1464-410X.2011.09979.x [DOI] [PubMed] [Google Scholar]
- 23.Ploussard G, Epstein JI, Montironi R, Carroll PR, Wirth M, Grimm MO, et al. . The contemporary concept of significant versus insignificant prostate cancer. Eur Urol 2011; 60: 291–303. doi: 10.1016/j.eururo.2011.05.006 [DOI] [PubMed] [Google Scholar]


