

Abstract
Variability quenching is a widespread neural phenomenon in which trial‐to‐trial variability (TTV) of neural activity is reduced by repeated presentations of a sensory stimulus. However, its neural mechanism and functional significance remain poorly understood. Recurrent network dynamics are suggested as a candidate mechanism of TTV, and they play a key role in consciousness. We thus asked whether the variability‐quenching phenomenon is related to the level of consciousness. We hypothesized that TTV reduction would be compromised during reduced level of consciousness by propofol anesthetics. We recorded functional magnetic resonance imaging signals of resting‐state and stimulus‐induced activities in three conditions: wakefulness, sedation, and unconsciousness (i.e., deep anesthesia). We measured the average (trial‐to‐trial mean, TTM) and variability (TTV) of auditory stimulus‐induced activity under the three conditions. We also examined another form of neural variability (temporal variability, TV), which quantifies the overall dynamic range of ongoing neural activity across time, during both the resting‐state and the task. We found that (a) TTM deceased gradually from wakefulness through sedation to anesthesia, (b) stimulus‐induced TTV reduction normally seen during wakefulness was abolished during both sedation and anesthesia, and (c) TV increased in the task state as compared to resting‐state during both wakefulness and sedation, but not anesthesia. Together, our results reveal distinct effects of propofol on the two forms of neural variability (TTV and TV). They imply that the anesthetic disrupts recurrent network dynamics, thus prevents the stabilization of cortical activity states. These findings shed new light on the temporal dynamics of neuronal variability and its alteration during anesthetic‐induced unconsciousness.
Keywords: anesthesia, consciousness, fMRI, neural variability, propofol, recurrent network, sedation, temporal variability, trial‐to‐trial variability
1. INTRODUCTION
A close relationship between spontaneous and stimulus‐induced neural activities, based on the assumption of a linear superposition, is a commonly held tenet of the neuroscientific literature (Arieli, Sterkin, Grinvald, & Aertsen, 1996; Azouz & Gray, 1999; Becker, Reinacher, Freyer, Villringer, & Ritter, 2011; Fox, Snyder, Zacks, & Raichle, 2006). Given this assumption, the variance of the spontaneous and stimulus‐induced activities across trials should be additive as a direct consequence of the law of total variance (He, 2013). Then, one would expect to find an increase of total variability after stimulus onset.
A number of experiments have challenged this view by showing a decrease in trial‐to‐trial variability (TTV), commonly called TTV reduction, after stimulus‐onset. TTV reduction has been consistently observed in cellular recordings (Chang, Armstrong, & Moore, 2012; Churchland et al., 2010; Finn, Priebe, & Ferster, 2007; Monier, Chavane, Baudot, Graham, & Frégnac, 2003; Scaglione, Moxon, Aguilar, & Foffani, 2011; White, Abbott, & Fiser, 2012), electroencephalography/electrocorticography (EEG/ECoG) (He & Zempel, 2013; Schurger, Sarigiannidis, Naccache, Sitt, & Dehaene, 2015), and functional magnetic resonance imaging (fMRI; Ferri et al., 2015; He, 2013; Huang et al., 2017). These data were collected across a variety of species and brain areas and under a broad range of stimulus conditions suggesting that TTV reduction driven by stimulation or task was a widespread neural phenomenon. These findings also demonstrated that the spontaneous and stimulus‐induced activities were not independent but interacting with each. This interaction was thought to be mediated by active noise suppression (White et al., 2012), characterized as negative interaction (He, 2013), or nonlinear phase‐dependence (Huang et al., 2017).
Behaviorally, stronger TTV reduction is associated with faster reaction time (He, 2013), superior perceptual abilities (Arazi, Gonen‐Yaacovi, & Dinstein, 2017; Baria, Maniscalco, & He, 2017; Schurger et al., 2015), and superior memory recall (Xue et al., 2010). Therefore, it is plausible to assume that neuronal mechanisms involved in TTV reduction contribute to the disambiguation of environmental signals and enhance the efficiency of cortical information processing (Churchland et al., 2010; Finn et al., 2007; Monier et al., 2003; White et al., 2012).
The mechanism underlying TTV reduction has been explored by a series of neuronal network modeling studies. For instance, the TTV reduction by stimuli can arise from recurrent processing during which the states of cortical activity are stabilized by inputs (Deco & Hugues, 2012; Litwin‐Kumar & Doiron, 2012; Mazzucato, Fontanini, & La Camera, 2015; Rajan, Abbott, & Sompolinsky, 2010; Sussillo & Abbott, 2009). Recurrent network dynamics, consisting of distinct feedforward and feedback information flow, have been suggested as a mechanism of consciousness (Boly et al., 2011; Lamme & Roelfsema, 2000; Mashour, 2014; Moutard, Dehaene, & Malach, 2015; Tononi, Boly, Massimini, & Koch, 2016; Tononi & Edelman, 1998). This led us to ask whether the stimulus‐related TTV reduction also depends upon the level of consciousness. We hypothesized that TTV reduction would be reduced or absent when the level of consciousness is reduced. This hypothesis was supported by previous studies demonstrating that various anesthetics diminished recurrent processing through the suppression of anterior–posterior cortical feedback signaling (Alkire, Hudetz, & Tononi, 2008; Imas, Ropella, Ward, Wood, & Hudetz, 2005; Lee et al., 2013; Mashour & Hudetz, 2018).
On the first sight, neural variability may seem detrimental for accurate cognitive processing, perception, and potentially consciousness. However, several studies suggest that temporal variability (TV), defined as a fluctuation of neural activity over time, is beneficial for the neural system's adaptability, efficiency, and cognitive performance (Dai et al., 2016; Garrett, Kovacevic, McIntosh, & Grady, 2010, 2011, 2013; Garrett, Samanez‐Larkin, et al., 2013; McIntosh et al., 2010; McIntosh, Kovacevic, & Itier, 2008; Vakorin, Lippe, & McIntosh, 2011). Moreover, higher TV may reflect greater network complexity that is more capable for modulating its activity to explore a larger repertoire of brain states (Faisal, Selen, & Wolpert, 2008; Garrett, McIntosh, & Grady, 2011; Hudetz, Liu, & Pillay, 2015; Mišić, Vakorin, Paus, & McIntosh, 2011; Shew, Yang, Petermann, Roy, & Plenz, 2009; Vakorin, Mišić, Krakovska, & McIntosh, 2011). Conversely, when TV is low, such as during reduced level of consciousness, the capacity of the brain to explore different configurations/states would be reduced (Baria et al., 2018; Huang, Dai, et al., 2014; Huang, Wang, et al., 2014; Huang et al., 2016; Hudetz et al., 2015; Tagliazucchi, Chialvo, Siniatchkin, Brichant, & Laureys, 2016; Zhang et al., 2018).
In summary, on one hand, higher neural variability appears important for cognitive functioning and consciousness; on the other hand, a reduction of variability seems essential for stimulus processing or task response. The crucial point to dissolve the apparent contradiction is the distinction between the two forms of neural variability—the quenching of stimulus‐induced variability (i.e., TTV reduction), and the variability of ongoing neural activity across time (i.e., TV during resting‐state or entire task state). As alluded to above, the high TV of ongoing activity can be considered as the brain's exploration of possible states within a region of neuronal activity space (Churchland et al., 2010; Deco & Hugues, 2012; He, 2013; Nogueira, Lawrie, & Moreno‐Bote, 2018; Ponce‐Alvarez, He, Hagmann, & Deco, 2015; Tononi et al., 2016), whereas a superimposed stimulation would shrink the available neuronal activity space to a subset with high stimulus‐relevance; thus reducing the neural states from “exploratory” to “certainty.”
How the two forms of neural variability (TV and TTV) may be affected in reduced states of consciousness has not been elicited in the same experimental paradigm. Given its significance, we set out to investigate this question by an approach using anesthetic modulation of the level of consciousness. Specifically, we tested the hypothesis, the lack of TTV reduction during anesthetic administration as determined from blood oxygen‐level dependent (BOLD) signals of spontaneous (resting‐state) and stimulus‐induced activities in three conditions: wakefulness, propofol‐induced sedation, and unconsciousness (i.e., deep anesthesia). We measured the average (trial‐to‐trial mean, TTM) and variability (TTV) of the stimulus‐induced activity in response to auditory stimuli. We also measured the TV of ongoing activity during both resting‐state and task, and calculated the TV difference between resting and task states (i.e., task modulation of TV), under the three conditions.
2. MATERIALS AND METHODS
2.1. Subjects
The study was approved by the institutional review board of Huashan Hospital, Fudan University. Informed consent was obtained by all the subjects to participant in the study. Twenty right‐handed subjects were recruited (male/female: 8/12; age: 32–64 years), who were undergoing an elective transsphenoidal approach for resection of a pituitary microadenoma. The pituitary microadenomas were diagnosed by their size (<10 mm in diameter without growing out of the sella) based on radiological examinations and plasma endocrinal parameters. These subjects were American Society of Anesthesiologists physical status I or II grade, with no history of craniotomy, cerebral neuropathy, vital organ dysfunction, or administration of neuropsychiatric drugs. The subjects had no contraindication for an MRI examination, such as vascular clips or metallic implants. Among them, five subjects had to be excluded from the study and further data analysis because of excessive movements. Also, see below for more details on motion correction and subject exclusion.
2.2. Anesthesia protocol
Subjects fasted for at least 8 hr from solids and 2 hr from liquids before participating the study. During the fMRI study, vital signs including blood pressure, heart rate, pulse oximetry (SpO2), and partial pressure of carbon dioxide (PaCO2) were continuously monitored (Table 1). The subjects received propofol sedation and deep anesthesia, during which intravenous anesthetic propofol was infused through an intravenous catheter placed into a vein of the right hand or forearm. Propofol acts mainly on GABAA receptors, potentiating GABAergic interneurons in the cortex and enhancing neuronal inhibition (Brown, Purdon, & Van Dort, 2011; Franks, 2008). Propofol was administered using a target controlled infusion (TCI) pump to obtain constant effect‐site concentration, as estimated by the pharmacokinetic model (Marsh, Morton, & Kenny, 1991). Remifentanil (1.0 μg/kg) and succinylcholine (1.5 mg/kg) were administered to facilitate endotracheal intubation at deep anesthesia. TCI concentrations were increased in 0.1 μg/ml steps beginning at 1.0 μg/ml until reaching the appropriate effect‐site concentration. A 5‐min equilibration period was allowed to insure equilibration of propofol repartition between compartments.
Table 1.
Propofol concentrations, vital signs and behavioral assessments
| Propofol concentration | Mean blood pressure (mmHg) | Heart rate (beats/min) | SPO2 | PaCO2 (mmHg) | Ramsay scores |
|---|---|---|---|---|---|
|
Wakefulness (0 μg/ml) |
180 ± 37/85 ± 13 (mean ± SD) |
68 ± 11 | 98% ± 1% | 40.2 ± 3.6 | 1.0 ± 0 |
|
Sedation (1.3 μg/ml) |
141 ± 19/74 ± 11 | 63 ± 8 | 99% ± 1% | 46.0 ± 7.5 | 3.8 ± 1.7 |
|
Anesthesia (4.0 μg/ml) |
133 ± 29/72 ± 12 | 71 ± 13 | 99% ± 0% | 41.0 ± 4.4 | 6.0 ± 0 |
The TCI propofol were maintained at a stable effect‐site concentration of 1.3 μg/ml for sedation, and 4.0 μg/ml for deep anesthesia of which the dose reliably induces an unconscious state (Xu et al., 2009). The level of consciousness was evaluated clinically throughout the study with the Ramsay scale (Ramsay, Savege, Simpson, & Goodwin, 1974). The subjects were asked to strongly squeeze the hand of the investigator. The subject was considered fully awake if the response to verbal command (“squeeze strongly my hand!”) is clear and strong (Ramsay 1–2), in mild sedation if the response to verbal command is clear but slow (Ramsay 3–4), and in deep sedation or general anesthesia if there is no response to verbal command (Ramsay 5–6). For each assessment, Ramsay scale verbal commands were repeated twice (before remifentanil and succinylcholine were administrated at deep anesthesia) (Table 1). As anticipated, the corresponding Ramsay scores (n = 11; mean ± SD) for 1.3 μg/ml and 4.0 μg/ml of propofol concentration were 3.8 ± 1.7 and 6.0 ± 0.
The subjects breathed spontaneously during wakefulness and sedation. During deep anesthesia, the subjects were ventilated with intermittent positive pressure ventilation, setting tidal volume at 8–10 ml/kg, respiratory rate 10–12 beats/min, and maintaining PetCO2 (partial pressure of end tidal CO2) at 35–45 mmHg. Two certified anesthesiologists were present throughout the study, and complete resuscitation equipment were always available. Subjects wore earplugs and headphones during the fMRI scanning.
2.3. Data acquisition
fMRI acquisition consisted of 8‐min eyes closed resting‐state and 18‐min task‐state (auditory stimuli) scans for each level of consciousness (wakefulness, sedation, and anesthesia). The subject's head was fixed in the scan frame and padded with spongy cushions to minimize head movement. The subjects were informed to take a comfortable supine position and to relax with their eyes closed during scanning (with an eye patch). The subjects were instructed not to concentrate on anything in particular during resting‐state scan, and listen to the sound during task scan. A Siemens 3 T scanner (Siemens MAGNETOM, Erlangen, Germany) with a standard head coil was used to acquire gradient‐echo images of the whole brain via echo‐planar imaging, EPI (33 slices, repetition time/echo time [TR/TE] = 2,000/30 ms, slice thickness 5 = mm, field of view = 210 mm, flip angle = 90°, image matrix: 64 × 64); 240 scans (8 min) were acquired for the resting‐states, and 540 scans (18 min) were acquired for the task. In addition, high‐resolution anatomical images were acquired.
2.4. Task‐fMRI design
A sparse event‐related design was adopted with 60 trials. This included 30 own and 30 other (an unknown person's name) names that were delivered in a pseudo‐random order. The names were presented by a familiar voice (recorded from one of the patients' family members) with an audio clip lasting for 0.5 s (see (Lipsman et al., 2014; Qin et al., 2012) for details of this well‐established paradigm). The unknown names were matched to the own name by gender and number of syllables. In the presented study, own and other names were collapsed into a single condition (auditory stimuli) in order to increase the total number of trials which is beneficial for TTV calculation (see below). Each audio clip was followed by inter‐trial‐intervals (ITIs) ranging unpredictably from 15.5 to 25.5 s (2 s‐step). The benefit of long ITIs was avoiding potential nonlinearities associated with overlapping hemodynamic responses between preceding and subsequent trials, especially for TTV calculation (Huang et al., 2017). All stimuli were programmed using E‐Prime 2.0 (Psychology Software Tools, Pittsburgh, PA) and delivered via an audiovisual stimulus presentation system designed for an MRI environment. The volume of the headphones was adjusted to the comfort level. The subjects were required to pay attention and passively listen to the names without behavioral response or judgment.
2.5. Data preprocessing
Preprocessing steps were implemented in AFNI (http://afni.nimh.nih.gov/afni) including: (a) discarding the first four frames of each fMRI run; (b) slice timing correction; (c) rigid body correction/realignment within and across runs; (d) coregistration with high‐resolution anatomical images; (e) spatial normalization into Talaraich stereotactic space; (f) resampling to 3 × 3 × 3 mm3 voxels; (g) regressing out linear and nonlinear drift (equivalent to a high‐pass filtering of 0.0067 Hz), head motion and its temporal derivative, and mean time series from the white matter and cerebrospinal fluid to control for nonneural noise (Fox et al., 2005); (h) spatial smoothing with a 8 mm full‐width at half‐maximum isotropic Gaussian kernel; (i) the time‐course per voxel was normalized into z‐value by subtracting the mean and dividing by the standard deviation (SD) of BOLD signals across all scans, accounting for differences in variance of nonneural origin (e.g., distance from head coil) (He, 2011; Stephens, Honey, & Hasson, 2013).
The issue of motion artifacts was addressed rigorously as minor group differences in motion have been shown to artificially create between‐groups differences (Power et al., 2014; Power, Barnes, Snyder, Schlaggar, & Petersen, 2012; van Dijk, Sabuncu, & Buckner, 2012). We first calculated the indices of the amount of motion (shift and rotation) for each subject (Zang et al., 2007). Subjects whose head motion's shift >3 mm or rotation >3° were excluded. For the remaining subjects, frame‐wise displacement (FD) motion censoring was calculated using frame‐wise Euclidean Norm (square root of the sum squares) of the six‐dimension motion derivatives. A frame (TR) and its each previous frame were censored out from the data (using AFNI function 3dTproject) if the given frame's derivative value has a Euclidean Norm of FD > 0.4 mm (Huang, Liu, Mashour, & Hudetz, 2018). Furthermore, to further exclude the potential confound of head motion, the head motion indices was included as covariates during group‐level analysis.
It has been shown that including or excluding global signal regression (GSR) during preprocessing may affect the interpretations of the results (Chai, Castañán, Öngür, & Whitfield‐Gabrieli, 2012; Murphy, Birn, Handwerker, Jones, & Bandettini, 2009; Murphy & Fox, 2017; Saad et al., 2012). For this reason, we presented and compared the results both with and without GSR for all the following analyses.
2.6. The average of stimulus‐induced activity
The average of stimulus‐induced BOLD signal changes at each time point across trials was calculated within the time window after stimulus presentation (0–15 s). The averaged time‐course of each voxel of each subject was normalized by subtracting the mean value at stimulus onset (0–1 s). The peak value of evoked activity (4–5 s) was defined as TTM (trial‐to‐trial mean) index. Unlike conventional general linear model (GLM) analysis, we adopted TTM to quantify the stimulus‐evoked activity and thus to make the results comparable with the TTV index (see below). Also note that we compared the results between TTM and estimated activity (regression coefficients, β value) using GLM; the results of the two were approximately the same. Whole‐brain voxel‐wise one sample t tests against zero were performed at the group level for each condition, that is, wakefulness, sedation, and deep anesthesia. Unless otherwise stated, all resulting z‐maps were thresholded at α < 0.05 at the cluster level, where the corresponding p value at the voxel level was 0.005 with a cluster size of 85 voxels. This was achieved using AFNI's upgraded function 3dClustSim that simulates noise volume assuming the spatial auto‐correlation function is given by a mixed‐model rather than a Gaussian‐shaped function (Cox, Chen, Glen, Reynolds, & Taylor, 2017).
2.7. The variability of stimulus‐induced activity
The SD of BOLD signal changes at each time point across trials was calculated within the time window after stimulus presentation (0–15 s). The SD time‐course of each voxel of each subject was normalized by subtracting and dividing by the SD at stimulus onset (0–1 s) (He, 2013; Huang et al., 2017). The normalized SD value during the peak of evoked activity (4–5 s) was defined as TTV index (Huang et al., 2017). Whole‐brain voxel‐wise one sample t tests against zero were performed at the group level.
2.8. Analysis of TV—Task versus rest
The SD of BOLD signal changes across time for the entire task and rest periods, respectively, was calculated for each condition (wakefulness, sedation, and deep anesthesia), yielding six SD maps per subject. The task‐modulation of TV was defined as the difference map between task and rest (task minus rest) for each condition. The significance of task‐modulation effect of TV was examine for each network (see below for the network definition) using one sample t tests against zero at the group level with FDR correction.
2.9. Definition of functional networks
We adopted a well‐established network template derived from CONN's ICA analyses of HCP data set in 497 subjects (http://www.conn-toolbox.org). The network template included the default mode network (DMN), frontoparietal (FP), salience/cingulo‐opercular (Sal), language (Lan), dorsal attention (DA), sensorimotor (SM), and visual (Vis). In addition to these networks, we also included two brain areas (defined by AFNI atlas): bilateral primary auditory cortex (Audi) and thalamus (Tha). They were chosen due to the nature of our task design (auditory stimuli) such that we expected to see robust stimulus‐induced activity in these regions.
3. RESULTS
3.1. The average and variability of stimulus‐induced activity (TTM vs. TTV)
We found graded diminished TTM in both amplitude and spatial extension from wakefulness over sedation to deep anesthesia, where the TTM was limited to primary auditory cortices during anesthesia (Figure 1a). After GRS, it revealed “deactivation” in several brain areas including frontal, parietal, and visual cortices during wakefulness, while there was minimal impact of GSR on the results of sedation and deep anesthesia (Figure 1b).
Figure 1.
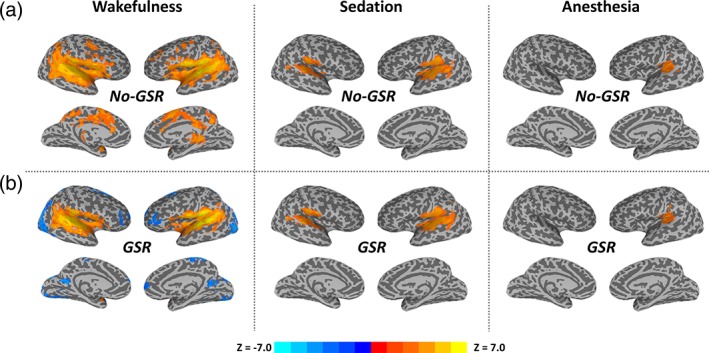
The average of stimulus‐induced activity across trials (trial‐to‐trial mean, TTM) during the peak period (4–5 s) in wakefulness, propofol‐induced sedation and deep anesthesia. Group‐level z‐maps (one sample t tests against zero) were corrected at α < 0.05 at the cluster level. (a) Results without global signal regression (no‐GSR). (b) Results with GSR [Color figure can be viewed at http://wileyonlinelibrary.com]
We observed significant TTV reduction after stimulus onset in especially the posterior part of brain including bilateral inferior parietal lobe and posterior cingulate cortex during wakefulness (Figure 2b). Note that these significant TTV values were negative (namely, reduction), because of the normalization performed against the stimulus onset (see Section 2); it thus indicated how the TTV changes relative to the baseline. Furthermore, the GSR helped identify a few more regions including angular gyrus, auditory, medial frontal, and anterior cingulate cortices (Figure 2b). In contrast, no significant TTV change was found during either sedation or deep anesthesia.
Figure 2.
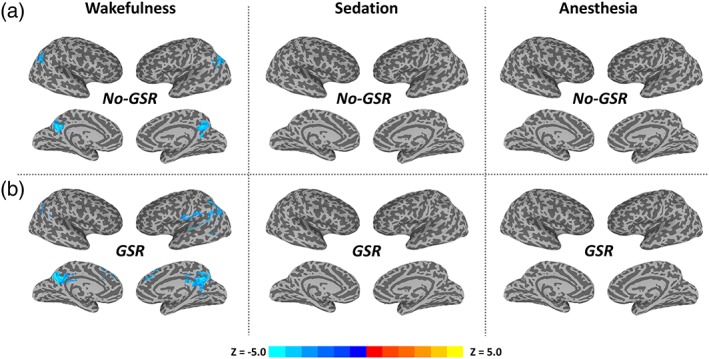
The variability of stimulus‐induced activity across trials (trial‐to‐trial variability, TTV) during the peak period (4–5 s) in wakefulness, propofol‐induced sedation and deep anesthesia. Group‐level z‐maps (one sample t tests against zero) were corrected at α < 0.05 at the cluster level. (a) Results without global signal regression (no‐GSR). (b) Results with GSR. Note that these significant TTV changes are negative values (namely reduction), because of the normalization against the stimulus onset (see Section 2); it thus indicates how the TTV changes relative to the baseline [Color figure can be viewed at http://wileyonlinelibrary.com]
We further examined the TTM and TTV in various functional networks (see Figure 3 for Audi and DMN as example regions; Figure 4a for network template illustration). During wakefulness, significantly increased TTM was seen in Audi, Sal, Lan, SM, and Tha without GSR. After GSR, the statistical significance was improved with a few more regions detected including positive activation in SM and deactivation in DMN, FP, and Vis (Figure 4b). During sedation, a significant increase of TTM was only seen in Audi, while significant increases of TTM were also found in Lan and SM after GSR (Figure 4b). During deep anesthesia, Audi was the only network showing significant TTM increase both with and without GSR (Figure 4b). For TTV during wakefulness, significant reduction was seen in Audi, DMN, and FP before GSR; Sal and Lan were further detected using GSR. No significant result of TTV was seen in either sedation or deep anesthesia (Figure 4c).
Figure 3.
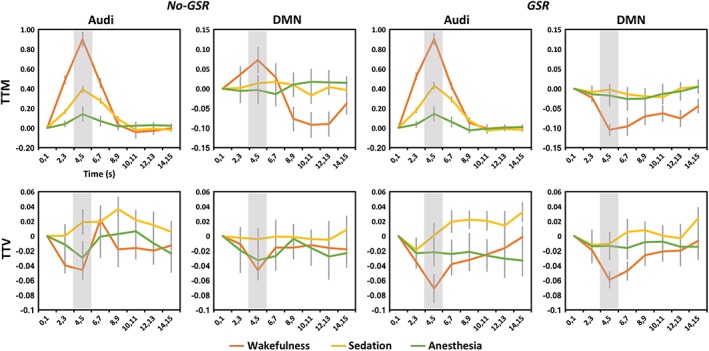
Time courses of average and variability of stimulus‐induced activity across trials within the time window after stimulus presentation (0–15 s). The results are shown for the auditory cortex (Audi) and default‐mode network (DMN). Shaded areas indicate the peak period (4–5 s) of stimulus‐induced activity, where trial‐to‐trial mean (TTM) and trial‐to‐trial variability (TTV) were calculated. Results without and with global signal regression (no‐GSR and GSR) are shown. Error bars indicate ±SEM [Color figure can be viewed at http://wileyonlinelibrary.com]
Figure 4.
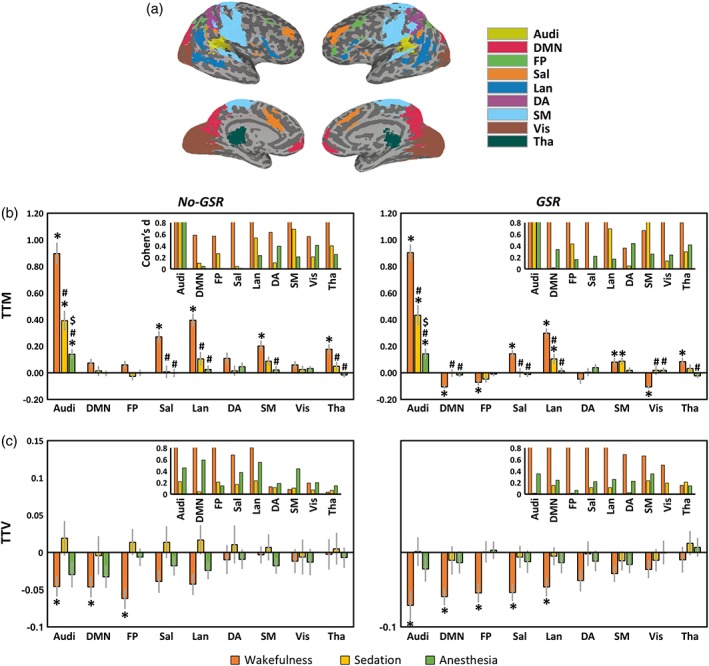
Trial‐to‐trial mean (TTM) and trial‐to‐trial variability (TTV) in various functional networks. (a) Network template includes auditory cortex (Audi), default mode network (DMN), frontoparietal (FP), salience/cingulo‐opercular (Sal), language (Lan), dorsal attention (DA), sensorimotor (SM), visual (Vis), and thalamus (Tha). (b) TTM values and statistical significances of different networks. (c) TTV values and statistical significances of different networks. Results without and with global signal regression (no‐GSR and GSR) are shown. Symbol (*) shows significant differences against zero by one‐sample t tests. Symbol (#) shows significant differences against wakefulness by paired sample t tests (i.e., sedation vs. wakefulness, and anesthesia vs. wakefulness). Symbol ($) shows significant differences against sedation by paired sample t tests (i.e., anesthesia vs. sedation). Error bars indicate ±SEM. All results were FDR corrected. The insets in (b) and (c) show the effect size (Cohen's d) for the mean differences against zero, where d = 0.2 is considered a “small” effect size, 0.5 represents a “medium” effect size and 0.8 a “large” effect size. The range limit of y‐axis is from 0 to 0.8 for illustrative purpose. Overall, all reported significant results are close to or above d = 0.8 [Color figure can be viewed at http://wileyonlinelibrary.com]
3.2. Task‐modulation of TV (task TV vs. rest TV)
We first examined the TV differences between different conditions (e.g., wakefulness vs. sedation) during the resting‐state. We found significantly decreased TV in FP and Sal during sedation, and DMN, FP, and Vis during deep anesthesia, when compared to wakefulness; no‐GSR and GSR showed similar results (Figure 5a,c). We next tested the TV differences during the task between different conditions. No TV difference was found between wakefulness and sedation, while many networks including DMN, FP, Lan, DA, and Vis, showed significant differences between wakefulness and anesthesia. The SDs of BOLD signals across trials during stimulus onset (0–1 s) and peak (4–5 s), originally used for TTV calculation, were also presented in Figure 5 as an additional support. Most importantly, we sought to examine how the task context (repeated auditory stimuli with unpredictable ITIs) modulates the TV compared with its resting‐state in different conditions. We observed significant task‐modulation of TV (task > rest) in Lan during wakefulness, and in Audi, FP, Sal, Lan during sedation before GSR (Figure 5b). Interestingly, the GSR improved the significance such that all significant networks seen during sedation came out to be significant during wakefulness (Figure 5d). Lastly, no significant task‐modulation of TV was found during deep anesthesia either with or without GSR (Figure 5b,d).
Figure 5.
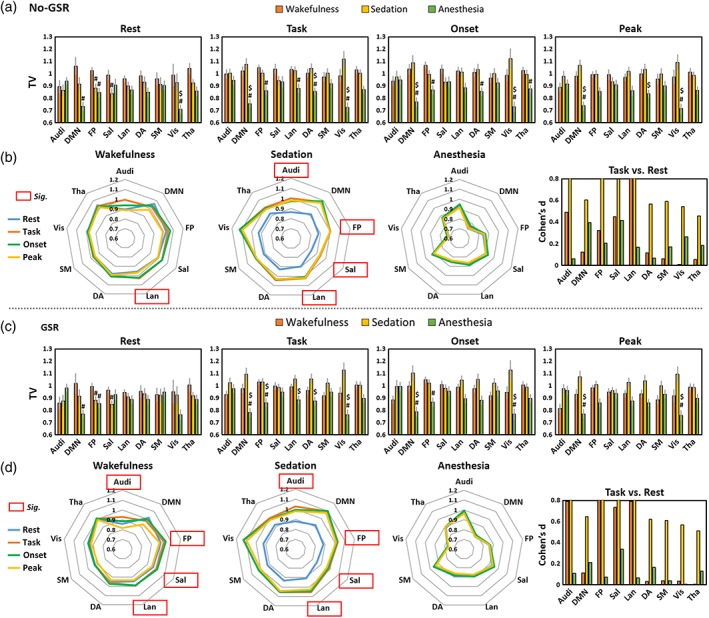
Temporal variability (TV) during resting‐state (rest), task‐state (task), as well as the SDs of BOLD signals across trials during stimulus onset (onset) and peak period (peak) originally used for TTV calculation. (a) TV without global signal regression (no‐GSR). Symbol (#) shows Significant differences against wakefulness by paired sample t tests (i.e., sedation vs. wakefulness, and anesthesia vs. wakefulness). Symbol ($) shows significant differences against sedation by paired sample t tests (i.e., anesthesia vs. sedation). Error bars indicate ±SEM. (b) A visualization of the TV (no‐GSR) in a variability “space” across brain networks to highlight the comparisons of task versus rest (task‐modulation of TV). Red frames indicate significant task‐modulation effects of TV. Results with GSR are shown in (c) and (d). All results were FDR corrected. The right panels in (b) and (d) show the effect size (Cohen's d) for task versus rest, where d = 0.2 is considered a “small” effect size, 0.5 represents a “medium” effect size, and 0.8 a “large” effect size. The range limit of y‐axis is from 0 to 0.8 for illustrative purpose. Overall, all reported significant results are close to or above d = 0.8 [Color figure can be viewed at http://wileyonlinelibrary.com]
4. DISCUSSION
We demonstrated distinct effects of propofol on the average (TTM), variability (TV) of stimulus‐induced activity, and the task modulation of TV of ongoing activity (see Table 2 for a summary). There was a graded attenuation of TTM from wakefulness through sedation to anesthesia. Importantly, the stimulus‐induced TTV reduction normally seen during wakefulness was abolished during both sedation and anesthesia. In addition, there was an increase of TV in the task state as compared to resting‐state during both wakefulness and sedation, but not anesthesia.
Table 2.
A summary of the main results with GSR
| Trial‐to‐trial mean (TTM) of stimulus‐induced activity | Trial‐to‐trial variability (TTV) of stimulus‐induced activity | Task‐modulation of temporal variability (TV) | |||||||
|---|---|---|---|---|---|---|---|---|---|
| Wakefulness | Sedation | Anesthesia | Wakefulness | Sedation | Anesthesia | Wakefulness | Sedation | Anesthesia | |
| Audi | ↑ | ↑ | ↑ | ↓ | ─ | ─ | ↑ | ↑ | ─ |
| DMN | ↓ | ─ | ─ | ↓ | ─ | ─ | ─ | ─ | ─ |
| FP | ↓ | ─ | ─ | ↓ | ─ | ─ | ↑ | ↑ | ─ |
| Sal | ↑ | ─ | ─ | ↓ | ─ | ─ | ↑ | ↑ | ─ |
| Lan | ↑ | ↑ | ─ | ↓ | ─ | ─ | ↑ | ↑ | ─ |
| DA | ─ | ─ | ─ | ─ | ─ | ─ | ─ | ─ | ─ |
| SM | ↑ | ↑ | ─ | ─ | ─ | ─ | ─ | ─ | ─ |
| Vis | ↓ | ─ | ─ | ─ | ─ | ─ | ─ | ─ | ─ |
| Tha | ↑ | ─ | ─ | ─ | ─ | ─ | ─ | ─ | ─ |
Notes. ↑ = significantly increase; ↓ = significantly decrease; ─ = no change.
4.1. Graded attenuation of TTM from wakefulness through sedation to anesthesia
We found a gradual decease of TTM in both amplitude and spatial distribution from wakefulness (widespread brain areas) through sedation (auditory cortex, language, and sensorimotor networks) to deep anesthesia (auditory cortex only). Our results are in line with earlier observations that propofol attenuates stimulus‐induced activity during auditory and noxious stimulation (Adapa, Davis, Stamatakis, Absalom, & Menon, 2014; Davis et al., 2007; DiFrancesco, Robertson, Karunanayaka, & Holland, 2013; Dueck et al., 2005; Frölich, Banks, & Ness, 2017; Liu et al., 2012; Mhuircheartaigh et al., 2010; Ní Mhuircheartaigh, Warnaby, Rogers, Jbabdi, & Tracey, 2013). These effects may be due to an overall impairment of hierarchy cortical processing and information integration (Alkire et al., 2008; Davis et al., 2007).
4.2. Disrupted TTV reduction during sedation and anesthesia
A series of neurophysiological and neuroimaging experiments have demonstrated substantial TTV reduction after stimulus onset in wakeful animals and humans (Churchland et al., 2010; He, 2013; Huang et al., 2017). Likewise, we found significant stimulus‐induced TTV reduction in various brain networks during wakefulness.
Extending the former studies, we also demonstrated that the TTV reduction was abolished by the anesthetic propofol. Previous studies showed that TTV reduction derives from a nonlinear interaction between spontaneous and stimulus‐induced activities (He, 2013; Huang et al., 2017). We thereby tentatively suggest that anesthetics may disrupt the nonlinearity of neural dynamics in response to external stimuli. Propofol is known to potentiate postsynaptic inhibition by GABAergic interneurons in the cortex, which may contribute to the breakdown of anterior–posterior cortical feedback signaling (Alkire et al., 2008; Imas et al., 2005; Lee et al., 2013). Thus, these effects may corrupt the recurrent neural circuits necessary for TTV reduction. To delineate the precise neural mechanisms underlying the anesthetic modulation of TTV reduction will require further investigation.
The variability of spontaneous neural activity can be understood to arise from a dynamic system that engages in an ongoing exploration of metastable network configurations selected from a “dynamic repertoire” (Deco et al., 2014; Deco & Hugues, 2012; Hudetz et al., 2015; Kelso, 2012; Litwin‐Kumar & Doiron, 2012; Tagliazucchi et al., 2016). Specifically, it is assumed that the network has access to a different number of stable attractors during spontaneous versus stimulus‐induced activity. During spontaneous activity, the network explores metastable configurations within a multi‐attractor regime by means of its inherent chaotic behavior. The presentation of stimulus reduces the set of available attractors by eliminating the transition to other attractors, resulting in a net decrease in neural variability across trials (Deco & Hugues, 2012). The lack of TTV reduction during sedation and anesthesia may reflect the reduced capacity of the dynamical system to access or stabilize network states and form specific attractors in response to external stimuli.
4.3. Reduced resting‐state TV but preserved task‐modulation of TV during sedation
We observed a decrease of resting‐state TV in frontoparietal networks during sedation, with a further decrease of TV in both frontoparietal and DMN regions during deep anesthesia. This observation is in line with our prior finding that resting‐state TV was closely related to the level of consciousness (Huang, Dai, et al., 2014; Huang, Wang, et al., 2014; Huang et al., 2016; Zhang et al., 2018); further supported by a recent fMRI study in rats (Baria et al., 2018). The reduction of resting‐state TV is compatible with former studies suggesting a decrease of the brain's dynamic repertoire during anesthesia, sleep, and unresponsive wakefulness (Barttfeld, Uhrig, Sitt, Sigman, & Jarraya, 2015; Chennu et al., 2014; Hudetz et al., 2015; King & Dehaene, 2014; Sarasso et al., 2015; Tagliazucchi et al., 2016). However, the exact linkage between the reduced TV of fMRI‐BOLD signals and the reduced TV of dynamic functional connectivity patterns (the dynamic repertoire) during altered states of consciousness remains to be determined.
Interestingly, we found significant task‐modulation of TV (task > rest) in auditory cortex and higher‐order cortical regions (frontoparietal, salience, and language networks) during both wakefulness and sedation, whereas no such modulation was found during deep anesthesia. The increase of TV during task may indicate that the neural system increased its dynamic range upon cognitive demand. One could envision that the wider dynamic range would provide a larger region of neuronal activity space to accommodate greater stimulus uncertainty as compared to the resting‐state in which cognitive demand is lower due to less stimulus uncertainty. Thus, the task‐related TV increase may be the sign of an adaptive behavior of the neural system engaged in enhancing its efficiency and cognitive performance (Garrett, Kovacevic, et al., 2013; Garrett, Samanez‐Larkin, et al., 2013).
In summary, the higher TV in task‐state versus resting‐state during sedation suggests that the relevant brain regions preserved their responsiveness and adaptability in terms of their capacity to augment the dynamic range of ongoing activity, presumably to accommodate the external stimulus' demand. In contrast, during anesthesia, brain activity appeared isolated from the external environment such that the cortical activity space was dramatically shrunk, almost unresponsive to stimuli, with TTV reduction and task‐modulation of TV both abolished.
5. CONCLUSIONS
Our results reveal distinct effects of propofol on the two forms of neural variability—TTV and TV. They imply that the anesthetic disrupts recurrent network dynamics, preventing the stabilization of cortical activity states. These findings shed new light on the temporal dynamics of neuronal variability and its alteration during anesthetic‐induced unconsciousness.
5.1. Comments on GSR
We presented and compared the results both with and without GSR to ensure our results are not artifactually driven by the fMRI global signal itself (Murphy & Fox, 2017). Overall, GSR improved the significance for all measurements while did not affect our general conclusion. Specifically, more regions were detected with significant TTV reduction after GSR during wakefulness, for both whole brain analysis (Figure 2b) and network analysis (the right panel in Figure 4c). In addition, more networks showed significant task modulation of TV after GSR during wakefulness (Figure 5d) comparing to the results without GSR (Figure 5b). These improvements may due to the benefit of GSR by further removing nonneuronal sources of global variance such as respiration and movement (Power et al., 2014; Yan, Craddock, Zuo, Zang, & Milham, 2013). Note that the above improvements did change the sign (positive or negative) of TTV and TV values. However, we did find the GSR changes the sign for TTM values that several brain regions/networks became “deactivated” (Figure 1b and the right panel in Figure 4b). The question on whether these regions were truly deactivated in response to stimuli may be analogous to asking if there exists true negative correlations (anticorrelations) during resting‐state in the context of GSR. This, however, is still under debate (Murphy & Fox, 2017). We would tentatively suggest that the deactivations of TTM may be relative values against the global signal; it would be otherwise considered to be true deactivations if we could observe them for both GSR and no‐GSR. Taking a step back, if we assume that the apparent deactivations have some functional significance (albeit unknown at this point), then the fact that no such deactivation was seen in either sedation or anesthesia may point to another dysfunction induced by propofol anesthetics that warrants future investigations.
5.2. Limitations
Several limitations of our study need to be considered:
We here used a passive name listening paradigm instead of goal‐directed tasks (visual stimulus detection or semantic judgments) requiring button responses as previous fMRI reported (He, 2013; Huang et al., 2017). This was due to the consideration that the subjects were unable to make explicit motor response during anesthesia; it would thus be otherwise incomparable between different conditions (e.g., with motor response during wakefulness vs. without motor response during anesthesia). It is noteworthy that the evidence of TTV reduction from previous studies was not solely drawn from goal‐directed tasks. For instance, neuronal TTV reduction was seen in wakeful rats during passive visual stimulation (e.g., white‐black flashing) (White et al., 2012), as well as in monkeys and cats during presenting visual sine‐wave gratings (Churchland et al., 2010). Therefore, the TTV reduction through a presumed active noise suppression mechanism (White et al., 2012) may not be necessarily associated with active behavioral response (e.g., goal‐directed).
We did not observe widespread TTV reduction across the entire cortex as previously shown (He, 2013; Huang et al., 2017). This may be due to the simplicity of the task with lower cognitive load and task demands, as well as a relatively lower number of trials in a sparse‐event related design within limited clinical fMRI scanning time.
Churchland et al. (2010) reported a TTV reduction of the stimulus‐induced neuronal activity in many cortical areas regardless of whether the animal is anesthetized or awake. However, both our data in humans and a previous study in rats (White et al., 2012) showed that the TTV reduction was not maintained under anesthetized states. It remains an open question about which of the observations are closer to the physiological reality, and/or to what extent the TTV reduction depends upon tasks, modalities (visual, auditory, tactile, etc.), attentional, and conscious states.
It remains to be determined if our results can be generalized to other classes of general anesthetics, including halogenated ethers such as sevoflurane or non‐GABAergic drugs such as ketamine. Therefore, future investigation of both forms of neural variability in those drugs where consciousness is lost is necessary to flesh out the full scientific and clinical implications of our findings.
ACKNOWLEDGMENTS
This study was supported by Medical Guidance Supporting Project from Shanghai Municipal Science and Technology Committee (No. 17411961400 to Jun Zhang), grants of the National Institute of General Medical Sciences of the National Institutes of Health (R01‐GM103894 to Anthony G. Hudetz), EJLB‐Michael Smith Foundation, Canada Institute of Health Research (CIHR), Hope of Depression Foundation (HDRF), and National Natural Science Foundation of China (No. 31271195 to Georg Northoff). We declare no conflict of interest for all authors.
Huang Z, Zhang J, Wu J, et al. Disrupted neural variability during propofol‐induced sedation and unconsciousness. Hum Brain Mapp. 2018;39:4533–4544. 10.1002/hbm.24304
Huang and Zhang contributed equally to this study.
Funding information Canada Institute of Health Research (CIHR); Hope of Depression Foundation (HDRF); Medical Guidance Supporting Project , Grant/ Award Number: 17411961400; National Natural Science Foundation of China, Grant/ Award Number: 31271195; EJLB‐Michael Smith Foundation; National Institute of General Medical Sciences of the National Institutes of Health, Grant/Award Number: R01‐GM103894; Shanghai Municipal Science and Technology Committee, Grant/Award Number: 17411961400
Contributor Information
Zirui Huang, Email: huangzu@umich.edu.
Jinsong Wu, Email: wjsongc@126.com.
REFERENCES
- Adapa, R. M. , Davis, M. H. , Stamatakis, E. A. , Absalom, A. R. , & Menon, D. K. (2014). Neural correlates of successful semantic processing during propofol sedation. Human Brain Mapping, 35, 2935–2949. 10.1002/hbm.22375 [DOI] [PMC free article] [PubMed] [Google Scholar]
- Alkire, M. T. , Hudetz, A. G. , & Tononi, G. (2008). Consciousness and anesthesia. Science, 322, 876–880. [DOI] [PMC free article] [PubMed] [Google Scholar]
- Arazi, A. , Gonen‐Yaacovi, G. , & Dinstein, I. (2017). The magnitude of trial‐by‐trial neural variability is reproducible over time and across tasks in humans. eNeuro, ENEURO.0292‐17. [DOI] [PMC free article] [PubMed] [Google Scholar]
- Arieli, A. , Sterkin, A. , Grinvald, A. , & Aertsen, A. (1996). Dynamics of ongoing activity: Explanation of the large variability in evoked cortical responses. Science, 273, 1868–1871. [DOI] [PubMed] [Google Scholar]
- Azouz, R. , & Gray, C. M. (1999). Cellular mechanisms contributing to response variability of cortical neurons in vivo. The Journal of Neuroscience, 19, 2209–2223. [DOI] [PMC free article] [PubMed] [Google Scholar]
- Baria, A. T. , Centeno, M. V. , Ghantous, M. E. , Chang, P. C. , Procissi, D. , & Apkarian, A. V. (2018). BOLD temporal variability differentiates wakefulness from anesthesia‐induced unconsciousness. Journal of Neurophysiology, 119, 834–848. [DOI] [PMC free article] [PubMed] [Google Scholar]
- Baria, A. T. , Maniscalco, B. , & He, B. J. (2017). Initial‐state‐dependent, robust, transient neural dynamics encode conscious visual perception. PLOS Computational Biology, 13, e1005806 Ed. Ole Jensen. [DOI] [PMC free article] [PubMed] [Google Scholar]
- Barttfeld, P. , Uhrig, L. , Sitt, J. D. , Sigman, M. , & Jarraya, B. (2015). Signature of consciousness in the dynamics of resting‐state brain activity. Proceedings of the National Academy of Sciences of the United States of America, 112, E5219–E5220. 10.1073/pnas.1515029112 [DOI] [PMC free article] [PubMed] [Google Scholar]
- Becker, R. , Reinacher, M. , Freyer, F. , Villringer, A. , & Ritter, P. (2011). How ongoing neuronal oscillations account for evoked fMRI variability. The Journal of Neuroscience, 31, 11016–11027. [DOI] [PMC free article] [PubMed] [Google Scholar]
- Boly, M. , Garrido, M. I. , Gosseries, O. , Bruno, M.‐A. , Boveroux, P. , Schnakers, C. , … Friston, K. (2011). Preserved feedforward but impaired top‐down processes in the vegetative state. Science, 332, 858–862. [DOI] [PubMed] [Google Scholar]
- Brown, E. N. , Purdon, P. L. , & Van Dort, C. J. (2011). General anesthesia and altered states of arousal: A systems neuroscience analysis. Annual Review of Neuroscience 34:601–628. [DOI] [PMC free article] [PubMed] [Google Scholar]
- Chai, X. J. , Castañán, A. N. , Öngür, D. , & Whitfield‐Gabrieli, S. (2012). Anticorrelations in resting state networks without global signal regression. NeuroImage, 59, 1420–1428. [DOI] [PMC free article] [PubMed] [Google Scholar]
- Chang, M. H. , Armstrong, K. M. , & Moore, T. (2012). Dissociation of response variability from firing rate effects in frontal eye field neurons during visual stimulation, working memory, and attention. The Journal of Neuroscience, 32, 2204–2216. [DOI] [PMC free article] [PubMed] [Google Scholar]
- Chennu, S. , Finoia, P. , Kamau, E. , Allanson, J. , Williams, G. B. , Monti, M. M. , … Bekinschtein, T. A. (2014). Spectral signatures of reorganised brain networks in disorders of consciousness. PLoS Computational Biology, 10, e1003887 Ed. Bard Ermentrout. [DOI] [PMC free article] [PubMed] [Google Scholar]
- Churchland, M. M. , Yu, B. M. , Cunningham, J. P. , Sugrue, L. P. , Cohen, M. R. , Corrado, G. S. , … Shenoy, K. V. (2010). Stimulus onset quenches neural variability: A widespread cortical phenomenon. Nature Neuroscience, 13, 369–378. [DOI] [PMC free article] [PubMed] [Google Scholar]
- Cox, R. W. , Chen, G. , Glen, D. R. , Reynolds, R. C. , & Taylor, P. A. (2017). FMRI clustering in AFNI: False‐positive rates Redux. Brain Connectivity, 7, 152–171. [DOI] [PMC free article] [PubMed] [Google Scholar]
- Dai, R. , Huang, Z. , Tu, H. , Wang, L. , Tanabe, S. , Weng, X. , … Li, D. (2016). Interplay between heightened temporal variability of spontaneous brain activity and task‐evoked hyperactivation in the blind. Frontiers in Human Neuroscience, 10, 632. [DOI] [PMC free article] [PubMed] [Google Scholar]
- Davis, M. H. , Coleman, M. R. , Absalom, A. R. , Rodd, J. M. , Johnsrude, I. S. , Matta, B. F. , … Menon, D. K. (2007). Dissociating speech perception and comprehension at reduced levels of awareness. Proceedings of the National Academy of Sciences of the United States of America, 104, 16032–16037. [DOI] [PMC free article] [PubMed] [Google Scholar]
- Deco, G. , & Hugues, E. (2012). Neural network mechanisms underlying stimulus driven variability reduction. PLoS Computational Biology, 8, e1002395 Ed. Tim Behrens. [DOI] [PMC free article] [PubMed] [Google Scholar]
- Deco, G. , McIntosh, A. R. , Shen, K. , Hutchison, R. M. , Menon, R. S. , Everling, S. , … Jirsa, V. K. (2014). Identification of optimal structural connectivity using functional connectivity and neural modeling. The Journal of Neuroscience, 34, 7910–7916. [DOI] [PMC free article] [PubMed] [Google Scholar]
- DiFrancesco, M. W. , Robertson, S. A. , Karunanayaka, P. , & Holland, S. K. (2013). BOLD fMRI in infants under sedation: Comparing the impact of pentobarbital and propofol on auditory and language activation. Journal of Magnetic Resonance Imaging, 38, 1184–1195. [DOI] [PMC free article] [PubMed] [Google Scholar]
- Dueck, M. H. , Petzke, F. , Gerbershagen, H. J. , Paul, M. , Hesselmann, V. , Girnus, R. , … Boerner, U. (2005). Propofol attenuates responses of the auditory cortex to acoustic stimulation in a dose‐dependent manner: A FMRI study. Acta Anaesthesiologica Scandinavica, 49, 784–791. [DOI] [PubMed] [Google Scholar]
- Faisal, A. A. , Selen, L. P. J. , & Wolpert, D. M. (2008). Noise in the nervous system. Nature Reviews. Neuroscience, 9, 292–303. [DOI] [PMC free article] [PubMed] [Google Scholar]
- Ferri, F. , Costantini, M. , Huang, Z. , Perrucci, M. G. , Ferretti, A. , Romani, G. L. , & Northoff, G. (2015). Intertrial variability in the premotor cortex accounts for individual differences in peripersonal space. The Journal of Neuroscience, 35, 16328–16339. [DOI] [PMC free article] [PubMed] [Google Scholar]
- Finn, I. M. , Priebe, N. J. , & Ferster, D. (2007). The emergence of contrast‐invariant orientation tuning in simple cells of cat visual cortex. Neuron, 54, 137–152. [DOI] [PMC free article] [PubMed] [Google Scholar]
- Fox, M. D. , Snyder, A. Z. , Vincent, J. L. , Corbetta, M. , Van Essen, D. C. , & Raichle, M. E. (2005). The human brain is intrinsically organized into dynamic, anticorrelated functional networks. Proceedings of the National Academy of Sciences of the United States of America 102:9673–9678. [DOI] [PMC free article] [PubMed] [Google Scholar]
- Fox, M. D. , Snyder, A. Z. , Zacks, J. M. , & Raichle, M. E. (2006). Coherent spontaneous activity accounts for trial‐to‐trial variability in human evoked brain responses. Nature Neuroscience, 9, 23–25. [DOI] [PubMed] [Google Scholar]
- Franks, N. P. (2008). General anaesthesia: From molecular targets to neuronal pathways of sleep and arousal. Nature Reviews. Neuroscience, 9, 370–386. [DOI] [PubMed] [Google Scholar]
- Frölich, M. A. , Banks, C. , & Ness, T. J. (2017). The effect of sedation on cortical activation: A randomized study comparing the effects of sedation with midazolam, propofol, and dexmedetomidine on auditory processing. Anesthesia and Analgesia, 124, 1603–1610. [DOI] [PMC free article] [PubMed] [Google Scholar]
- Garrett, D. D. , Kovacevic, N. , McIntosh, A. R. , & Grady, C. L. (2010). Blood oxygen level‐dependent signal variability is more than just noise. The Journal of Neuroscience, 30, 4914–4921. [DOI] [PMC free article] [PubMed] [Google Scholar]
- Garrett, D. D. , Kovacevic, N. , McIntosh, A. R. , & Grady, C. L. (2011). The importance of being variable. The Journal of Neuroscience, 31, 4496–4503. [DOI] [PMC free article] [PubMed] [Google Scholar]
- Garrett, D. D. , Kovacevic, N. , McIntosh, A. R. , & Grady, C. L. (2013). The modulation of BOLD variability between cognitive states varies by age and processing speed. Cerebral Cortex, 23, 684–693. [DOI] [PMC free article] [PubMed] [Google Scholar]
- Garrett, D. D. , McIntosh, A. R. , & Grady, C. L. (2011). Moment‐to‐moment signal variability in the human brain can inform models of stochastic facilitation now. Nature Reviews. Neuroscience, 12, 612. [DOI] [PubMed] [Google Scholar]
- Garrett, D. D. , Samanez‐Larkin, G. R. , MacDonald, S. W. S. , Lindenberger, U. , McIntosh, A. R. , & Grady, C. L. (2013). Moment‐to‐moment brain signal variability: A next frontier in human brain mapping? Neuroscience and Biobehavioral Reviews, 37, 610–624. [DOI] [PMC free article] [PubMed] [Google Scholar]
- He, B. J. (2011). Scale‐free properties of the functional magnetic resonance imaging signal during rest and task. The Journal of Neuroscience, 31, 13786–13795. [DOI] [PMC free article] [PubMed] [Google Scholar]
- He, B. J. (2013). Spontaneous and task‐evoked brain activity negatively interact. The Journal of Neuroscience, 33, 4672–4682. [DOI] [PMC free article] [PubMed] [Google Scholar]
- He, B. J. , & Zempel, J. M. (2013). Average is optimal: An inverted‐U relationship between trial‐to‐trial brain activity and behavioral performance. PLoS Computational Biology, 9, e1003348Ed. Olaf Sporns. 10.1371/journal.pcbi.1003348 [DOI] [PMC free article] [PubMed] [Google Scholar]
- Huang, Z. , Dai, R. , Wu, X. , Yang, Z. , Liu, D. , Hu, J. , … Northoff, G. (2014). The self and its resting state in consciousness: An investigation of the vegetative state. Human Brain Mapping, 35, 1997–2008. 10.1002/hbm.22308 [DOI] [PMC free article] [PubMed] [Google Scholar]
- Huang, Z. , Liu, X. , Mashour, G. A. , & Hudetz, A. G. (2018). Timescales of intrinsic BOLD signal dynamics and functional connectivity in pharmacologic and neuropathologic states of unconsciousness. The Journal of Neuroscience, 38, 2304–2317. [DOI] [PMC free article] [PubMed] [Google Scholar]
- Huang, Z. , Wang, Z. , Zhang, J. , Dai, R. , Wu, J. , Li, Y. , … Northoff, G. (2014). Altered temporal variance and neural synchronization of spontaneous brain activity in anesthesia. Human Brain Mapping, 35, 5368–5378. 10.1002/hbm.22556 [DOI] [PMC free article] [PubMed] [Google Scholar]
- Huang, Z. , Zhang, J. , Longtin, A. , Dumont, G. , Duncan, N. W. , Pokorny, J. , … Northoff, G. (2017). Is there a nonadditive interaction between spontaneous and evoked activity? Phase‐dependence and its relation to the temporal structure of scale‐free brain activity. Cerebral Cortex, 27, 1037–1059. [DOI] [PubMed] [Google Scholar]
- Huang, Z. , Zhang, J. , Wu, J. , Qin, P. , Wu, X. , Wang, Z. , … Northoff, G. (2016). Decoupled temporal variability and signal synchronization of spontaneous brain activity in loss of consciousness: An fMRI study in anesthesia. NeuroImage, 124, 693–703. [DOI] [PubMed] [Google Scholar]
- Hudetz, A. G. , Liu, X. , & Pillay, S. (2015). Dynamic repertoire of intrinsic brain states is reduced in propofol‐induced unconsciousness. Brain Connectivity, 5, 10–22. [DOI] [PMC free article] [PubMed] [Google Scholar]
- Imas, O. A. , Ropella, K. M. , Ward, B. D. , Wood, J. D. , & Hudetz, A. G. (2005). Volatile anesthetics disrupt frontal‐posterior recurrent information transfer at gamma frequencies in rat. Neuroscience Letters, 387, 145–150. [DOI] [PubMed] [Google Scholar]
- Kelso, J. A. S. (2012). Multistability and metastability: Understanding dynamic coordination in the brain. Philosophical Transactions of the Royal Society of London. Series B, Biological Sciences, 367, 906–918. 10.1098/rstb.2011.0351 [DOI] [PMC free article] [PubMed] [Google Scholar]
- King, J.‐R. , & Dehaene, S. (2014). Characterizing the dynamics of mental representations: The temporal generalization method. Trends in Cognitive Sciences, 18, 203–210. [DOI] [PMC free article] [PubMed] [Google Scholar]
- Lamme, V. A. , & Roelfsema, P. R. (2000). The distinct modes of vision offered by feedforward and recurrent processing. Trends in Neurosciences, 23, 571–579. [DOI] [PubMed] [Google Scholar]
- Lee, U. , Ku, S. , Noh, G. , Baek, S. , Choi, B. , & Mashour, G. a. (2013). Disruption of frontal‐parietal communication by ketamine, propofol, and sevoflurane. Anesthesiology, 118, 1264–1275. [DOI] [PMC free article] [PubMed] [Google Scholar]
- Lipsman, N. , Nakao, T. , Kanayama, N. , Krauss, J. K. , Anderson, A. , Giacobbe, P. , … Northoff, G. (2014). Neural overlap between resting state and self‐relevant activity in human subcallosal cingulate cortex – Single unit recording in an intracranial study. Cortex, 60, 139–144. [DOI] [PubMed] [Google Scholar]
- Litwin‐Kumar, A. , & Doiron, B. (2012). Slow dynamics and high variability in balanced cortical networks with clustered connections. Nature Neuroscience, 15, 1498–1505. [DOI] [PMC free article] [PubMed] [Google Scholar]
- Liu, X. , Lauer, K. K. , Ward, B. D. , Rao, S. M. , Li, S. J. , & Hudetz, A. G. (2012). Propofol disrupts functional interactions between sensory and high‐order processing of auditory verbal memory. Human Brain Mapping, 33, 2487–2498. [DOI] [PMC free article] [PubMed] [Google Scholar]
- Marsh, B. , Morton, N. , & Kenny, G. N. C. (1991). Pharmacokinetic model driven infusion of propofol in children. British Journal of Anaesthesia, 67, 41–48. [DOI] [PubMed] [Google Scholar]
- Mashour, G. A. (2014). Top‐down mechanisms of anesthetic‐induced unconsciousness. Frontiers in Systems Neuroscience, 8, 115. [DOI] [PMC free article] [PubMed] [Google Scholar]
- Mashour, G. A. , & Hudetz, A. G. (2018). Neural correlates of unconsciousness in large‐scale brain networks. Trends in Neurosciences, 41, 150–160. [DOI] [PMC free article] [PubMed] [Google Scholar]
- Mazzucato, L. , Fontanini, A. , & La Camera, G. (2015). Dynamics of multistable states during ongoing and evoked cortical activity. The Journal of Neuroscience 35:8214–8231. [DOI] [PMC free article] [PubMed] [Google Scholar]
- McIntosh, A. R. , Kovacevic, N. , & Itier, R. J. (2008). Increased brain signal variability accompanies lower behavioral variability in development. PLoS Computational Biology, 4, e1000106 Ed. Karl J. Friston. [DOI] [PMC free article] [PubMed] [Google Scholar]
- McIntosh, A. R. , Kovacevic, N. , Lippe, S. , Garrett, D. , Grady, C. , & Jirsa, V. (2010). The development of a noisy brain. Archives Italiennes de Biologie, 148, 323–337. [PubMed] [Google Scholar]
- Mhuircheartaigh, R. N. , Rosenorn‐Lanng, D. , Wise, R. , Jbabdi, S. , Rogers, R. , & Tracey, I. (2010). Cortical and subcortical connectivity changes during decreasing levels of consciousness in humans: A functional magnetic resonance imaging study using propofol. The Journal of Neuroscience, 30, 9095–9102. [DOI] [PMC free article] [PubMed] [Google Scholar]
- Mišić, B. , Vakorin, V. A. , Paus, T. , & McIntosh, A. R. (2011). Functional embedding predicts the variability of neural activity. Frontiers in Systems Neuroscience, 5, 90. [DOI] [PMC free article] [PubMed] [Google Scholar]
- Monier, C. , Chavane, F. , Baudot, P. , Graham, L. J. , & Frégnac, Y. (2003). Orientation and direction selectivity of synaptic inputs in visual cortical neurons: A diversity of combinations produces spike tuning. Neuron, 37, 663–680. [DOI] [PubMed] [Google Scholar]
- Moutard, C. , Dehaene, S. , & Malach, R. (2015). Spontaneous fluctuations and non‐linear ignitions: Two dynamic faces of cortical recurrent loops. Neuron, 88, 194–206. [DOI] [PubMed] [Google Scholar]
- Murphy, K. , Birn, R. M. , Handwerker, D. A. , Jones, T. B. , & Bandettini, P. A. (2009). The impact of global signal regression on resting state correlations: Are anti‐correlated networks introduced? NeuroImage, 44, 893–905. [DOI] [PMC free article] [PubMed] [Google Scholar]
- Murphy, K. , & Fox, M. D. (2017). Towards a consensus regarding global signal regression for resting state functional connectivity MRI. NeuroImage, 154, 169–173. [DOI] [PMC free article] [PubMed] [Google Scholar]
- Ní Mhuircheartaigh, R. , Warnaby, C. , Rogers, R. , Jbabdi, S. , & Tracey, I. (2013). Slow‐wave activity saturation and thalamocortical isolation during propofol anesthesia in humans. Science Translational Medicine, 5, 208ra148. [DOI] [PubMed] [Google Scholar]
- Nogueira, R. , Lawrie, S. , & Moreno‐Bote, R. (2018). Neuronal variability as a proxy for network state. Trends in Neurosciences, 41, 170–173. [DOI] [PubMed] [Google Scholar]
- Ponce‐Alvarez, A. , He, B. J. , Hagmann, P. , & Deco, G. (2015). Task‐driven activity reduces the cortical activity space of the brain: Experiment and whole‐brain modeling. PLOS Computational Biology, 11, e1004445 Ed. Lyle J. Graham. [DOI] [PMC free article] [PubMed] [Google Scholar]
- Power, J. D. , Barnes, K. A. , Snyder, A. Z. , Schlaggar, B. L. , & Petersen, S. E. (2012). Spurious but systematic correlations in functional connectivity MRI networks arise from subject motion. NeuroImage, 59, 2142–2154. [DOI] [PMC free article] [PubMed] [Google Scholar]
- Power, J. D. , Mitra, A. , Laumann, T. O. , Snyder, A. Z. , Schlaggar, B. L. , & Petersen, S. E. (2014). Methods to detect, characterize, and remove motion artifact in resting state fMRI. NeuroImage, 84, 320–341. [DOI] [PMC free article] [PubMed] [Google Scholar]
- Qin, P. , Liu, Y. , Shi, J. , Wang, Y. , Duncan, N. , Gong, Q. , … Northoff, G. (2012). Dissociation between anterior and posterior cortical regions during self‐specificity and familiarity: A combined fMRI‐meta‐analytic study. Human Brain Mapping, 33, 154–164. [DOI] [PMC free article] [PubMed] [Google Scholar]
- Rajan, K. , Abbott, L. F. , & Sompolinsky, H. (2010). Stimulus‐dependent suppression of chaos in recurrent neural networks. Physical Review E, 82, 11903. [DOI] [PMC free article] [PubMed] [Google Scholar]
- Ramsay, M. A. , Savege, T. M. , Simpson, B. R. , & Goodwin, R. (1974). Controlled sedation with alphaxalone‐alphadolone. British Medical Journal, 2, 656–659. [DOI] [PMC free article] [PubMed] [Google Scholar]
- Saad, Z. S. , Gotts, S. J. , Murphy, K. , Chen, G. , Jo, H. J. , Martin, A. , & Cox, R. W. (2012). Trouble at rest: How correlation patterns and group differences become distorted after global signal regression. Brain Connectivity, 2, 25–32. [DOI] [PMC free article] [PubMed] [Google Scholar]
- Sarasso, S. , Boly, M. , Napolitani, M. , Gosseries, O. , Charland‐Verville, V. , Casarotto, S. , … Massimini, M. (2015). Consciousness and complexity during unresponsiveness induced by propofol, xenon, and ketamine. Current Biology, 25, 3099–3105. [DOI] [PubMed] [Google Scholar]
- Scaglione, A. , Moxon, K. A. , Aguilar, J. , & Foffani, G. (2011). Trial‐to‐trial variability in the responses of neurons carries information about stimulus location in the rat whisker thalamus. Proceedings of the National Academy of Sciences of the United States of America, 108, 14956–14961. 10.1073/pnas.1103168108 [DOI] [PMC free article] [PubMed] [Google Scholar]
- Schurger, A. , Sarigiannidis, I. , Naccache, L. , Sitt, J. D. , & Dehaene, S. (2015). Cortical activity is more stable when sensory stimuli are consciously perceived. Proceedings of the National Academy of Sciences of the United States of America, 112, E2083–E2092. [DOI] [PMC free article] [PubMed] [Google Scholar]
- Shew, W. L. , Yang, H. , Petermann, T. , Roy, R. , & Plenz, D. (2009). Neuronal avalanches imply maximum dynamic range in cortical networks at criticality. The Journal of Neuroscience, 29, 15595–15600. [DOI] [PMC free article] [PubMed] [Google Scholar]
- Stephens, G. J. , Honey, C. J. , & Hasson, U. (2013). A place for time: The spatiotemporal structure of neural dynamics during natural audition. Journal of Neurophysiology, 110, 2019–2026. [DOI] [PMC free article] [PubMed] [Google Scholar]
- Sussillo, D. , & Abbott, L. F. (2009). Generating coherent patterns of activity from chaotic neural networks. Neuron, 63, 544–557. [DOI] [PMC free article] [PubMed] [Google Scholar]
- Tagliazucchi, E. , Chialvo, D. R. , Siniatchkin, M. , Brichant, J. , & Laureys, S. (2016). Large‐scale signatures of unconsciousness are consistent with a departure from critical dynamics. Journal of the Royal Society, Interface, 13, 1–34. [DOI] [PMC free article] [PubMed] [Google Scholar]
- Tononi, G. , Boly, M. , Massimini, M. , & Koch, C. (2016). Integrated information theory: From consciousness to its physical substrate. Nature Reviews. Neuroscience, 17, 450–461. 10.1038/nrn.2016.44/nhttp://www.ncbi.nlm.nih.gov/pubmed/27225071 [DOI] [PubMed] [Google Scholar]
- Tononi, G. , & Edelman, G. M. (1998). Consciousness and complexity. Science, 282, 1846–1851. [DOI] [PubMed] [Google Scholar]
- Vakorin, V. A. , Lippe, S. , & McIntosh, A. R. (2011). Variability of brain signals processed locally transforms into higher connectivity with brain development. The Journal of Neuroscience, 31, 6405–6413. [DOI] [PMC free article] [PubMed] [Google Scholar]
- Vakorin, V. A. , Mišić, B. , Krakovska, O. , & McIntosh, A. R. (2011). Empirical and theoretical aspects of generation and transfer of information in a neuromagnetic source network. Frontiers in Systems Neuroscience, 5, 96. [DOI] [PMC free article] [PubMed] [Google Scholar]
- van Dijk, K. R. A. , Sabuncu, M. R. , & Buckner, R. L. (2012). The influence of head motion on intrinsic functional connectivity MRI. NeuroImage, 59, 431–438. [DOI] [PMC free article] [PubMed] [Google Scholar]
- White, B. , Abbott, L. F. , & Fiser, J. (2012). Suppression of cortical neural variability is stimulus‐ and state‐dependent. Journal of Neurophysiology, 108, 2383–2392. 10.1152/jn.00723.2011 [DOI] [PMC free article] [PubMed] [Google Scholar]
- Xu, Z. , Liu, F. , Yue, Y. , Ye, T. , Zhang, B. , Zuo, M. , … Che, X. (2009). C50 for propofol‐remifentanil target‐controlled infusion and bispectral index at loss of consciousness and response to painful stimulus in Chinese patients: A multicenter clinical trial. Anesthesia and Analgesia, 108, 478–483. [DOI] [PubMed] [Google Scholar]
- Xue, G. , Dong, Q. , Chen, C. , Lu, Z. , Mumford, J. A. , & Poldrack, R. A. (2010). Greater neural pattern similarity across repetitions is associated with better memory. Science, 330, 97–101. [DOI] [PMC free article] [PubMed] [Google Scholar]
- Yan, C.‐G. , Craddock, R. C. , Zuo, X.‐N. , Zang, Y.‐F. , & Milham, M. P. (2013). Standardizing the intrinsic brain: Towards robust measurement of inter‐individual variation in 1000 functional connectomes. NeuroImage, 80, 246–262. [DOI] [PMC free article] [PubMed] [Google Scholar]
- Zang, Y. F. , He, Y. , Zhu, C. Z. , Cao, Q. J. , Sui, M. Q. , Liang, M. , … Wang, Y. F. (2007). Altered baseline brain activity in children with ADHD revealed by resting‐state functional MRI. Brain & Development, 29, 83–91. [DOI] [PubMed] [Google Scholar]
- Zhang, J. , Huang, Z. , Chen, Y. , Zhang, J. , Ghinda, D. , Nikolova, Y. , … Northoff, G. (2018). Breakdown in the temporal and spatial organization of spontaneous brain activity during general anesthesia. Human Brain Mapping, 39, 2035–2046. [DOI] [PMC free article] [PubMed] [Google Scholar]