Abstract
Cyanuric acid is present in drinking water when chemicals commonly referred to as dichlor (anhydrous sodium dichloroisocyanurate or sodium dichloroisocyanurate dihydrate) or trichlor (trichloroisocyanuric acid) are used as alternative free chlorine sources. Cyanuric acid and its ionization products combine with hypochlorous acid, forming various chlorinated cyanurates through a series of equilibrium reactions. Methods to measure the free chlorine (hypochlorous acid plus hypochlorite ion) concentration in systems adding cyanuric acid exhibit measurement bias. To overcome this limitation, one option is use of the established water chemistry of the free chlorine and cyanuric acid system to estimate free chlorine concentrations. Unfortunately, the equilibrium water chemistry has only been determined for 25 °C, limiting the usefulness of the water chemistry estimate in actual drinking water systems where temperatures may vary over a wide range (e.g., 5 to 35 °C). As a first step in extending the water chemistry model to relevant drinking water temperatures, the first acid ionization constant (K6) for cyanuric acid (H3Cy) and its first ionization product (H2Cy–) was determined using spectrophotometric techniques from 5 to 35 °C where or and ΔH° = 33.4 ± 1.7 kJ mol–1. As an example of temperature’s impact (pH 7), the H2Cy– fraction of total cyanurate (sum of H3Cy and H2Cy–) effectively doubles from 5 to 35 °C. With K6’s temperature dependence established, studies can be conducted to update the existing water chemistry model with temperature dependence, allowing free chlorine concentration simulation in drinking water systems with cyanuric acid present.
INTRODUCTION
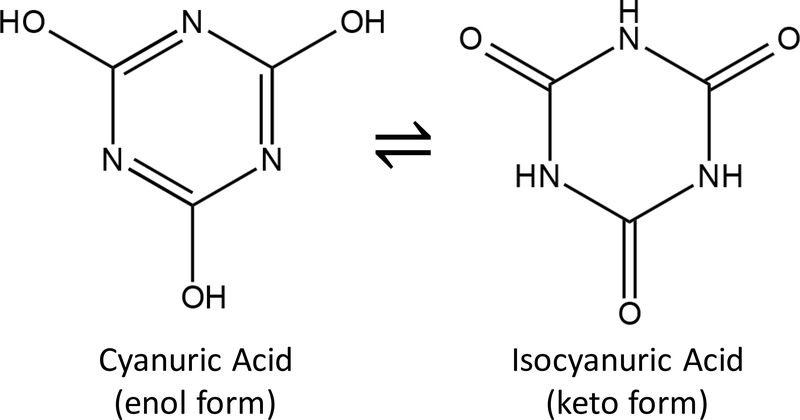
Cyanuric acid (Figure 1) and its dissociation products are present in drinking water when chemicals commonly referred to as dichlor (anhydrous sodium dichloroisocyanurate or sodium dichloroisocyanurate dihydrate) or trichlor (trichloroisocyanuric acid) are used as alternative free chlorine (hypochlorous acid, HOCl, plus hypochlorite ion, OCl–) sources.1 The C3N3O3 moiety (Figure 1) is typically denoted as Cy; therefore, cyanuric acid is represented as H3Cy, H2Cy– is the first ionization product, Cl3Cy is trichlor, and Cl2Cy is dichlor. Although the focus of the current research is a drinking water application, cyanuric acid, dichlor, and trichlor have been added to outdoor swimming pools since 1958 to stabilize chlorine residual by minimizing sunlight related degradation2 and are used as disinfectants and algicides in cooling towers.3 Furthermore, industrial uses of cyanuric acid include its use as a flame retardant additive in various plastics and resins and reducing nitrogen oxides in coal, oil, or gas fired boilers.4
Figure 1.
– Cyanuric acid chemical structures.
The World Health Organization (WHO) provides guidelines for the addition of dichlor and cyanuric acid to drinking water where the WHO specifies maximum concentrations of 50 and 40 mg L–1, respectively.5, 6 In the United States (US) and under the Federal Insecticide, Fungicide, and Rodenticide Registration Act (FIFRA), dichlor or trichlor use for the routine treatment of drinking water was first approved in July 2001.1 Furthermore and as of January 2018, NSF/ANSI 60 certification has been obtained by six manufacturers for dichlor and seven manufacturers for trichlor addition to drinking water.7 For greater detail on dichlor and trichlor’s use in drinking water, including disinfectant effectiveness compared to using free chlorine alone, reasons for use, and existing practical questions (e.g., potential unregulated disinfection byproducts), the reader is directed to a recent review by Wahman8.
When cyanuric acid is present in water with free chlorine, a rapid equilibrium is obtained between H3Cy and its three dissociation products, HOCl, and chlorinated cyanurates that has been established at 25 °C by O’Brien, et al.9. One complicating factor with the use of dichlor or trichlor in drinking water systems is that the free chlorine concentration (i.e., the effective disinfectant when using dichlor or trichlor) cannot be measured accurately by typically used methods in these systems. Because of the fast equilibrium between H3Cy and its three dissociation products, HOCl, and chlorinated cyanurates; free chlorine N,N–diethyl–p–phenylenediamine (DPD) and amperometric titration based methods measure the total chlorine (free chlorine plus the chlorine bound in chlorinated cyanurates, TOTCl) in the water and overestimate the true free chlorine residual present.10, 11 Consequently, free chlorine concentrations cannot be accurately determined to verify disinfectant efficacy. For example, compliance with US primary disinfection requirements or numeric disinfectant residual requirements (i.e., greater than detectable) in the distribution system required by several states12 is currently not possible. In fact, the Utah Division of Drinking Water has recently issued a plan review policy for dichlor or trichlor installations that notes the free chlorine measurement issue.13
To overcome the limitation of directly measuring free chlorine in systems with free chlorine and cyanuric acid present, one option is to use the established water chemistry of the free chlorine and cyanuric acid system to estimate the free chlorine concentration. For instance, a web–based application has been recently developed to assist in free chlorine’s estimation when cyanuric acid is present (https://usepaord.shinyapps.io/cyanuric/).14 Unfortunately, the water chemistry has only been determined for 25 °C, limiting the usefulness of the water chemistry estimate in actual drinking water systems where temperature may vary over a wide range (e.g., 5 to 35 °C). Therefore, there exists an immediate need to expand the water chemistry model to include temperatures from 5 to 35 °C. It is also desirable that future research focus on new methods for directly measuring free chlorine in systems with cyanuric acid present such as the possible quencher trimethoxybenzene.15
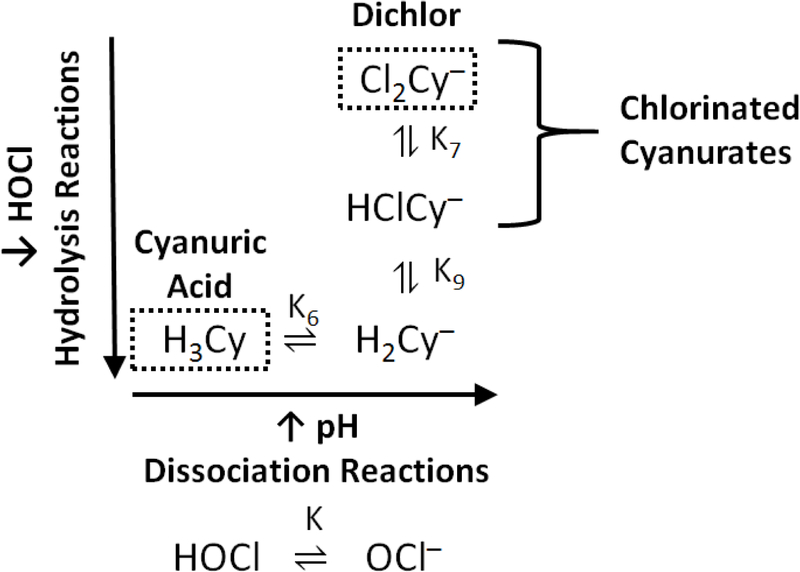
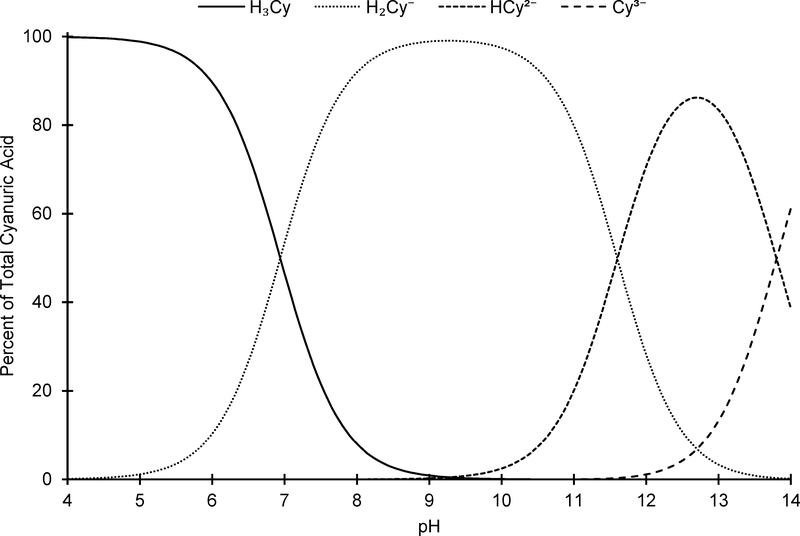
The complete water chemistry model for the free chlorine and cyanuric acid system consists of ten independent temperature dependent equilibrium reactions (Supplementary Information (SI) Figure S1),9 but under relevant drinking water conditions (i.e., 6.5 ≤ pH ≤ 9.5, TOTCl ≤ 10 mg Cl2 L–1, and total cyanurate ≤ 10 mg Cy L–1), the system can be simplified to four (K, K6, K7, and K9) temperature dependent equilibrium reactions (Figure 2 and Figure 3). As an example and for simulations using an implementation of the complete water chemistry model (SI Figure S1)14 and the previously stated relevant drinking water conditions, the chlorine containing species in the simplified system (HOCl, OCl–, HClCy–, and Cl2Cy–) represent greater than 98% of the TOTCl between pHs 7.0 and 8.5 and still represent greater than 95% of the TOTCl for the extreme pHs of 6.5 and 9.5 where H2ClCy and ClCy2– represent the other 5% of TOTCl.
Figure 2.
– Relevant hypochlorous acid, cyanuric acid, cyanuric acid ionization products, and chlorinated cyanurate equilibria under drinking water conditions and chemical dosages. Hydrogen ion for dissociation reactions and water and hypochlorous acid for hydrolysis reactions are not shown for clarity. Adapted with permission from Brady, et al.32. Copyright 1963 American Chemical Society.
Figure 3.
– Cyanuric acid dissociation at 25 °C, using pK values from O’Brien, et al.9 adjusted to 0 M ionic strength.
Two of the reactions in the simplified model (Figure 2) represent the acid–base chemistry of free chlorine (K) and cyanuric acid (K6) that can be readily isolated with each chemical for determination. Using the determined K and K6 relationships, the remaining two reactions (K7 and K9) involving chlorinated cyanurates, which are expected to be temperature dependent,16–18 could then be studied in parallel.
The temperature dependence for the ionization constant of HOCl (K) is established.19 Preliminary studies on the temperature dependence of the remaining three equilibrium constants (K6, K7, and K9) have been reported by Solastiouk18, but the experiments provided few details on the experimental procedure to verify assumptions made in the analysis and were limited in scope, leaving the temperature dependence of these three equilibrium constants in question and requiring a rigorous evaluation.
Thus, to expand the existing water chemistry model to a range of relevant drinking water temperatures, determination of the temperature dependence of K6, K7, and K9 is required. The current research represents the first step in extending the water chemistry model by determining the first acid ionization constant (K6) for cyanuric acid using spectrophotometric techniques from 5 to 35 °C. With K6’s temperature dependence established, further studies can be conducted to resolve K7 and K9’s temperature dependence, providing the necessary information to update the existing water chemistry model (e.g., the aforementioned web–based application) to simulate free chlorine concentrations in drinking water systems with cyanuric acid present. Even though the focus on the current research is drinking water conditions, the results presented herein also may have applications to chlorinated cyanurate use in outdoor swimming pools and industry as previously mentioned.
EXPERIMENTAL
Reagent Preparation
Solutions were prepared in ultra–pure water (18.2 MΩ–cm, Barnstead NANOpure Diamond). Stock cyanuric acid solutions (1,000 mg Cy L–1 total cyanurate) were prepared from reagent grade cyanuric acid (Acros Organics), accounting for reagent purity of 98%. Under the experimental conditions, total cyanurate (TOTCy) is the sum of H3Cy and H2Cy– as Cy. Phosphate buffers were made from sodium phosphate dibasic anhydrous (Fisher Chemical) and adjusted to the target pH with 0.05 and 0.5 N hydrochloric acid (HCl, Fisher Chemical) or sodium hydroxide (NaOH, Fisher Chemical) as required.
Spectrophotometric Measurements
All spectrophotometric measurements were conducted with a 1–cm quartz cuvette using a spectrophotometer (Hach DR/4000U Spectrophotometer) set to read a single wavelength of 214 nm, corresponding to the peak absorbance of H2Cy–.9, 20 The spectrophotometer was blanked with ultra–pure water prior to use. Triplicate absorbance measurements were taken and averaged for any measured sample. The sample pH and temperature were measured immediately prior to each spectrophotometric measurement with a pH electrode with automatic temperature compensation connected to a pH meter (Orion pH electrode and Orion Star A211 pH meter) that had been calibrated with nominal pH standards of 4, 7, and 10 per manufacturer’s instructions.
General Experimental Conditions
All experiments and associated measurements were conducted in a temperature controlled chamber maintained nominally at either 5, 10, 15, 20, 25, 30, or 35 °C. For each temperature, three experiments were conducted where a complete experiment set consisted of molar absorptivity experiments for (1) H3Cy and (2) H2Cy– and an (3) ionization constant determination experiment for K6.
Molar Absorptivity Experiments
H3Cy molar absorptivity estimation.
For each H3Cy molar absorptivity experiment, duplicate standards were prepared at concentrations of 0, 74, 100, 126, 150, and 200 mg Cy L–1 TOTCy and adjusted to a nominal pH of 1.8 with 6 N HCl (Fisher Scientific). At a pH of 1.8, the absorbance contribution of H2Cy– is negligible (i.e., < 0.1%).9, 20 The slope from the linear regression of the absorbance at 214 nm versus the H3Cy molar concentration is the molar absorptivity (ε) of H3Cy at 214 nm (ε0,214nm).
H2Cy– molar absorptivity estimation.
For each H2Cy– molar absorptivity experiment, duplicate standards were made at concentrations of 0, 6, 9, 12, 15, and 18 mg Cy L–1 TOTCy in a 2 mM phosphate buffer adjusted to a nominal pH of 9.0. At a pH of 9.0, greater than 98% of TOTCy is present as H2Cy–. Use of greater pHs is limited because interferences from the second ionization product (HCy2–) may occur.9, 20 The slope from the linear regression of the absorbance at 214 nm versus the H2Cy– molar concentration is the molar absorptivity of H2Cy– at 214 nm (ε1,214nm). Because pK6 was found to shift to greater values with decreasing temperature, two molar absorptivity experiments were conducted at pH 9.5 for the two lowest temperatures (5 and 10 °C) to evaluate impacts on ε1,214nm.
Estimated molar absorptivity multiple comparison analysis.
To evaluate the molar absorptivity values determined at the various temperatures used in the current research for H3Cy and H2Cy–, Tukey’s method of multiple comparisons was used to determine whether statistically significant differences existed between molar absorptivity estimates.21, 22 A multiple comparison analysis was conducted separately for the H3Cy and H2Cy– molar absorptivity estimates.
For the H3Cy and H2Cy– molar absorptivity experiments, Equation 1 defines the magnitude of a significant difference between two molar absorptivities (yi and yj) where differences greater than that determined by Equation 1 are considered significant. In Equation 1, qk,v,α is the significance level (α = 0.95) of the studentized range for k means (7 for H3Cy or 9 for H2Cy–) and v degrees of freedom (77 for H3Cy or 99 for H2Cy–) where v = N – k and N is the total sample number (84 for H3Cy or 108 H2Cy–), ni and nj are the two compared sample sizes (ni = nj = n = 12), and Spool is the pooled standard deviation of the H3Cy and H2Cy– molar absorptivity estimates. Calculations for Equation 1 were performed manually using qk,v,α values from Harter22.
| (1) |
Ionization Constant Determination Experiments
Absorption Model Derivation.
For the first ionization constant of cyanuric acid (H3Cy ⇌ H2Cy– + H+), Equations 2 and 3 represent relationships for the equilibrium constant and TOTCy concentration, respectively. In Equations 2 and 3, K6,TK is the first ionization constant of cyanuric acid at the given temperature in Kelvin (TK), γ1 is the activity coefficient for singly charged ions, square brackets indicate concentrations, braces indicate activities, and the activity coefficient of the uncharged H3Cy was assumed to be one.
| (2) |
| (3) |
From Equations 2 and 3, Equations 4 and 5 represent the concentration fraction of TOTCy that is H3Cy (α0) or H2Cy– (α1), respectively. Refer to the SI for a derivation of Equations 4 and 5.
| (4) |
| (5) |
The total absorbance (Absλ) at any given wavelength (λ) is the sum of the individual contributions from H3Cy and H2Cy– based on their respective concentrations, molar absorptivities at λ (ε0,λ and ε1,λ), and absorbance cell pathlength (l). Using Equations 4 and 5 and a 1–cm pathlength (l = 1 cm), Equation 6 represents the relationship between Absλ and K6,TK.
| (6) |
Both H3Cy and H2Cy– absorb in the ultraviolet wavelength region. Specifically, H2Cy– has a maximum absorbance at 214 nm whereas H3Cy’s molar absorptivity is approximately 1% of H2Cy– at 214 nm.9 If the molar absorptivities at 214 nm for H3Cy (ε0,214nm) and H2Cy– (ε1,214nm) are known and using Equation 6, the first ionization constant at a given temperature (K6,TK), pH, ionic strength (μ), and TOTCy is related to the total absorbance at 214 nm (Abs214nm) by Equation 7.
| (7) |
In Equation 7, the hydrogen ion activity, {H+}, is calculated from pH measurements where pH = –log10{H+}. The single charge ion (z = 1) activity coefficient (γ1) is determined from the Davies equation using Equation 8.23 In Equation 8, the term ADH is the Debye–Hückel constant that is determined from Equation 9 at the specified temperature in Kelvin (TK),23 and in Equation 9, the dielectric constant for water (εwater) is determined at the specified temperature in °C (Tc) from Equation 10.24
| (8) |
| (9) |
| (10) |
Ionization constant experiments.
To acquire the required data to allow estimation of K6 from Equation 7 for various temperatures, triplicate 15 mg Cy L–1 TOTCy standards were created in 2 mM phosphate buffer adjusted to nominal pHs of 6.0, 6.5, 7.0, 7.5, 8.0, and 8.5 at each experimental temperature. Abs214nm readings were taken as previously described.
Ionic strength calculation.
To account for slight variations in μ between samples, μ was calculated for each sample using Equation 11 based on known chemical additions, the measured pH and temperature, and a charge balance to account for the acid or base addition required to obtain the measured pH. In Equation 11, ci and zi are the concentration and charge of the ith ionic species, respectively. For the μ calculations, relationships for phosphate and water ionization constants with temperature were taken from Goldberg, et al.25 and Stumm and Morgan26, respectively.
| (11) |
Ionization constant temperature dependence.
The basic relationship of K6 with TK is shown by Equation 12.26 In Equation 12, ΔH0 is the standard enthalpy change of the reaction while R is the universal gas constant (8.314 × 10⁻³ kJ mol–1 K–1). If ΔH0 is assumed to be independent of TK (i.e., constant), Equation 13 results which can be further simplified to Equation 14. Combining Equations 7 and 14 gives Equation 15, in which A and B are adjustable parameters and .
| (12) |
| (13) |
| (14) |
| (15) |
Parameter estimation.
Estimation of parameters A and B in Equation 15 and subsequent determination of K6 by Equation 14 at various temperatures were accomplished in R, a freeware language and environment for statistical computing and graphics available for download at http://www.r-project.org/.27 R’s capabilities were extended through the use of the nlstools package Version 1.0–2,28 a free user–contributed package downloaded through the R software. In the R software, the function nls() was used to conduct a nonlinear least–squares estimate of parameters A and B by minimizing the residual sum of squares between all (n = 126) the experimentally measured and Equation 15 predicted Abs214nm values.
RESULTS AND DISCUSSION
Molar Absorptivity Experiments
Molar absorptivity estimates.
Molar absorptivity experiments were conducted at each temperature for both H3Cy and H2Cy– at 214 nm. A summary of the molar absorptivity estimates is presented in Table 1. Molar absorptivity estimates at a given temperature resulted in extremely good linear regressions for both H3Cy (0.997 ≤ R2 ≤ 0.999) and H2Cy– (0.998 ≤ R2 ≤ 1.000). For the temperatures studied, the molar absorptivity estimates ranged from 83.8 to 103 and 9,107 to 10,715 M–1 cm–1 for H3Cy and H2Cy–, respectively. O’Brien20 reported a molar absorptivity for H3Cy at 214 nm of 100 M–1 cm–1 while various values for H2Cy– have been reported, including 8,800;20 10,170;29 and 11,700 M–1 cm–1.30 Overall, the molar absorptivity estimates from the current research encompass a relatively tight range and are comparable to values previously reported for H3Cy and H2Cy–.
Table 1 –
Molar absorptivity estimate summary (number of samples (n) = 12 for each estimate).
| Cyanuric Acid (H3Cy), pH = 1.82 ± 0.057 | ||
|---|---|---|
| Temperature ± Standard Deviation – °C | Molar Absorptivity Estimate ± 95% Individual Confidence Interval – M −1 cm−1 | R2 |
| 5.2 ± 0.22 | 83.8 ± 1.43 | 0.997 |
| 10.2 ± 0.11 | 89.8 ± 0.90 | 0.999 |
| 15.7 ± 0.73 | 89.9 ± 1.12 | 0.999 |
| 19.2 ± 0.087 | 87.3 ± 1.39 | 0.998 |
| 24.5 ± 0.17 | 90.1 ± 1.29 | 0.998 |
| 30.0 ± 0.18 | 103 ± 1.24 | 0.999 |
| 34.0 ± 0.30 | 91.8 ± 1.55 | 0.998 |
| Cyanuric Acid First Ionization Product (H2Cy−), pH = 9.00 ± 0.010 | ||
| Temperature ± Standard Deviation – °C | Molar Absorptivity Estimate ± 95% Individual Confidence Interval – M−1cm−1 | R2 |
| 5.0 ± 0.083 | 10,211 ± 56 | 1.000 |
| 10.2 ± 0.12 | 10,528 ± 174 | 0.998 |
| 16.0 ± 0.22 | 10,715 ± 59 | 0.998 |
| 19.4 ± 0.11 | 9,324 ± 59 | 1.000 |
| 24.2 ± 0.13 | 9,591 ± 42 | 1.000 |
| 30.5 ± 0.10 | 10,218 ± 80 | 1.000 |
| 34.7 ± 0.15 | 9,107 ± 88 | 1.000 |
| Cyanuric Acid First Ionization Product (H2Cy−), pH = 9.51 ± 0.0092 | ||
| Temperature ± Standard Deviation – °C | Molar Absorptivity Estimate ± 95% Individual Confidence Interval – M−1cm−1 | R2 |
| 5.2 ± 0.11 | 10,376 ± 59 | 1.000 |
| 10.4 ± 0.12 | 10,650 ± 179 | 0.998 |
Multiple comparisons.
SI Figure S2 provides a comparison of the various molar absorptivity estimates where the bars represent 95% confidence intervals (CIs) determined from Tukey’s multiple comparison test previously described. When comparing two molar absorptivity estimates in SI Figure S2, the molar absorptivity estimates are considered statistically different if the bars from one molar absorptivity estimate do not overlap the other molar absorptivity estimate. A summary of the multiple comparisons is provided in SI Table S1, detailing each individual comparison that can be made. Even though similar, SI Table S1 shows that most of the molar absorptivity estimates were statistically different from one another at the various temperatures with no apparent pattern, indicating some random variability in the estimate possibly occurring from variability in absorbance measurements or solution preparation. Therefore, during the subsequent analysis for the first ionization constant experiments, the temperature specific molar absorptivity estimates were used as they were conducted at the same time that the ionization constant experiment was conducted, providing the best estimate of the relationship between absorbance and concentration when the ionization constant experiment was conducted.
Finally, for the two H2Cy– experiments conducted at the two lowest temperatures, there was no significant difference whether or not the experiment was conducted at pH 9.0 or 9.5; therefore, the assumption from previous research20 that pH 9.0 was sufficient to use for H2Cy– molar absorptivity estimation was validated for these extreme temperatures where an increase in pK6 might have required a higher pH to be used to be certain that H2Cy– is the only meaningful species present.
Ionization Constant Experiments
Source data.
Experimental data obtained from the ionization constant experiments is summarized in SI Table S2, consisting of 126 data points (18 at each experimental temperature). The calculated μ of the samples consisted of a relatively narrow range (4.1–6.1 mM), resulting in similar γ1 values for all samples (0.92–0.93).
Estimated parameters and comparison with previous research.
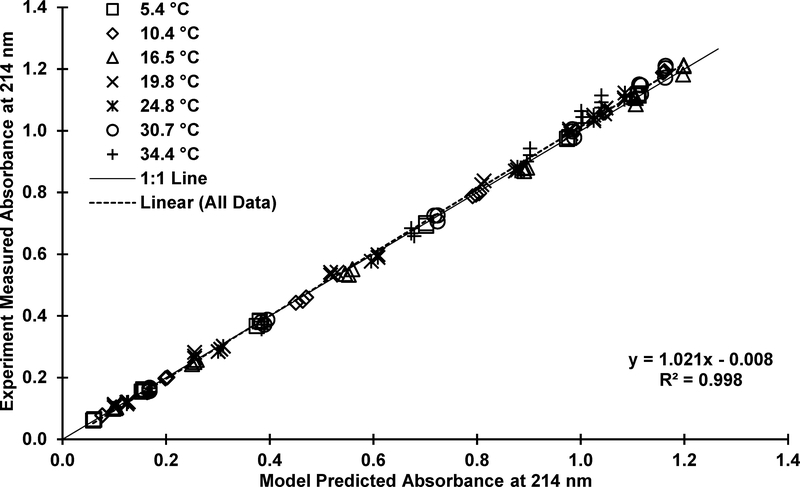
Using the data presented in SI Table S2 and molar absorptivity values from Table 1, A and B were estimating using Equation 15 and subsequently used to estimate K6 at various temperatures with Equation 14. A summary of the model fit to the experimental data is provided in Figure 4 where the model predicted absorbance is compared to the experimentally measured absorbance at 214 nm. Ideally, these points would form a line with a slope of one passing through the origin. The linear regression results in a line with a slope of nearly one (1.02 ± 0.0056, 95% CI), a minimal intercept (0.0083 ± 0.0074, 95% CI), and excellent R2 (0.998), indicating that the model represents the experimental data very well and that the assumption of constant ΔH0 (Equation 13) is justified.
Figure 4.
– Comparison of model predicted (Equation 15) absorbance versus experimentally measured absorbance at 214 nm.
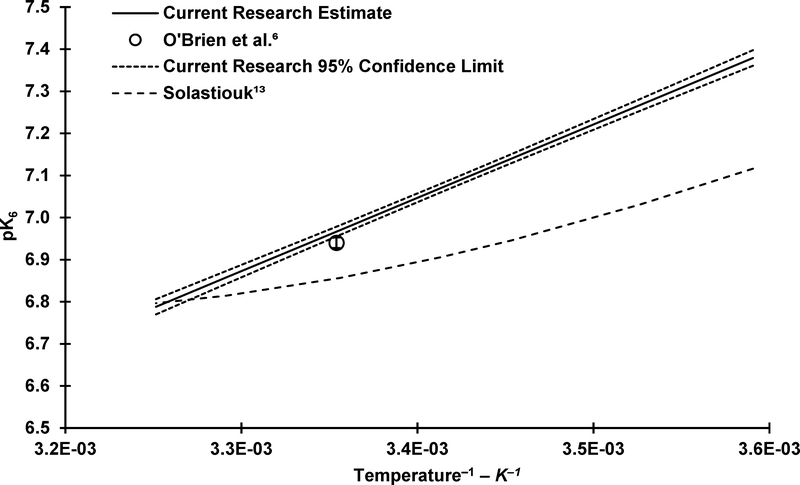
A summary of the estimates of A and B along with pK6 values ranging from 5 to 35 °C is provided in Table 2 along with comparisons with the 25 °C O’Brien, et al.9 estimate. The O’Brien, et al.9 estimate was adjusted to μ = 0 M (pK6 = 6.94 ± 0.013, 95% CI) from their experimental conditions of μ = 20 mM (pK6 = 6.88 ± 0.013, 95% CI) as described in the SI. Although significantly different, the current 25 °C estimate (pK6 = 6.97 ± 0.012, 95% CI) compares well with that of O’Brien, et al.9 where the two estimates of K6 are within 5% of each other. From the estimated value of A, ΔH° is estimated to be 33.4 ± 1.7 kJ mol–1 (95% CI).
Table 2 –
Cyanuric acid first acid ionization constant estimates (K6) and associated parameters (5 to 35 °C). Values determined in the current research unless otherwise noted.
| Temperature – °C | pK6 ± 95% Confidence Interval (μ = 0 M) |
|---|---|
| 5 | 7.39 ± 0.019 |
| 10 | 7.28 ± 0.014 |
| 15 | 7.17 ± 0.011 |
| 20 | 7.07 ± 0.010 |
| 25 | 6.97 ± 0.012 |
| 25a | 6.94 ± 0.013a |
| 30 | 6.87 ± 0.015 |
| 35 | 6.78 ± 0.019 |
| Parameter (Units) | Value ± 95% Confidence Interval |
| A (K) | 4,013 ± 207 |
| B | –2.58 ± 0.71 |
| ΔH0 (kJ mol−1) | 33.4 ± 1.7 |
O’Brien, et al.9
Prior to O’Brien, et al.9, previous researchers estimated pK6 with reported values ranging from 6.5 to 7.0.29, 31, 32 More recently, Jang, et al.33 estimated a similar pK6 to that of O’Brien, et al.9 and the current research (6.9) using both experimental (spectrophotometric) and computational (density functional theory quantum mechanical model) methods, supporting the reasonableness of the O’Brien, et al.9 and current pK6 estimate.
As mentioned previously, Solastiouk18 conducted preliminary experiments to determine the temperature dependence of K6, and the result of these experiments was Equation 16 (μ ≈ 0 mM).
| (16) |
Figure 5 displays a comparison of the current temperature dependent estimates of pK6 with those of Solastiouk18 along with the 25 °C value from O’Brien, et al.9 for reference. The results from the current research are markedly different from those presented by Solastiouk18, and after accounting for differences in ionic strength, the 25 °C K6 value from O’Brien, et al.9 is also substantially different (22%) than that determined by Solastiouk18. Insufficient detail is provided by Solastiouk18 to ascertain a definitive reason for these discrepancies, but one possible reason for the difference is an assumption made by Solastiouk18 during data analysis. Solastiouk18 assumed that the concentration fraction of TOTCy that is H2Cy– (α1) varied little with temperature from the value at 25 °C which is clearly not the case if pK6 is changing with temperature. For instance, Table 3 provides a summary of how α1 varies with temperature at a series of pH values, using the pK6 values determined in the current research. Although not specifically stated, it can be inferred that Solastiouk18 conducted the experiment at or near a pH of 4.8; therefore, Table 3 provides pH values ranging around a pH of 4.8.
Figure 5.
– Comparison of current research estimated pK6 and literature reported values. pK6 values adjusted to 0 M ionic strength as necessary.
Table 3 –
Temperature impact on fraction (α1) of total cyanuric acid, [H3Cy] + [H2Cy−], present as the first ionization product (H2Cy−) at various pHs.
| Temperature – °C | Calculated α1 for Given pH as % | |||
|---|---|---|---|---|
| 4.50 | 4.80 | 5.50 | 6.50 | |
| 5 | 0.13 | 0.26 | 1.28 | 11.5 |
| 10 | 0.17 | 0.33 | 1.65 | 14.3 |
| 15 | 0.21 | 0.43 | 2.10 | 17.6 |
| 20 | 0.27 | 0.54 | 2.64 | 21.3 |
| 25 | 0.34 | 0.68 | 3.30 | 25.5 |
| 30 | 0.42 | 0.84 | 4.09 | 29.9 |
| 35 | 0.53 | 1.04 | 5.02 | 34.6 |
CONCLUSIONS
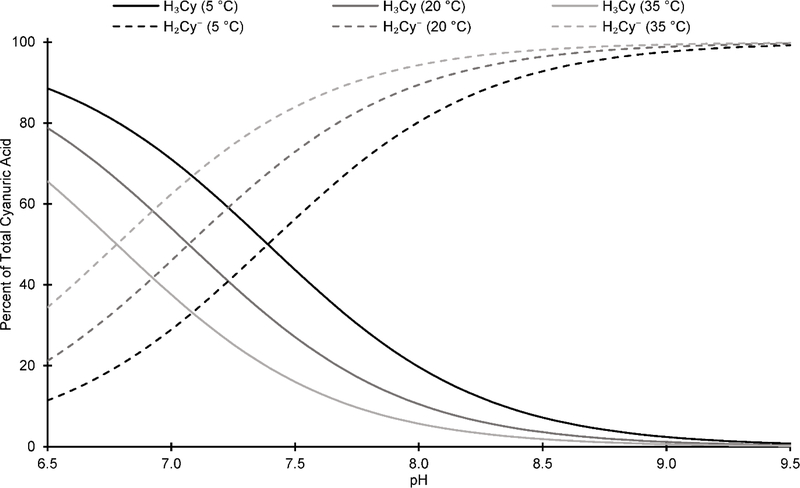
The results presented herein provide the first rigorous estimation of the first ionization constant of cyanuric acid (K6) from 5 to 35 °C where or and ΔH° = 33.4 ± 1.7 kJ mol–1. Figure 6 summarizes the temperature impact on the speciation of cyanuric acid at 5, 20, and 35 °C. Over the pH range of approximately 6.5 to 8, the speciation of cyanuric acid changes substantially with temperature. For example, at pH 7.0, H2Cy– represents 29 and 62% of TOTCy at 5 and 35 °C, respectively, meaning that the H2Cy– fraction effectively doubles from 5 to 35 °C.
Figure 6.
– Cyanuric acid speciation with temperature under drinking water relevant pHs (ionic strength = 0 M).
With the addition of K6’s temperature dependence to the known temperature dependence of K, only two temperature dependent equilibrium constants (K7 and K9) remain to be determined to allow extension of the free chlorine and cyanuric acid system water chemistry model to a range of relevant drinking water temperatures. These experiments and resulting extension of the web–based application to simulate the water chemistry are the focus of ongoing research.
Supplementary Material
ACKNOWLEDGMENT
The author acknowledges the technical assistance provided by Matthew Alexander and Alison Dugan of the United States Environmental Protection Agency’s (Agency’s) Office of Groundwater and Drinking Water and Michael Elovitz from the Agency’s Office of Research and Development. This work has been subjected to the Agency’s review and has been approved for publication. The views expressed in this manuscript are those of the author and do not necessarily represent the views or policies of the Agency. Any mention of trade names, products, or services does not imply an endorsement by the Agency. The Agency does not endorse any commercial products, services, or enterprises.
Footnotes
CONFLICTS OF INTEREST
There are no conflicts to declare.
REFERENCES
- 1.Kuechler TC, Use Of Chlorinated Isocyanurates For Drinking Water Chlorination, Proceedings of the Water Environment Federation, 2009, 2009, 799–806. [Google Scholar]
- 2.Canelli E, Chemical, bacteriological, and toxicological properties of cyanuric acid and chlorinated isocyanurates as applied to swimming pool disinfection – A Review, Am. J. Public Health, 1974, 64, 155–162. [DOI] [PMC free article] [PubMed] [Google Scholar]
- 3.Hammond BG, Barbee SJ, Inoue T, Ishida N, Levinskas GJ, Stevens MW, Wheeler AG and Cascieri T, A Review of Toxicology Studies on Cyanurate and Its Chlorinated Derivatives, Environ. Health Perspect, 1986, 69, 287–292. [DOI] [PMC free article] [PubMed] [Google Scholar]
- 4.Wojtowicz J, in Kirk–Othmer Encyclopedia of Chemical Technology, John Wiley & Sons, Inc., 2000, vol. 8, pp. 199–219. [Google Scholar]
- 5.World Health Organization, Guidelines for drinking–water quality, World Health Organization, Geneva, Switzerland, 4th edn., 2011. [Google Scholar]
- 6.World Health Organization, Sodium Dichloroisocyanurate in Drinking–water Background document for development of WHO Guidelines of Drinking–Water Quality, World Health Organization, Geneva, Switzerland, 2007. [Google Scholar]
- 7.NSF International, Search for NSF Certified Drinking Water Treatment Chemicals, http://info.nsf.org/Certified/PwsChemicals/, (accessed Date Accessed: January 11, 2018).
- 8.Wahman DG, Chlorinated Cyanurates: Review of Water Chemistry and Associated Drinking Water Implications, J. Am. Water Works Ass, accepted. [DOI] [PMC free article] [PubMed] [Google Scholar]
- 9.O’Brien JE, Morris JC and Butler JN, in Chemistry of Water Supply, Treatment, and Distribution, ed. Rubin AJ, Ann Arbor Science Publishers, Inc., Ann Arbor, MI, 1974, ch. Chapter 14, pp. 333–358. [Google Scholar]
- 10.Wajon JE and Morris JC, The analysis of free chlorine in the presence of nitrogenous organic compounds, Environ. Int, 1980, 3, 41–47. [Google Scholar]
- 11.Whittle GP, Amherst, MA, 1970.
- 12.Wahman DG and Pressman JG, Distribution System Residuals–Is “Detectable” Still Acceptable for Chloramines?, J. Am. Water Works Ass, 2015, 107, 53–63. [Google Scholar]
- 13.Utah Division of Drinking Water, Plan Review Policy for Dichlor and Trichlor Installations (DDW-Eng-0032 April 27, 2017), https://documents.deq.utah.gov/drinking-water/engineering/new-facilities-new-public-water-systems/DDW-2017-001930.pdf, (accessed Date Accessed: March 21, 2018).
- 14.Wahman DG, Free chlorine and cyanuric acid simulator application description – Version 0.50, EPA/600/S–17/165, United States Environmental Protection Agency, Washington, DC, 2017. [Google Scholar]
- 15.Lau SS, Dias RP, Martin-Culet KR, Race NA, Schammel MH, Reber KP, Roberts AL and Sivey JD, 1,3,5-Trimethoxybenzene (TMB) as a new quencher for preserving redox-labile disinfection byproducts and for quantifying free chlorine and free bromine, Environ. Sci. Water Res. Technol, 2018, DOI: 10.1039/C8EW00062J. [DOI] [Google Scholar]
- 16.Pinsky ML and Hu HC, Evaluation of the chloroisocyanurate hydrolysis constants, Environ. Sci. Technol, 1981, 15, 423–430. [DOI] [PubMed] [Google Scholar]
- 17.Wojtowicz JA, Reevaluation of Chloroisocyanurate Hydrolysis Constants, Journal of the Swimming Pool and Spa Industry, 1996, 2, 14–22. [Google Scholar]
- 18.Solastiouk B, Ph.D., Lorraine National Polytechnic Institute, 1989. [Google Scholar]
- 19.Morris JC, The acid ionization constant of HOCl from 5 to 35C, The Journal of Physical Chemistry, 1966, 70, 3798–3805. [Google Scholar]
- 20.O’Brien JE, Ph.D. Dissertation, Harvard University, 1972. [Google Scholar]
- 21.Berthouex PM and Brown LC, Statistics for Environmental Engineers, Lewis Publishers, Boca Raton, 2002. [Google Scholar]
- 22.Harter HL, Tables of Range and Studentized Range, Ann. Math Stat, 1960, 31, 1122–1147. [Google Scholar]
- 23.Benjamin MM, Water Chemistry, McGraw–Hill, New York, NY, 1st edn., 2002. [Google Scholar]
- 24.Malmberg CG and Maryott AA, Dielectric constant of water from 0° to 100° C, Journal of Research of the National Bureau of Standards, 1956, 56, 1–8. [Google Scholar]
- 25.Goldberg RN, Kishore N and Lennen RM, Thermodynamic Quantities for the Ionization Reactions of Buffers, J. Phys. Chem. Ref. Data, 2002, 31, 231–370. [Google Scholar]
- 26.Stumm W and Morgan JJ, Aquatic chemistry chemical equilibria and rates in natural waters, Wiley, Hoboken, New Jersey, 1996. [Google Scholar]
- 27.R Core Team, R: a language and environment for statistical computing, R Foundation for Statistical Computing, Vienna, Austria, 2017. [Google Scholar]
- 28.Baty F, Ritz C, Charles S, Brutsche M, Flandrois J-P and Delignette-Muller M-L, A Toolbox for Nonlinear Regression in R: The Package nlstools, 2015, 2015, 66, 21. [Google Scholar]
- 29.Hirt RC and Schmitt RG, Ultraviolet absorption spectra of derivatives of symmetric triazine—II: Oxo-triazines and their acyclic analogs, Spectrochimica Acta, 1958, 12, 127–138. [Google Scholar]
- 30.Sancier KM, Brady AP and Lee WW, Absorption spectra of solutions of cyanuric acid and its chlorinated derivatives, Spectrochimica Acta, 1964, 20, 397–403. [Google Scholar]
- 31.Gardiner J, Chloroisocyanurates in the treatment of swimming pool water, Water Res, 1973, 7, 823–833. [Google Scholar]
- 32.Brady AP, Sancier KM and Sirine G, Equilibria in Solutions of Cyanuric Acid and its Chlorinated Derivatives, J. Am. Chem. Soc, 1963, 85, 3101–3104. [Google Scholar]
- 33.Jang YH, Hwang S, Chang SB, Ku J and Chung DS, Acid Dissociation Constants of Melamine Derivatives from Density Functional Theory Calculations, The Journal of Physical Chemistry A, 2009, 113, 13036–13040. [DOI] [PubMed] [Google Scholar]
Associated Data
This section collects any data citations, data availability statements, or supplementary materials included in this article.


