Abstract
Radiotherapy (RT) has long been known to be immunogenic. Mounting preclinical data demonstrate a synergistic anti-tumor effect when RT is used in combination with immune check point inhibitors (ICI). However, it is unclear how to best integrate RT with an ICI (i.e. dose fractionation, sequence, etc.). Here we explored the concept that RT delivered as an in situ tumor vaccine sequentially to separate tumors over time might stimulate more potent and rapid antitumor immune response than RT delivered to only one tumor. In essence, radiation to a second tumor could be likened to giving a vaccine “booster shot”. Mice bearing pancreatic tumors in three different sites were injected with anti-PD-L1 antibody and exposed to three daily consecutive fractions of 4 Gy each at one or two sites with a one week interval. Our data indicate that delivering an RT to one tumor followed by an RT “booster shot” to a second tumor, compared to treating only one tumor with RT, significantly reduced tumor growth at a third non-irradiated site. This abscopal effect to the non-irradiated site was observed earlier (day 9) in mice that received RT to two tumors versusa single tumor (day 17). Decreased growth of the non-irradiated tumor correlated with a transient increase of the CD4/CD8 ratio in the tumor, increase myeloid-derived suppressor cells and tumor associated macrophages in the draining lymph nodes. These data warrant further exploration of sequentially treating multiple lesions with RT and ICI with the intent of generating a robust anti-tumor immune response.
Keywords: Immune checkpoint inhibitors, Anti-PD-L1, Radiation, Booster shot, Pancreatic cancer
INTRODUCTION
Pancreatic cancer presents one of the most dismal prognoses of all solid tumors with median survival duration of approximately 6 months following diagnosis and an overall survival rate less than 5% at 5 years [1]. Reasons for this include a predilection for distant dissemination and inherent resistance to conventional therapy such as chemotherapy and radiotherapy [2]. Recent studies indicate that the pancreatic tumor micro environment also contributes to treatment resistance by attracting immune suppressive cells such as macrophages and regulatory T-cells to the stroma and decreasing antitumor immunity [3,4]. Current treatments are clearly inadequate and new strategies that could prolong or boost a systemic initial response are much needed.
Over recent years there has been an increased interest in developing immune therapies based on promising preclinical and clinical studies. Immune checkpoint inhibitors (ICI), such as anti-programmed death receptor (PD)-1 and anti-PD-ligand (L)-1 antibodies, significantly enhance anti-tumor T-cell activity [5,6]. Increasing clinical data demonstrate that anti-PD-1/PD-L1 antibodies improve outcomes with minimal toxicity for patients with a variety of tumors including melanoma, lung, and head and neck cancers [7]. In fact, the first anti-PD-1 antibody, pembrolizumab, was approved by the Food and Drug Administration (FDA) for use in patients with advanced melanoma and approval for other cancer types has quickly followed. Unfortunately immune checkpoint inhibition has not yet been shown to provide significant clinical benefit for patients with pancreatic cancer, at least when employed as monotherapy. On the other hand, preclinical data offer hope that immunotherapy is capable of increasing the immunogenicity of pancreatic cancer [8] and that adding RT may further enhance the immune response of this very challenging disease [9].
Although combining RT and ICI appears to be a viable strategy for several types of tumors, including potentially pancreatic cancer, it remains unclear how to best incorporate these modalities to unleash the most effective possible antitumor response. For example, the ideal timing and fractionation of RT in combination with immunotherapy is unknown and this likely differs based on tumor histology as well as tumor immunogenicity. Not well described is whether treating multiple tumors with radiation is more effective at generating an ascopal effect (regression of metastatic tumors at a distance from the irradiated site) than treating only a single tumor. Here, we propose a novel strategy of delivering RT sequentially to two separate tumors with concurrent ICI to generate a secondary and more potent anti-tumor immune response than RT to one tumor with concurrent ICI.
The notion that exposing tumor multiple times to radiation, a potent immune stimulatory agent, results in a more efficacious response than exposure only once borrows from principles of prophylactic vaccination against infectious disease that have been well understood for at least 75 years [10]. Multiple exposures to the same infectious foreign antigen at defined intervals through the use of vaccine booster shots generate memory immune responses, each more rapid, potent, and durable than the previous. Here we tested the hypothesis that in combination with an anti-PD-L1 mAb, a second “booster shot” of RT to a separate previously un irradiated tumor will result in higher tumor reduction of an un irradiated tumor compared to only an initial course of RT due to generation of a secondary tumor-specific immune response. Our data indicate that indeed a booster shot of RT significantly reduced tumor growth of a non-irradiated tumor at an earlier time point (day 9) as compared to radiation at a single site (day 17). These data demonstrate proof-of- principle that RT for multiple tumors triggers a more potent anti-tumor immune response than RT to a single tumor, thus warranting further exploration.
MATERIALS AND METHODS
Mice and cell line
For this study, 36 male C57BL/6 mice were injected (s.c) with 0.5−1.0 ×10⁶ mouse Panc02 pancreatic cancer cells to form a single, solid, subcutaneous tumor on the right flank (T1), left flank (T2), and back (T3). Tumors intended for treatment (T1 and T2) received 2 times more cells than tumors used to measure abscopal effects (T3). Panc02 cells were obtained from Dr. Jeffrey Schlom, National Cancer Institute, National Institutes of Health, and Bethesda, MD. The cells were grown and maintained in High glucose McCoy’s 5A Modified Media (Invitrogen), 10% FBS, 2 mM glutamine, 10,000 U/ml penicillin, 10,000 U/ml streptomycin, 1 × Nonessential amino acids, 10 mM HEPES, 1 mM sodium pyruvate. Animals were treated according to their assigned group and monitored regularly. Documentation of appearance, behavior, body weight, and tumor growth continued until the total tumor burden was about 10% of the mouse body weight and the animal was euthanized. Tumor volume was assessed by electronic caliper with the following formula: V = (W (2) × L)/2where V is tumor volume, W is tumor width, L is tumor length. All animal procedures were performed according to a protocol approved by the University of Maryland Institutional Animal Care and Use Committee (IACUC protocol #1113007) and in accordance with veterinarian recommendations for the proper care and use of laboratory animals.
Immune cells isolation, staining and FACS analysis
Blood, tumor and draining lymph nodes were collected at euthanasia at different time points –tissues were collected and single cell suspensions were obtained for flow cytometry analysis. Briefly, organs were processed through a cell strainer and washed in PBS 2% FBS (Gemini) 1% PenStrep 1% NEAA (Gibco, Life Technologies). Spleen and blood samples were treated with red blood cell lysis buffer (BioLegend) before washing. Cells were stained at 1×10⁶ cells per Antibody (0.25 µg) for 2 hours at 4°C in 100 µL FACS Buffer (1× PBS 5% FBS 0.1%). All antibodies were from BioLegend (San Diego, CA). Three panels of mouse monoclonal Abs were used; Panel 1: APC-Tigit, PerCPCy5.5-Lag3, FITC-CD8, APC-Cy7-PD1, PE-CD4; Panel 2: F480-PacBlue, FITC-Cd11b, PerCP-Cy5.5-Gr1; Panel 3: APC-CD4, PE-CD25, AF488-FoxP3. Cells were washed twice in FACS Buffer and analyzed by flow cytometry. All flow cytometry was performed at the University of Maryland Greenebaum Cancer Center Flow Cytometry Shared Services on the BD LSR II and high throughput sampler (HTS). Flow cytometry acquisition was performed using a FACS Calibur or LSRII instrument (BD Biosciences) and FACS data were analyzed using Flow Jo software (Tree Star Inc).
RADIATION THERAPY
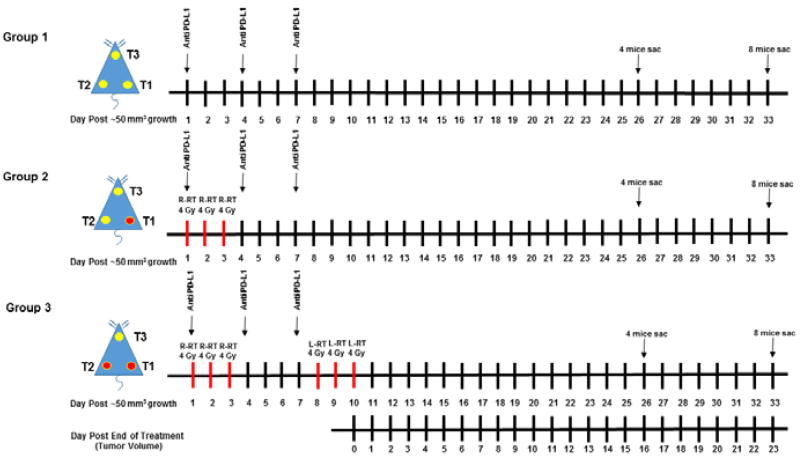
Radiation Parameters were as follows: Irradiator: Xstrahl (Atlanta, GA), Small Animal Radiation Research Platform (SARRP), Radiation Geometry: Multi focus beam, Radiation Dose(s): 4 Gy in a single fraction per day, for three consecutive days for each irradiated tumor (Figure 1). Radiation Dose Rate was approximately 2 Gy per minute. Mice were anesthetized during irradiation using isoflurane. Micro CT Imaging: Once a mouse was anesthetized it was placed in a prone positon on the animal platform of the SARRP and secured in place. The mouse was imaged using the SARRP’s onboard CT scanner. The SARRP software reconstructed a 3D image of the animal. Targeted Irradiation: The isocenter of the radiation field was placed at the center of the tumor so a total dose of 4 Gy was delivered to the tumor. The X-ray field size was limited by a collimator to a size appropriate for the targeted tumor, and a parallel opposed beam was used to ensure only the targeted tumor was irradiated. The maximal energy used to generate the X-rays was 225 kVp. After radiation, animals were kept on heating blankets to help maintain normal body temperature until fully awake and mobile, at which time they were placed back in the housing facility. At the time of first irradiation dose the mice received 200µg anti-PD-L1 i.p. (clone 10F.9G2 from BioXCell, West Lebanon NH) every three days for a total of three times.
Figure 1.
Schematic representation of the treatments plan.Three groups of mice were injected with mouse pancreatic cancer panc02 cells at three different sites; one on the back of the mouse (T3) and one on each flank (T1; Right, T2; Left). Once the tumors reached ~50 mm3, mice in each group were injected with anti PD-L1 antibodies on day 1, 4 and 7. Group 1 received no further treatments, Groups 2 and 3 were irradiated (4 Gy) on the right flank T1 tumor on day 1, 2 and 3. Group 3 was subsequently irradiated (4Gy) on the left flank T2 tumor on day 8, 9 and 10. Day 10 is considered day 0 of post end of treatment. Yellow circles indicate location of non-irradiated tumors. Red circles indicate location of irradiated tumors.
qPCR - MDSC and Macrophages presence in group 3 tumors, twenty two days post end of treatment were detected by qPCR with a custom Prime PCR Plate (BioRad) with the following primers: Emr1 (F4/80), Itgam (CD11b), Ly6c1 (MDSC GR1), B2m. RNA was isolated by conventional techniques from frozen tissue, reverse transcribed and analyzed by qPCR on an Applied Biosystems 7300 Real-Time PCR System in duplicate. Levels of expression were expressed as a ratio of B2M b-2-microglobulin Beta-chain of MHC class I (B2m), one of the most abundant and stable macrophage marker for qPCR analysis [11].
Statistical analysis - Statistical analyses were determined using Student’s paired t-test and one-way ANOVA with EXCEL software version 2013. Probability values lower than 0.05 are considered statistically significant. Error bars represent standard error of the mean.
RESULTS AND DISCUSSION
Recent evidence indicates that radiation-induced PD-L1 in the tumor microenvironment could contribute to negative regulation of tumor-infiltrating T cells and mediate radio resistance [12]. We thus aimed to evaluate the systemic immune reaction and potential abscopal response as a function of number of tumors irradiated in combination with anti-PD-L1 mAb. In order to do this we devised a treatment plan as depicted in Figure 1. Three groups of immune competent C57BL/6 mice were injected with mouse pancreatic cancer panc02 cells in the right flank (T1), left flank (T2), and the back (T3) of the mouse. Once the tumors reached ~50 mm3, mice in each group were injected with anti-PD-L1 antibodies on day 1, 4 and 7. Group 1 received no further treatments, Groups 2 and 3 were irradiated on the T1 tumor on day 1, 2 and 3. Group 3 was subsequently irradiated on the T2 tumor on day 8, 9 and 10. Day 10 is considered day 0 of post end of treatment.
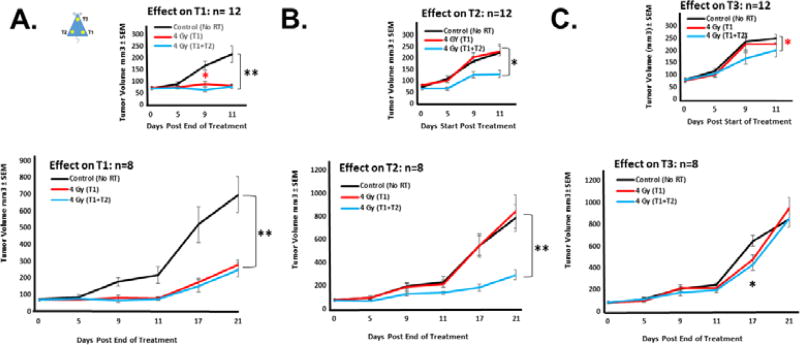
We first measured the effect on tumor growth at different intervals following the end of treatment. The data shown in Figure 2A indicate that as expected irradiation of the T1 tumor significantly (p <0.005 one-way ANOVA) reduced the growth of that tumor starting 9 and 11 days post end of treatment (Figure 2A, red line). Subsequent irradiation to the T2 tumor (blue line) slightly but significantly (p <0.05 Student’s t-test) reduced further the growth of the T1 tumor 9 days post end of treatment (inset) as compared to irradiation of T1 only (red line) or anti-PD-L1 inhibitor alone (black line). However, the difference in the growth rate of T1 was no longer present11 days post end of treatment. Nonetheless, the irradiated T1 tumor remained significantly (p <0.005) smaller than the non-irradiated tumor (Figure 2A) up to 21 days post end of treatment at which time the mice had to be sacrificed. No further significant benefit from irradiating the T2 tumor was observed on the growth of the T1 tumor (red and blue lines). A similar effect was observed on the T2 tumor where significant (p <0.05 one-way ANOVA) reduction in tumor growth was observed following T2 irradiation as early as 5 days post end of treatment (inset Figure 2B, blue line). This difference remained up to 21 days post end of treatment (Figure 2B). However, irradiation of the T1 tumor did not affect the growth of the T2 tumor (red and blue lines). Growth of the T3 tumor (Figure 2C) was not initially affected by irradiation to the T1 tumor but subsequent RT to the T2 tumor significantly (p<0.05) reduced the growth of the non-irradiated T3 tumor as early as 9 and 11 days post end of treatment (inset, blue line). The effect on the non-irradiated T3 tumor was even more prominent 17 days post end of treatment (Figure 2C) where radiation at either one or two sites significantly (p <0.05) reduced tumor growth. The effect of a “booster shot” of radiation to a second and separate lesion in the left flank (T2) thus appears to occur earlier (blue line, days 9–11) in the non-irradiated T3 tumor as compared to RT given to the T1 tumor only (red line, day 17). Nonetheless, the effect of radiation at either one or two sites on the non-irradiated T3 tumor was not sustained beyond three weeks post end of treatment (Figure 2C).
Figure 2.
Evaluation of radiation booster shot in a mouse pancreatic cancer syngeneic model. Panc02 cells were injected s.c. in the flanks of immuno competent C57BL/6 mice and treated as indicated in Figure 1. Tumor volumes were measured by caliper at the indicated intervals and expressed as Tumor volume ± standard error of the mean (SEM). Black line represents Group 1 (No radiation), red line represents Group 2 (mice irradiated to the T1 tumor) and blue line represents Group 3 (mice irradiated to the T1 and T2 tumors). Measurements were performed on the T1 (A), T2 (B) and T3 (C) tumors of 8 mice up to 21 days post end of treatments. Insets: measurements performed on the initial 12 mice up to 11 days post end of treatments. Four mice per group were sacrificed on day 16 for blood, tumors and lymph nodes collections. * p<0.05, **p<0.005 one-way ANOVA; * p<0.05 Student’s paired t-test.
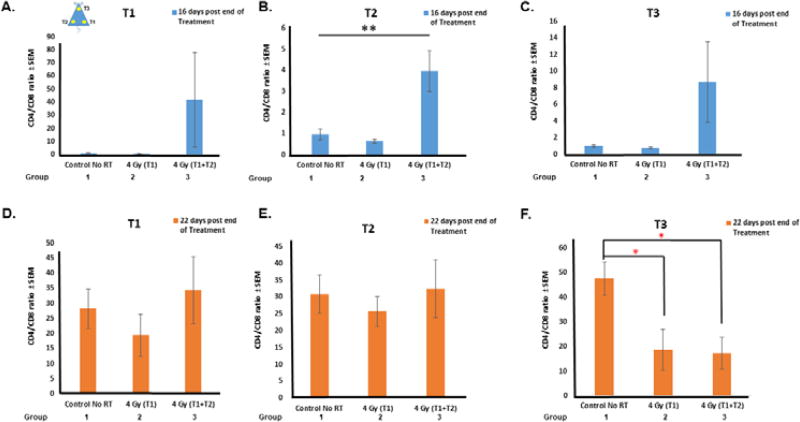
Previous reports have shown that the ratio of CD4/CD8 T cells reflects the immune system status and could be used to predict risk of distant metastasis (13) as well as the outcome of activated T lymphocyte immunotherapy (14). In order to evaluate the role of the immune response in decreasing tumor growth we then measured the ratio of tumor infiltrating CD4/CD8 cells at sixteen and twenty-two days post end of treatment. The data shown in Figure 3A–C indicate that the CD4/CD8 ratio increased in all tumors, including the non-irradiated T3 tumor (Figure 3C), sixteen days after completion of RT to the T2 tumor (Group 3). Nonetheless, twenty-two days post end of treatment the CD4/CD8 ratio significantly (p<0.05) decreased in the non-irradiated T3 tumor (Figure 3D) following irradiation to either the right tumor alone or both right and left flank tumors. On the contrary the CD4/CD8 ratio remained relatively high in the irradiated tumors (Figure 3E–F). This difference in the kinetics of the CD4/CD8 ratio could contribute to the difference observed in the growth of the irradiated and non-irradiated tumors shown in Figure 2.
Figure 3.
CD4+ and CD8+ T-cell subsets in the indicated mice tumors following indicated treatments. CD4:CD8 ratios were determined for all tumors at sixteen (A–C) and twenty two (D–F) days post end of treatment. Ratio is expressed ± standard error of the mean (SEM). Four mice per group were evaluated. ** p<0.005 one-way ANOVA; * p<0.05 Student’s paired t-test.
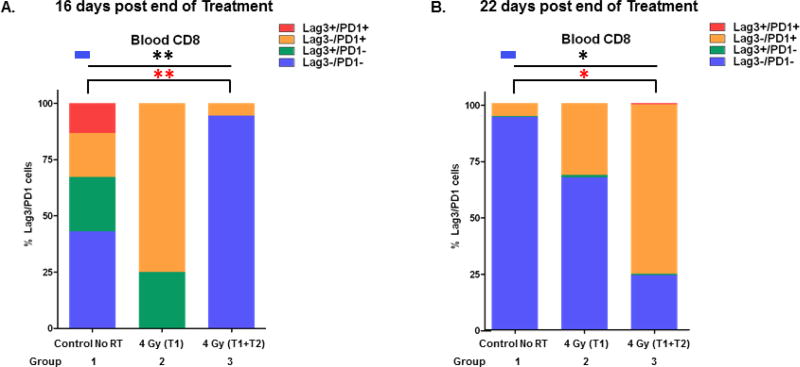
We next evaluated the systemic effect of the radiation booster shot on CD8 T cell activation in the blood. Because the immune co-inhibitory receptors lymphocyte activation gene-3 (LAG-3) and programmed cell death 1 (PD-1) contribute to autoimmunity and tumor evasion [13], we measured the percentage of CD8 Lag3+/PD1+ and Lag3−/PD1− cells in response to treatment. The data shown in Figure 4A indicate that RT to the T1 tumor followed sequentially by RT to the T2 tumor (T1+T2) significantly (p<0.005 one-way ANOVA) increased the percentage of CD8 Lag3−/PD1− cells in the blood sixteen days post end of treatment. Similar data were obtained with immune cells isolated from the animal spleens (data not shown). This increase in CD8 Lag3−/PD1−likely contributed to the initial growth reduction observed in all the tumors (Figure 2A–C). However, the percentage of CD8 Lag3−/PD1− decreased significantly twenty two days post end of the booster shot treatment (Figure 4B; T1+T2). Although all tumors grew at this time point, the non-irradiated T3 tumor (Figure 2C) grew more substantially than the irradiated tumors (Figure 2A–B, blue lines). This suggests that other immune cells may have contributed to slowing the growth of the irradiated tumors at the later time point (Figure 2A–B).
Figure 4.
CD8+ T-cells subpopulation as measured by FACS analysis. Blood from 4 mice treated as indicated was extracted at sixteen (A) and twenty two (B) days post end of treatment. Results are expressed as a percentage of total CD8+ cells. Group 1 no radiation, Group 2 radiation to the right T1 tumor, Group 3 radiation to the right and left tumor (T1+T2). * p<0.05, ** p<0.005 one-way ANOVA;* p<0.05, ** p<0.005 Student’s paired t-test.
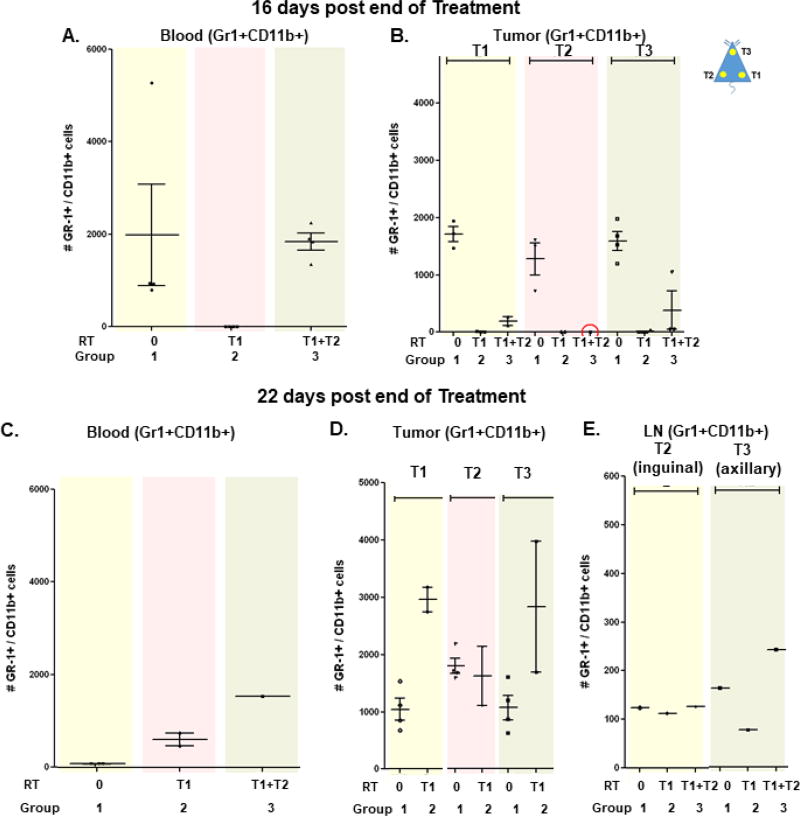
In order to verify this possibility we measured the levels of myeloid-derived suppressor cells (MDSC) and tumor associated macrophages (TAM) in the blood, tumors and draining lymph nodes. The data shown in Figure 5A–B indicate that as reported by others [14] irradiation to a single tumor (T1) substantially reduced the number of blood (Figure 5A) and tumor-infiltrating MDSC, GR1+/CD11b + (Figure 5B, yellow box group 2). Irradiation to a single tumor (T1) also decreased the levels of GR1+/CD11b+ cells at non-irradiated T2 and T3 tumors (Figure 5B, pink and green boxes, group 2). However, this effect could be transient and different in each tumor since radiation to the T1 tumor did not affect the growth of the T2 tumor (Figure 2B, red line) but did reduce the growth of the T3 tumor (Figure 2C, day 17, red line). As time progressed, the levels of MDSC increased in the blood as well as in the tumors of mice irradiated to the T1 tumor (groups 2, Figure 5C–D). This is in striking contrast to the effect observed sixteen days post end of treatment where radiation to the T1 tumor depleted all tumors of GR1+/CD11b+ cells (Figure 5B, groups 2). However, this could suggest that while radiation and ICI was capable of generating an abscopal effect, this effect was short-lived and not able to be sustained after 3 weeks (Figure 2C). The reason for this short-lived effect is not well understood at this time but could include MDSC up regulation in the non-irradiated tumors (Figure 5B–C, T2 and T3) at the later time point. The MDSC up regulation is in good agreement with the growth of the non-irradiated T2–T3 tumors following radiation at the T1 site21 days post end of treatment (Figure 2D, red lines).
Figure 5.
MDSCs (Gr1+CD11b+) cells in the blood, tumors and Lymph nodes(LN) sixteen (A–B) and twenty two (C–E) days post end of treatment. Group 1 no radiation, Group 2 radiation to the T1 tumor, Group 3 radiation to the T1 and T2 tumors. T1: right tumor, T2: left tumor, T3: back tumor.
In an effort to determine whether a subsequent booster shot of radiation to the left T2 tumor after radiation to the right T1 tumor could increase further the immune response we also assessed the frequency of GR1+/CD11b+ cells following radiation to the left T2 tumor. Our data indicate that a booster shot of radiation to the left tumor (Figure 5A, T1+T2, group 3) increased the levels of GR1+/CD11b+ cells in the blood as compared to mice irradiated to a single site (group 2) but only to levels comparable to the non-irradiated mice (group 1) while MDSC levels remained relatively low in all tumors sixteen days post end of treatments (Figure 5B, T1+T2, groups 3). This is in agreement with the observation that all tumors exhibited reduced growth at day 17 (Figure 2 A–C, blue lines).
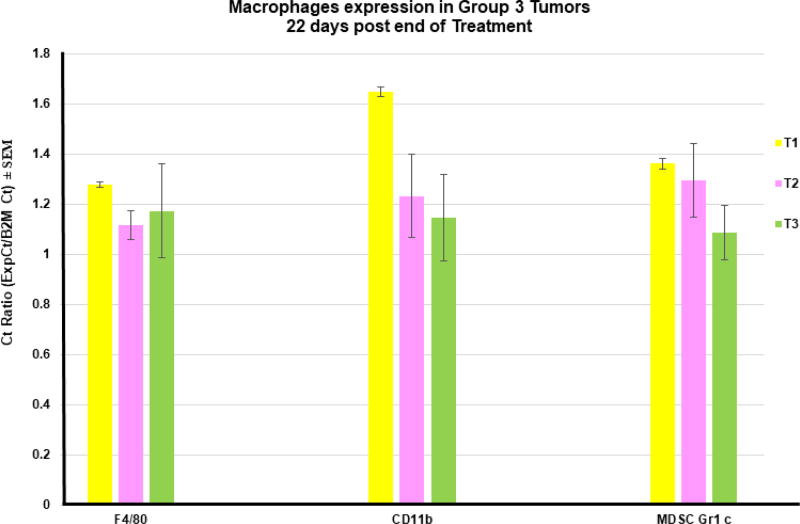
Radiation to the T2 tumor also led to MDSC increase in the blood, twenty two days post end of treatment (Figure 5C, group 3). In addition, MDSC expression levels remained as high as the macrophages marker, B2M b-2-microglobulin Beta-chain of MHC class I (B2m) [15], in all tumors twenty two days post end of treatment (Figure 6). In the axillary lymph nodes proximal to the T3 no-irradiated tumor, RT to the T2 tumor also led to MDSC increase twenty two days post end of treatment (Figure 5E group3). An abscopal effect in response to RT was recently correlated with a reduction of MDSCs in the peripheral blood of a melanoma patient [16]. Given thatCD8+ cells are directly involved in controlling MDSC by inducing apoptosis of MDSC (12) it seems possible that the decline in activated CD8+ cells observed here following a booster shot of radiation (Figure 4B group 3) could have contributed to damping the abscopal effect. In fact the decline on CD8+ cells observed at 22 days (Figure 4B) corresponds to an increase in MDSC in the blood and lymph nodes of non-irradiated tumors (Figure 5C, E (T3, group 3)). These data support the pattern of tumor growth observed 22 days post end of treatment (Figure 2D–F).
Figure 6.
Expression of macrophages markers in the indicated tumors twenty two days post end of treatment. Data are expressed as a ratio of Ct value of the indicated marker over B2M Ct value which was in average 17.1. Error bars represent Standard error of the mean.
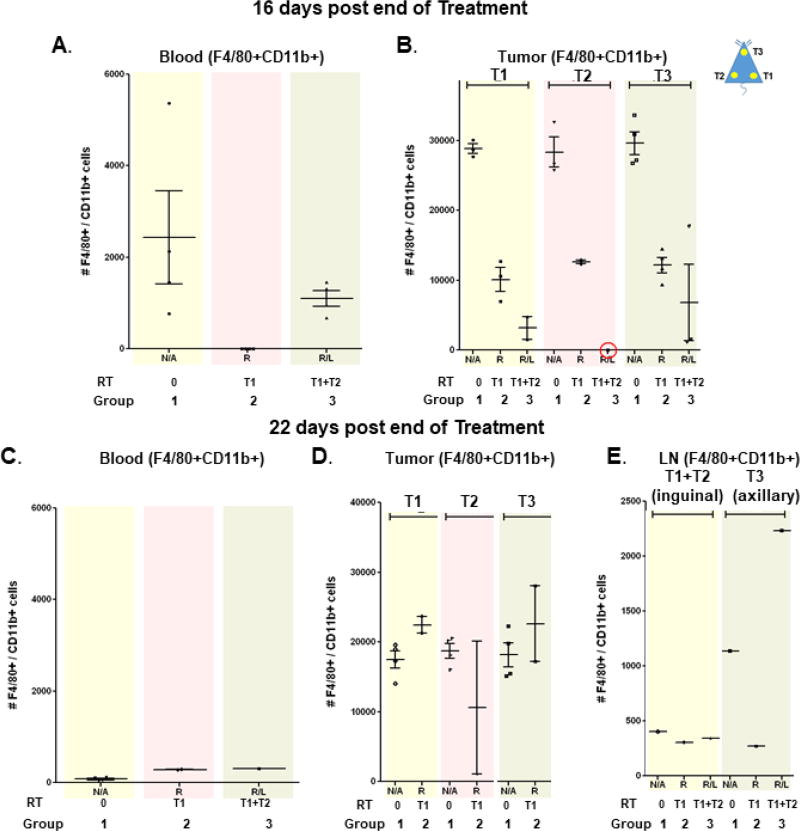
Similar data were obtained with TAM, CD11b+F4/80+ (Figure 7A) where a booster shot of radiation to the T2 tumor increased MDSC in the draining lymph node of the non-irradiated (T3) tumor and maintain MDSC levels in all tumors twenty two days post end of treatment (Figure 6). Irradiation to the T1 tumor decreased TAM in the blood and all the tumors (Figure7B–C, groups 2) sixteen days post end of treatment, but increased TAM in the non-irradiated tumors (T3) twenty-two days post end of treatment (Figure 7D–F, group 2).
Figure 7.
TAM (F4/80+CD11b+) cells in the blood, tumors and lymph nodes (LN) sixteen (A–B) and twenty two (C–E) days post end of treatment. Group 1 no radiation, Group 2 radiation to the T1 tumor, Group 3 radiation to the T1 and T2 tumors. T1: right tumor T2: left tumor, T3: back tumor.
CONCLUSION
When compared to a single RT course, multiple RT courses delivered to separate tumors in a sequential fashion may favorably tip the balance between immune suppression and stimulation by potentially reducing the burden of active disease and limiting the tolerating effect of additional metastatic sites. Our data indicate that irradiation of multiple tumors sequentially with ICI does in fact result in an earlier and more potent effect on a non-irradiated tumor than irradiation of a single tumor with ICI, but this effect was modest and transient. There are several possible reasons that could explain why we did not observe a larger and more durable difference between groups based on the number of tumors irradiated. First, pancreatic cancer is nonimmunogenic although despite this it is notable that we saw a difference in tumor growth in the T3 tumor between Groups 1 and 2. It is plausible that we would have observed a more robust tumor growth reduction with bilateral flank RT if we chose a more immunogenic tumor such as melanoma. Second, anti-PD-L1 inhibitor was started on the same day as RT in our study, but may be more effective if started prior to RT [15]. In addition, the radiation dose and fractionation we used (4 Gy×3) may have been suboptimal. Azad and colleagues recently demonstrated a synergistic effect of ICI with RT using a pancreatic cancer model only in their “high dose” group (12 Gy,5 Gy×3,20Gy×1) [9]. Nonetheless, to our knowledge this study provides the first proof-of- principle that combining ICI with multiple courses of RT over time may propagate a more robust anti-tumor immune response.
Acknowledgments
This work was support in part by a pilot grant from the Radiation Oncology Department (MC), the University of Maryland, Greenebaum Comprehensive Cancer Center P30CA134274 and an American Cancer Society Institutional Research Grant to MC.
ABBREVIATIONS
- RT
Radiation Therapy
- ICI
Immune Checkpoint Inhibitors
- PD-1
Programmed Death 1
- PD-L1
PD-Ligand 1
- mAb
Monoclonal Antibody
- LAG-3
Lymphocyte Activation Gene-3
- MDSC
Myeloid-Derived Suppressor Cells
- TAM
Tumor Associated Macrophages
- SARRP
Small Animal Radiation Research Platform
References
- 1.Hidalgo M. Pancreatic cancer. N Engl J Med. 2010;362:1605–1617. doi: 10.1056/NEJMra0901557. [DOI] [PubMed] [Google Scholar]
- 2.Ryan DP, Hong TS, Bardeesy N. Pancreatic adenocarcinoma. N Engl J Med. 2014;371:1039–1049. doi: 10.1056/NEJMra1404198. [DOI] [PubMed] [Google Scholar]
- 3.Diana a, Wang LM, D’Costa Z, Allen P, Azad a, Silva MA, et al. Prognostic value, localization and correlation of PD-1/PD-L1, CD8 and FOXP3 with the desmoplastic stroma in pancreatic ductal adenocarcinoma. Oncotarget. 2016;7:40992–41004. doi: 10.18632/oncotarget.10038. [DOI] [PMC free article] [PubMed] [Google Scholar]
- 4.Zhang Y, Velez-Delgado A, Mathew E, Li D, Mendez FM, Flannagan K, et al. Myeloid cells are required for PD-1/PD-L1 checkpoint activation and the establishment of an immunosuppressive environment in pancreatic cancer. Gut. 2017;66:124–136. doi: 10.1136/gutjnl-2016-312078. [DOI] [PMC free article] [PubMed] [Google Scholar]
- 5.Iwai Y, Ishida M, Tanaka Y, Okazaki T, Honjo T, Minato N. Involvement of PD-L1 on tumor cells in the escape from host immune system and tumor immunotherapy by PD-L1 blockade. Proc Natl Acad Sci U S A. 2002;99:12293–12297. doi: 10.1073/pnas.192461099. [DOI] [PMC free article] [PubMed] [Google Scholar]
- 6.Topalian SL, Hodi FS, Brahmer JR, Gettinger SN, Smith DC, McDermott DF, et al. Safety, activity, and immune correlates of anti-PD-1 antibody in cancer. N Engl J Med. 2012;366:2443–2454. doi: 10.1056/NEJMoa1200690. [DOI] [PMC free article] [PubMed] [Google Scholar]
- 7.Sosman JSM, McDermott D, Carvajal R, Lawrence D, Topalian S, et al. Clinical activity and safety of anti-programmed death-1 (PD-1) (BMS-936558/MDX-1106/ONO-4538) in patients with advanced melanoma. Ann Oncol. 2012;23:361. [Google Scholar]
- 8.Lutz ER, Wu AA, Bigelow E, Sharma R, Mo G, Soares K, et al. Immunotherapy converts nonimmunogenic pancreatic tumors into immunogenic foci of immune regulation. Cancer immunology research. 2014;2:616–631. doi: 10.1158/2326-6066.CIR-14-0027. [DOI] [PMC free article] [PubMed] [Google Scholar]
- 9.Azad a, Yin Lim S, D’Costa Z, Jones K, Diana a, Sansom OJ, et al. PD-L1 blockade enhances response of pancreatic ductal adenocarcinoma to radiotherapy. EMBO Mol Med. 2017;9:167–180. doi: 10.15252/emmm.201606674. [DOI] [PMC free article] [PubMed] [Google Scholar]
- 10.F B. Production of Antibodies. Melbourne: Monographs of the Walter and Eliza Hall Institute; 1940. [Google Scholar]
- 11.Stephens AS, Stephens SR, Morrison NA. Internal control genes for quantitative RT-PCR expression analysis in mouse osteoblasts, osteoclasts and macrophages. BMC Res Notes. 2011;4:410. doi: 10.1186/1756-0500-4-410. [DOI] [PMC free article] [PubMed] [Google Scholar]
- 12.Deng L, Liang H, Burnette B, Beckett M, Darga T, Weichselbaum RR, et al. Irradiation and anti-PD-L1 treatment synergistically promote antitumor immunity in mice. J Clin Invest. 2014;124:687–695. doi: 10.1172/JCI67313. [DOI] [PMC free article] [PubMed] [Google Scholar]
- 13.Tao CJ, Chen YY, Jiang F, Feng XL, Jin QF, Jin T, et al. A prognostic model combining CD4/CD8 ratio and N stage predicts the risk of distant metastasis for patients with nasopharyngeal carcinoma treated by intensity modulated radiotherapy. Oncotarget. 2016;7:46653–46661. doi: 10.18632/oncotarget.9695. [DOI] [PMC free article] [PubMed] [Google Scholar]
- 14.Goki Shindo TE, Masamitsu Onda, Shigenori Goto, Yoju Miyamoto, Toru Kaneko. Is the CD4/CD8 Ratio an Effective Indicator for Clinical Estimation of Adoptive Immunotherapy for Cancer Treatment? J Cancer Therap. 2013;4:1382–1390. [Google Scholar]
- 15.Nguyen LT, Ohashi PS. Clinical blockade of PD1 and LAG3--potential mechanisms of action. Nat Rev Immunol. 2015;15:45–56. doi: 10.1038/nri3790. [DOI] [PubMed] [Google Scholar]
- 16.Postow MA, Callahan MK, Barker CA, Yamada Y, Yuan J, Kitano S, et al. Immunologic correlates of the abscopal effect in a patient with melanoma. N Engl J Med. 2012;366:925–931. doi: 10.1056/NEJMoa1112824. [DOI] [PMC free article] [PubMed] [Google Scholar]


