Abstract
Magnetic resonance elastography (MRE) is a constantly advancing technique for assessment of stiffness of tissues with newer technology and sequences. It is being increasingly used for the assessment of liver fibrosis. In this article, we discuss the advantages of MRE over biopsy and noninvasive methods such as US elastography in the assessment of liver fibrosis. Image acquisition and interpretation of liver MRE is also discussed.
Elastography is a method of assessing the mechanical properties of tissues and can be performed with ultrasonography (US) and magnetic resonance imaging (MRI) techniques. Magnetic resonance elastography (MRE) is used to evaluate tissue stiffness in diverse organs such as liver, breast, muscle, kidney, and spleen. It has been proven to be highly sensitive for various clinical applications, particularly in the detection of liver fibrosis (1–3).
Any chronic insult to the liver can cause persistent wound healing resulting in hepatic parenchymal fibrosis. The diagnosis and staging of fibrosis is important for the management of chronic liver disease. Various imaging modalities and blood tests can be used to detect fibrosis (2). The standard method for definitive diagnosis and staging of fibrosis is biopsy. However, besides its well-known risks and complications, it has some limitations such as sampling error and inter- and intraobserver variability, which cause many physicians to refrain from it (1–3).
MRE is a noninvasive alternative of liver biopsy in the detection of fibrosis causing increased hepatic stiffness (3). MRE enables evaluation of etiology and complications of chronic liver disease using standard MRI protocols during the same session of elastography. This method is superior to US elastography since the latter has significant limitations such as operator dependence and measurement difficulties in cases of ascites and severe obesity (2, 3).
In this review, we summarized the current state of understanding on MRE as reported in the literature. We briefly described the procedure, highlighted the strengths and weaknesses of the method and discussed its utility in the assessment of liver fibrosis.
The basic principle of elastography
The elasticity of a material defines its ability to sustain its original size and shape when the material is subjected to deforming force or stress. The change in size or shape known as “strain” is the force exerted on a unit area. Elastography is an imaging technique that monitors and measures the mechanical properties of biological tissues (1–4). Measuring the response of a particular mechanical stimulus is the basic principle of elastography. The stimuli can be static, quasistatic, or dynamic. The examinations with static/quasistatic stimuli provide “strain” images while dynamic mechanical tissue stimulation enables “shear-wave” imaging. Dynamic stimulation can be “transient” or “continuous”. Dynamic stimulus-based techniques use vibrations between 20 Hz and 500 Hz and examine the characteristics of the waves produced by vibrations propagating throughout the tissue. Shear-wave based US elastography (transient) and MRE (continuous) are dynamic stimulation techniques (1–5).
MRE technique
MRE is a method used to characterize the biomechanical properties of tissues such as stiffness (2). In this technique, mechanical shear wave is applied to the tissues. This repulsive acoustic force causes small displacements in the tissue. These displacements, which occur in the horizontal plane, are called “shear waves” (5). If the waves are applied continuously, the propagation speed is reflected in the wavelength. Propagation speed of these waves depends on the medium. As the stiffness of the tissue increases, the wavelength becomes longer (waves travel faster in hard tissues) (3). The biologic property on which measurement is based is the difference in the wavelengths of shear waves propagated through tissue depending on the stiffness of the tissue.
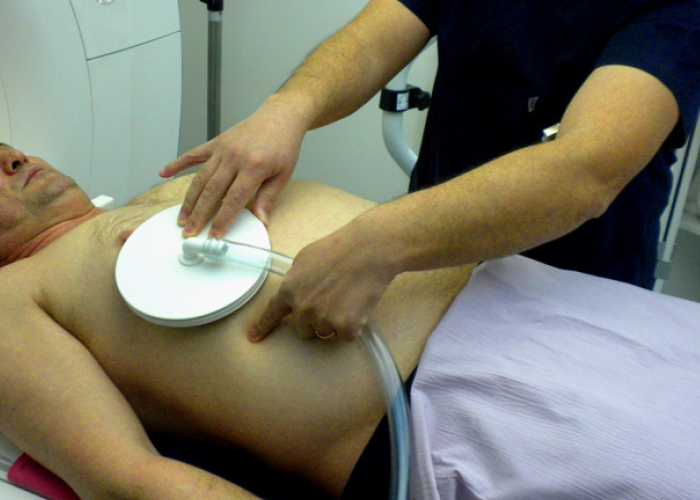
The mechanical waves are produced by a wave generator (also named as active driver), which is located outside the MRI examination room and shielded from the imaging magnet. Based on clinical studies, 60 Hz waves, which are frequently used to provide adequate wave conduction in the tissues, do not compromise the patient comfort. The mechanical waves (vibrational energy; pressure waves) are sent to the passive driver through the flexible plastic connecting tube. The passive driver is placed on the external abdominal wall and is positioned across the lower chest or on the right lobe of the liver (Fig. 1) and secured with soft elastic band to maintain appropriate contact with the right upper quadrant rib cage. In situations when there is anatomic alterations in size or configuration of the liver or when the intestines interpose between the liver and anterior abdominal wall, the position of the driver can be shifted in order to optimize the delivery of the vibrations into the liver. The passive driver transmits acoustic pressure to the abdominal wall and to the liver in the form of shear waves (1–3). The propagating shear waves through the liver are imaged with modified phase-contrast gradient-echo (GRE) sequence, which incorporates cyclic motion-encoding gradients sensitive to through-plane motion. This sequence is called “MRE sequence” (5). The driver system is synchronized to these gradients by means of a trigger in the MRI scanner (1–3, 5).
Figure 1.
Disc-shaped passive driver. Its flat surface touching the patient is made of drum-like elastic membrane. Plastic connecting tube transports the acoustic wave originating from the generator, known as the active driver (not shown) which is located outside the MRI examination room, to the passive driver. Passive driver is placed over the liver and held in place by an elastic binder. Continuous low frequency (60 Hz) vibrations are delivered into the liver from the surface of lower rib cage.
Generally four axial slices at different anatomic levels of the liver are acquired with modified GRE sequence. The sequence parameters used in our 1.5T MRI system (Siemens, MAGNETOM Aera) are as follows: repetition time (TR)/echo time (TE), 50/21.1 ms; flip angle 25°; bandwidth 250 Hz/pixel; field-of-view (FOV), 400×400; matrix, 128×48; NEX, 1; slice thickness, 10 mm. The scanning time of each axial slice is 17 seconds with breath-hold.
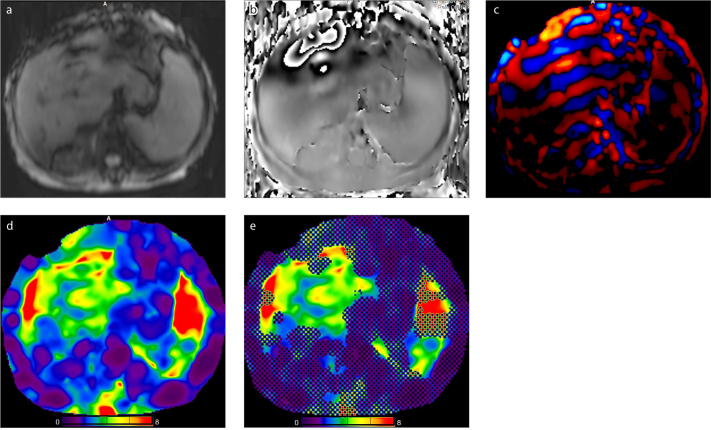
The tissue displacement at the nanometer or micrometer level is measured by the MRE sequence. Two groups of raw images, magnitude and phase images (Fig. 2a, 2b), are obtained which give information about the progression of the “shear waves” in the liver. Magnitude and phase images are automatically processed using an inversion algorithm to generate a two-dimensional (2D) displacement map called “wave image” (Fig. 2c) and a 2D gray or color code map called “elastogram” (Fig. 2d) in which the liver stiffness is measured (6, 7).
Figure 2. a–e.
MRE images of a 68-year-old woman with chronic liver diasease. Magnitude image (a), phase image (b), wave image (c), color-coded elastogram (d), and confidence map (e). Liver tissue stiffness values are measured on confidence map by drawing largest possible ROIs on four different levels of liver. Cross-hatched regions on confidence map are areas of low-confidence data excluded by the processing algorithm. Nonparenchymal structures (i.e., large vessels, bile ducts, gall bladder) that will affect measurement should be avoided while drawing the ROI. The mean value and range of liver stiffness are reported in units of kPa. The mean hepatic stifness value in this patient is measured as 3.7 kPa (range, 2.80–4.33 kPa). Note also increased stiffness in the splenic parenchyma.
The mechanical property measured by the inversion algorithm is “the magnitude of the complex shear modulus”. This measurement shows both the properties of tissue elasticity and tissue viscosity (i.e., viscoelasticity) in units of kilopascals (kPa). At present, all major vendors offer commercially available elastograms using the same standard color scale of 0–8 kPa. In some imaging devices, “confidence maps” (Fig. 2e) with statistically reliable areas corresponding to the regions with adequate wave quality are included (1, 8). Cine studies are obtained by repeatedly imaging the liver at a single slice location and performed using wave images throughout eight different phase offsets.
Interpretation of elastograms
Liver stiffness is assessed by drawing free-hand region of interest (ROI) in the elastograms. The ROIs should be placed in areas with adequate wave amplitude. The edge of the liver should not be approached more than half a wavelength as it may cause edge effects. Hot spots (coded with red color), which are typically found under the passive driver, should be excluded. In addition, special care should be taken when placing an ROI to avoid regions of wave interference, large vessels (> 3 mm), severely dilated bile ducts, gallbladder fossa, widened liver fissures, and obvious image artifacts within the liver. Mean stiffness from each ROI is obtained. Mean value obtained from four different levels of the liver and range of measurements are reported (1, 3).
In normal livers, the wavelength is shorter and stiffness values measured from the elastograms are lower (Fig. 3). Because of the relatively rapid attenuation of the waves in soft hepatic tissue, propagation depth into the parenchyma is restricted and, consequently, smaller regions of confidence may be encountered in normal nonfibrotic livers. In fibrotic and cirrhotic liver, the wavelength is longer and stiffness values of liver parenchyma are higher (9–15) (Fig. 4).
Figure 3. a–c.
An 81-year-old woman with postcholecystectomy syndrome. T2-weighted image (a), wave image (b), and elastogram (c). Elastogram in this subject with a normal liver showed mean shear stiffness value of 2.27 kPa.
Figure 4. a–c.
A 62-year-old woman with hepatitis B virus infection. T2-weighted image (a), wave image (b), and elastogram (c). Measurements from the elastogram revealed elevated stiffness values with a mean of 6.20 kPa consistent with Stage 4 fibrosis.
Liver fibrosis and diagnostic methods
Liver fibrosis is caused by excessive accumulation of extracellular matrix proteins. This accumulation results in the induction of hepatocyte necroinflammation and the differentiation of hepatic stellate cells into myofibroblasts. Necroinflammation is a response to wound healing developed against liver damage in some liver diseases (16). Viral hepatitis (B, C, delta), excessive alcohol consumption, nonalcoholic fatty liver disease (NAFLD), autoimmune hepatitis, some metabolic and genetic diseases are among the causes leading to hepatic fibrosis (17, 18). In early stages, fibrosis can be reversible. Early detection of fibrosis is therefore of great importance in the management of chronic liver disease (1–4, 9–11, 17). Untreated fibrosis cases progress to cirrhosis and complications such as portal hypertension (cirrhosis-related varices, variceal hemorrhages, ascites) and hepatocellular carcinoma (HCC) can develop (9).
NAFLD is the most common liver disease in western countries and affects approximately 10%–30% of the general population (19). Its prevalence is expected to increase due to the rising incidence of obesity and type 2 diabetes mellitus (20, 21). The disease encompasses conditions ranging from simple steatosis to more progressive steatosis with necroinflammation (nonalcoholic steatohepatitis, NASH), fibrosis, and cirrhosis. Most patients have “simple steatosis” which has a relatively favorable course. Progression to NASH and further advancement to fibrosis may be observed in about 25% of patients with NAFLD (20, 22, 23).
Liver biopsy is the gold standard method for the detection and staging of fibrosis. However, there are limitations to this method such as assessment of very small volume of parenchyma, the possibility of sampling errors, low reproducibility, and variability among the observers (24–26). In addition, it is an invasive method carrying severe complication risks including death, which reduces its preference by patients and doctors (27).
Noninvasive conventional imaging modalities such as US, CT, and MRI may show morphologic changes due to chronic liver disease. However, these methods are not successful in detecting early stage fibrosis and are not suitable for staging fibrosis (28). A variety of direct (procollagens, matrix metalloproteinases, cytokines, chemokines) and indirect (thrombocyte count, prothrombin time, albumin, total bilirubin, serum aminotransferase levels, hyaluronic acid and α2-macroglobulin levels) blood markers can be used to assess fibrosis. The advantages of serum tests are that they are readily available, cost effective and can be used for follow-up. However, their specificity is low and cannot sufficiently reflect the complicated pathophysiologic status of the liver (29, 30). US elastography is a relatively new and efficient method for evaluating liver fibrosis. The main clinical indication for liver elastography is the noninvasive detection and staging of fibrosis, follow-up and monitorization of the therapeutic response of fibrosis and assessment of portal hypertension (31). In US elastography, the “shear wave” speed and the measured stiffness of the tissue depend on the applied frequency of the wave (32). The results are also highly operator dependent and subject to interpretive error; measurements can vary, even in the same patient. Furthermore, the reliability of US elastography can be low in cases presenting with hepatodiaphragmatic interposition of the bowel, ascites, narrow intercostal space, and obesity (1, 3, 13, 33).
In the acoustic radiation force impulse (ARFI) elastography technique, the shear waves that stimulate the target tissue are generated within a fixed-size ROI placed on an operator-selected conventional gray-scale US image (34). Due to the short-duration acoustic radiation forces, localized displacements are generated in a selected ROI, not requiring any external compression. Hence, it is expected to be a less operator-dependent method of assessing stiffness of the liver tissue (35). No significant difference was found between ARFI elastography and transient elastography (TE) when the accuracy rates were compared (36). Failure rates for ARFI elastography measurements are significantly lower than for TE (36, 37). In addition, since ROIs can be positioned on the elastograms at two planes, the measurements are less affected by the presence of ascites and obesity thereby reducing some of the sampling errors that can occur with TE. ARFI elastography, when correlated with Child-Pugh scores and liver function tests, is more successful than the scoring system based on visual assessment of conventional images (38). When entegrated with B mode US, ARFI elastography provides more reliable measurement results than TE and has similar diagnostic efficacy with TE in detecting significant fibrosis and cirrhosis (36).
MRE is considered to be the most reliable noninvasive method for the detection and staging of liver fibrosis (3, 39, 40). Stiffness values of the liver obtained by MRE are reproducible and show excellent aggrement between practitioners (41–43). In a meta-analysis evaluating the reproducibility of hepatic MRE, Serai et al. (44), suggested that the measured change in hepatic stiffness of 22% or greater, at the same site and with use of the same device and acquisition parameters, indicates that a true change in stiffness has occurred with 95% confidence (44). Stiffness measurements can be performed from almost every part of the liver parenchyma if adequate wave quality is obtained. The possibility of sampling a large volume of parenchyma increases the accuracy of this technique. Moreover, unlike US elastography, reliable results can be obtained in obese patients and in patients with ascites (9, 40, 45).
Clinical applications of MRE in the liver
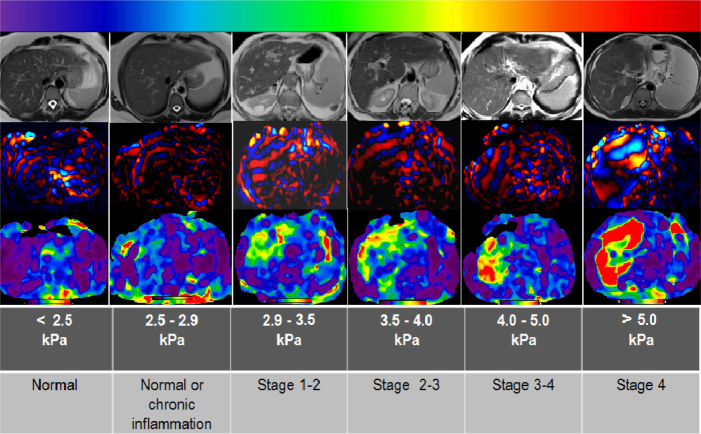
The stiffness value of normal liver parenchyma is less than 2.5 kPa (1, 13). MRE measurement of higher stiffness values can diagnose hepatic fibrosis with high sensitivity and specificity. The mean liver stiffness values in living donors have been reported to range from 2.05 to 2.12 kPa and not differ significantly for either gender or age (42). The stiffness is increased in proportion to the histologic grade of fibrosis. Different grades of fibrosis can also be differentiated with MRE (1, 3, 13) (Fig. 5). Studies have shown that early stages of liver fibrosis, which cannot be detected by routine imaging, can be demonstrated by MRE (9, 46, 47). In a study reported by Yin et al. (9), it is shown that the sensitivity and specificity of MRE in detecting all grades of liver fibrosis was greater than 95% (9). According to a meta-analysis of 12 studies including 697 patients with chronic liver disease, MRE shows high diagnostic performance for staging fibrosis. The area under receiving characteristic curve (AUC) is 0.93 for discriminating advanced fibrosis (≥stage 3). MRE’s performance for diagnosis of significant (≥ stage 2) and any fibrosis (≥ stage 1) is also good (AUC, 0.84–0.88). The optimal cutoff values of MRE for diagnosis of any, significant and advanced fibrosis and cirrhosis were derived from the pooled analysis of patients with chronic liver disease and were found as 3.45, 3.66, 4.11, and 4.71 kPa, respectively (35). Wang et al. (10) reported high sensitivity and specificity values for MRE to predict fibrosis scores ≥F2 (91% and 97%), scores ≥F3 (92% and 95%), and scores F4 (95% and 87%). In the same study, the cutoff values of 5.37 kPa and 5.97 kPa were determined to identify fibrosis stage ≥2 and stage ≥3, respectively (10).
Figure 5.
Relationship between MRE-measured stiffness of the liver and the stage of hepatic fibrosis. MRE can be used to stage fibrosis in various diffuse liver diseases. For example, in this figure, the patient with stage 1–2 fibrosis has primary biliary cirrhosis and the patient with stage 4 fibrosis has primary sclerosing cholangitis. The patients with stage 2–3 and 3–4 fibrosis have hepatitis B virus infection. In color-coded elastogram, relative tissue stiffness is shown on a color scale, ranging from softest (0 kPa; color-coded with purple) to hardest (8 kPa; color-coded with red). The stiffness values correlated with the stage of fibrosis that we used in this figure were obtained from Table 3 in Srinivasa Babu et al. (1).
The degree, pattern, distribution and extent of fibrosis can vary depending on the etiology of chronic liver disease. For this reason, the thresholds used to determine the degree of fibrosis may also vary depending on the etiology. Detecting effective threshold values for different etiologies will be useful in standardizing the MRE technique. An increase in parenchymal stiffness can be seen in cases of acute inflammation without association of fibrosis (48). Prior injection of gadolinium chelate compound does not seem to influence liver stiffness significantly (1).
Liver fibrosis is not always homogeneous. This explains the sampling errors that can be seen in biopsy (49). MRE can detect heterogeneous involvement pattern of fibrosis in the liver parenchyma and reveal early fibrotic changes, which are often missed by biopsy due to the limited sampling area. MRE can also be used with the aim of guiding biopsy (50). Another advantage of MRI compared with liver biopsy is its all-in-one evaluation capability. MRE technique is usually well tolerated by patients. In addition to MRE sequence, a routine liver protocol can be implemented during the examination. Especially, in living liver donor candidates, combined use of MRE and MRI fat quantification can potentially reduce the necessity of routine liver biopsies by providing information regarding the risk of substantial macrovesicular hepatic steatosis or hepatic fibrosis (51). In this way, MRI can provide a comprehensive one-stop evaluation, thereby shortening the preoperative work-up process in donor candidates.
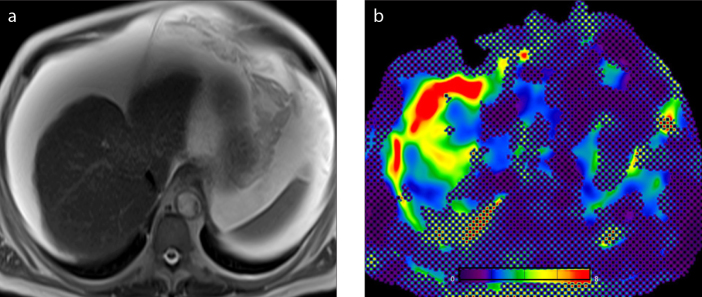
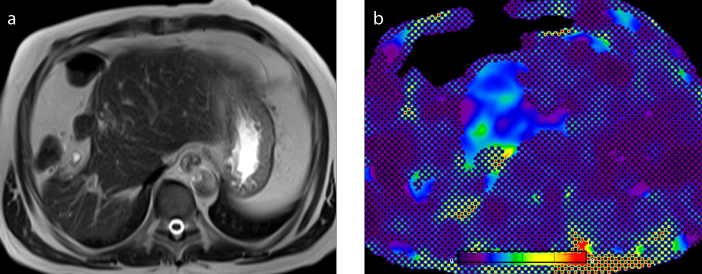
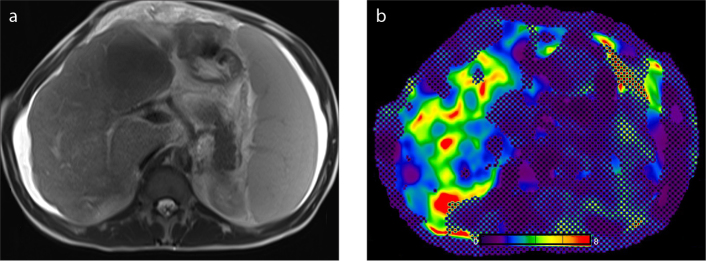
Obesity, ascites (Fig. 6), and hepatodiaphragmatic interposition of the bowel loops (Fig. 7), which limit the use of US elastography, do not affect the MRE study (3). Fatty infiltration alone does not increase the liver stiffness in NAFLD (9) (Fig. 8). However, if steatohepatitis develops, an increase in liver stiffness is seen even before the onset of fibrosis (52) (Fig. 9). The other confounding factors that can alter liver stiffness are hepatic vascular congestion (Fig. 10), cholestasis (Fig. 11), amyloidosis (53), and fasting status (1, 13).
Figure 6. a, b.
A 68-year-old man with chronic liver disease. T2-weighted image (a) shows atrophic liver and massive ascites. The presence of ascites did not seem to influence the data acquisition in this patient. Confidence map (b) outlines the hepatic areas with sufficient wave propagation. There is considerable amount of liver parenchyma outside the cross-hatching marks from which stiffness measurements can be made.
Figure 7. a, b.
A 58-year-old man with Chilaiditi syndrome. T2-weighted image (a) shows a portion of the colon abnormally interposed between the liver and the diaphragm. The passive driver was shifted to left in order to optimize the delivery of the vibrations into the liver. Shear waves have adequate hepatic penetration in the left lobe. Normal hepatic stiffness (color-coded with blue) can be seen on confidence map (b).
Figure 8. a–c.
A 55-year-old woman with nonalcoholic fatty liver disease. According to HISTO sequence analysis (MR spectroscopy not shown) and fat fraction parametric map (a), fat signal fraction rates are elevated, 13.2% and 12.9%, respectively. Panel (b) shows the wave image. Elastogram (c) determined mean stiffness as 2.22 kPa which is within normal limits. Simple steatosis does not have a significant effect on stiffness values.
Figure 9. a–c.
A 58-year-old woman with nonalcoholic steatohepatitis (NASH). According to HISTO sequence analysis (MR spectroscopy not shown) and fat fraction map (a), fat signal fraction rates are 13.8% and 13.4%, respectively. Panel (b) shows the wave image and panel (c) shows the elastogram. This patient had a mean liver stiffness of 3.10 kPa (range, 2.25–4.49 kPa). Biopsy showed steatohepatitis index as: steatosis +++, and inflammation ++. Necroinflammatory activity in NASH increases the hepatic stiffness values.
Figure 10. a, b.
A 31-year-old man with Budd-Chiari syndrome. T2-weighted image (a) shows atrophy of the right liver lobe, hepatic contour nodularity, splenomegaly, and ascites. Elastogram (b) revealed mean shear stiffness value of 2.95 kPa. Hepatic venous congestion is one of the confounders, which elevates liver stiffness and may lead to overestimation of fibrosis stage.
Figure 11. a–c.
A 65-year-old woman with high cholestasis parameters. T2-weighted image (a) shows severe dilatation of intrahepatic bile ducts. Panel (b) shows wave image. Mean stiffness value of 5.20 kPa was obtained from the elastograms (c).
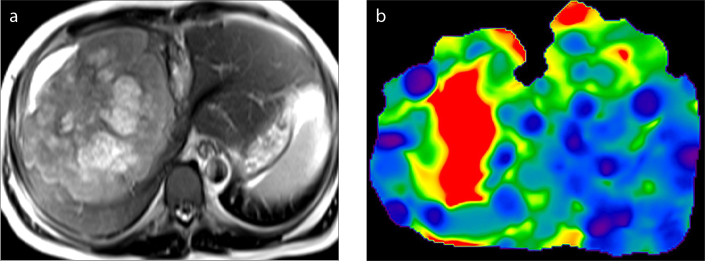
MRE can also be used for characterization of liver tumors. In benign tumors, the stiffness values are similar to or lower than that of the parenchyma, whereas in malign tumors, the stiffness values are higher (Fig. 12). In the study conducted by Venkatesh et al. (54), the stiffness values of the malignant masses were found to be greater than 5 kPa. In a preliminary study conducted by Thompson et al. (55), it was shown that there might be a relationship between histopathologic grading of HCC and the tumor stiffness. The authors noted that poorly differentiated HCCs tend to have higher stiffness than that of well- and moderately differentiated HCCs.
Figure 12. a, b.
A 38-year-old man with biopsy-proven adenocarcinoma metastasis. T2-weighted image (a) shows a large heterogeneous mass with lobulated contours, measuring 20×14×12 cm at its widest part, and involving almost all of the right lobe of the liver. Elastogram (b) reveals high shear stiffness (6.7 kPa; color-coded with red) within the tumor.
MRE has several limitations despite its considerable advantages over the other methods (39). During the MRE, patients need to hold their breath. For this reason, it is very important that respiratory cooperation of the patient is ensured in order to optimize the imaging. In addition to repeated patient breath holds, this method is not suitable for patients who cannot lie still or have claustrophobia. Furthermore, its worldwide availability is limited for use in routine practice.
The most frequent reason for technical failure in MRE is iron overload of the liver tissue. In diseases that lead to moderate-to-severe hepatic iron deposition such as hemochromatosis or hemosiderosis, MRI signals may be too low. The reason for the low signal-to-noise ratio is that the commercially available sequences in the MRE applications are generally GRE sequences which are prone to T2* shortening due to iron overload (56). Kim et al. (57) reported that spin echo echo-planar imaging in patients with iron deposition is more successful than GRE imaging (57).
Conclusion
Early detection and staging of liver fibrosis is of clinical importance. Although currently biopsy-based assessment remains the standard reference, MRE can be used as a noninvasive alternative to liver biopsy in detecting the presence and extent of fibrosis as well as in monitoring its response to therapy. Repeated assessments can be performed, without safety concerns. It has several advantageous aspects compared with biopsy such as high reproducibility and less sampling errors originating from uneven distribution of fibrosis in the liver or the small size of the specimen. It can be used satisfactorily in subjects with Chiliaditi syndrome and patients with ascites, and allows the evaluation of morphologic changes of chronic liver disease with routine MRI sequences added to the elastography examination protocol.
Main points.
Magnetic resonance elastography (MRE) is a phase-contrast MRI technique that is used to noninvasively and quantitatively assess tissue stiffness.
MRE has proven to be a robust, reproducible and reliable method for detection and staging of liver fibrosis caused by many different chronic liver diseases.
MRE can be implemented onto a conventional MRI system with a few hardware and software modifications.
By measuring the wavelenghts of the shear waves, it is possible to calculate the tissue viscoelasticity, which is expressed in units of kilopascals.
Ascites, hepatodiaphragmatic interposition of the bowel loops, and obesity which limit the use of US elastography, do not seem to affect the MRE examination.
Acknowledgements
Authors would like to thank Onur Ozyurt PhD, Telemed A.Ş., for providing technical hardware and software support related to MRE and the MRI technologists of MRI department of İbn-i Sina Hospital, Ankara University, for their effort in MRI data acquisition.
Footnotes
Conflict of interest disclosure
The authors declared no conflicts of interest.
References
- 1.Srinivasa Babu A, Wells ML, Teytelboym OM, et al. Elastography in chronic liver disease: modalities, techniques, limitations, and future directions. Radiographics. 2016;36:1987–2006. doi: 10.1148/rg.2016160042. [DOI] [PMC free article] [PubMed] [Google Scholar]
- 2.Chen J, Yin M, Glaser KJ, Talwalkar JA, Ehman RL. MR Elastography of liver disease: state of the art. Appl Radiology. 2013;42:5–12. [PMC free article] [PubMed] [Google Scholar]
- 3.Venkatesh SK, Yin M, Ehman RL. Magnetic resonance elastography of liver: technique, analysis, and clinical applications. J Magn Reson Imaging. 2013;37:544–555. doi: 10.1002/jmri.23731. [DOI] [PMC free article] [PubMed] [Google Scholar]
- 4.Gennisson JL, Deffieux T, Fink M, Tanter M. Ultrasound elastography: principles and techniques. Diagn Interv Imaging. 2013;94:487–495. doi: 10.1016/j.diii.2013.01.022. [DOI] [PubMed] [Google Scholar]
- 5.Muthupillai R, Lomas DJ, Rossman PJ, Greenleaf JF, Manduca A, Ehman RL. Magnetic resonance elastography by direct visualization of propagating acoustic strain waves. Science. 1995;269:1854–1857. doi: 10.1126/science.7569924. [DOI] [PubMed] [Google Scholar]
- 6.Kwon OI, Park C, Nam HS, et al. Shear modulus decomposition algorithm in magnetic resonance elastography. IEEE Trans Med Imaging. 2009;28:1526–1533. doi: 10.1109/TMI.2009.2019823. [DOI] [PMC free article] [PubMed] [Google Scholar]
- 7.Oliphant TE, Manduca A, Ehman RL, Greenleaf JF. Complex-valued stiffness reconstruction for magnetic resonance elastography by algebra-ic inversion of the differential equation. Magn Reson Med. 2001;45:299–310. doi: 10.1002/1522-2594(200102)45:2<299::aid-mrm1039>3.0.co;2-o. [DOI] [PubMed] [Google Scholar]
- 8.Silva AM, Grimm RC, Glaser KJ, et al. Magnetic resonance elastography: evaluation of new inversionalgorithm and quantitative analysis method. Abdom Imaging. 2015;40:810–817. doi: 10.1007/s00261-015-0372-5. [DOI] [PubMed] [Google Scholar]
- 9.Yin M, Talwalkar JA, Glaser KJ, et al. Assessment of hepatic fibrosis with magnetic resonanceelastography. Clin Gastroenterol Hepatol. 2007;5:1207–1213.e2. doi: 10.1016/j.cgh.2007.06.012. [DOI] [PMC free article] [PubMed] [Google Scholar]
- 10.Wang Y, Ganger DR, Levitsky J, et al. Assessment of chronic hepatitis and fibrosis: comparisonof MR elastography and diffusion-weightedimaging. AJR Am J Roentgenol. 2011;196:553–561. doi: 10.2214/AJR.10.4580. [DOI] [PMC free article] [PubMed] [Google Scholar]
- 11.Talwalkar JA, Yin M, Fidler JL, Sanderson SO, Kamath PS, Ehman RL. Magnetic resonance imaging of hepatic fibrosis: emerging clinical applications. Hepatology. 2008;47:332–342. doi: 10.1002/hep.21972. [DOI] [PubMed] [Google Scholar]
- 12.Bensamoun SF, Wang L, Robert L, et al. Measurement of liver stiffness with two imagingtechniques: magnetic resonance elastographyand ultrasound elastometry. J Magn Reson Imaging. 2008;28:1287–1292. doi: 10.1002/jmri.21523. [DOI] [PubMed] [Google Scholar]
- 13.Venkatesh SK, Wells ML, Miller FH, et al. Magnetic resonance elastography: beyond liverfibrosis-a case-based pictorial review. AbdomRadiol (NY) 2018;43:1590–1611. doi: 10.1007/s00261-017-1383-1. [DOI] [PMC free article] [PubMed] [Google Scholar]
- 14.Huwart L, Sempoux C, Salameh N, et al. Liver fibrosis: noninvasive assessment with MRelastography versus aspartate aminotransferase-to-platelet ratio index. Radiology. 2007;245:458–466. doi: 10.1148/radiol.2452061673. [DOI] [PubMed] [Google Scholar]
- 15.Asbach P, Klatt D, Hamhaber U, et al. Assessment of liver viscoelasticity using multifrequency MR elastography. Magn Reson Med. 2008;60:373–379. doi: 10.1002/mrm.21636. [DOI] [PubMed] [Google Scholar]
- 16.Gressner OA, Weiskirchen R, Gressner AM. Evolving concepts of liver fibrogenesis provide new diagnostic and therapeutic options. Comp Hepatol. 2007;6:7. doi: 10.1186/1476-5926-6-7. [DOI] [PMC free article] [PubMed] [Google Scholar]
- 17.Friedman SL, Bansal MB. Reversal of hepaticfibrosis -- fact or fantasy? Hepatology. 2006;43:S82–88. doi: 10.1002/hep.20974. [DOI] [PubMed] [Google Scholar]
- 18.Albanis E, Friedman SL. Antifibrotic agents for liver disease. Am J Transplant. 2006;6:12–19. doi: 10.1111/j.1600-6143.2005.01143.x. [DOI] [PubMed] [Google Scholar]
- 19.Younossi ZM, Koenig AB, Abdelatif D, Fazel Y, Henry L, Wymer M. Global epidemiology of nonalcoholic fatty liver disease-Meta-analytic assessment of prevalence, incidence, and outcomes. Hepatology. 2016;64:73–84. doi: 10.1002/hep.28431. [DOI] [PubMed] [Google Scholar]
- 20.Ehman RL. Science to practice: can MR elastography be used to detect early steatohepatitis in fatty liver disease? Radiology. 2009;253:1–3. doi: 10.1148/radiol.2531091040. [DOI] [PubMed] [Google Scholar]
- 21.Browning JD, Szczepaniak LS, Dobbins R, et al. Prevalence of hepatic steatosis in an urban population in the United States: impact of ethnicity. Hepatology. 2004;40:1387–1395. doi: 10.1002/hep.20466. [DOI] [PubMed] [Google Scholar]
- 22.Charlton M. Nonalcoholic fatty liver disease: a review of current understanding and future impact. Clin Gastroenterol Hepatol. 2004;2:1048–1058. doi: 10.1016/S1542-3565(04)00440-9. [DOI] [PubMed] [Google Scholar]
- 23.Adams LA, Lymp JF, St Sauver J, et al. The natural history of nonalcoholic fatty liver disease: a population-based cohort study. Gastroenterology. 2005;129:113–121. doi: 10.1053/j.gastro.2005.04.014. [DOI] [PubMed] [Google Scholar]
- 24.Bedossa P, Carrat F. Liver biopsy: the best, not the gold standard. J Hepatol. 2009;50:1–3. doi: 10.1016/j.jhep.2008.10.014. [DOI] [PubMed] [Google Scholar]
- 25.Rockey DC, Caldwell SH, Goodman ZD, Nelson RC, Smith AD. Liver biopsy. Hepatology. 2009;49:1017–1044. doi: 10.1002/hep.22742. [DOI] [PubMed] [Google Scholar]
- 26.Petitclerc L, Sebastiani G, Gilbert G, Cloutier G, Tang A. Liver fibrosis: review of current imaging and MRI quantification techniques. J Magn Reson Imaging. 2017;45:1276–1295. doi: 10.1002/jmri.25550. [DOI] [PubMed] [Google Scholar]
- 27.Sporea I, Popescu A, Sirli R. Why, who and how should perform liver biopsy in chronic liver diseases. World J Gastroenterol. 2008;14:3396–3402. doi: 10.3748/wjg.14.3396. [DOI] [PMC free article] [PubMed] [Google Scholar]
- 28.Faria SC, Ganesan K, Mwangi I, et al. MR imaging of liver fibrosis: current state of the art. Radiographics. 2009;29:1615–1635. doi: 10.1148/rg.296095512. [DOI] [PMC free article] [PubMed] [Google Scholar]
- 29.Stasi C, Milani S. Non-invasive assessment of liver fibrosis: Between prediction/prevention of outcomes and cost-effectiveness. World J Gastroenterol. 2016;22:1711–1720. doi: 10.3748/wjg.v22.i4.1711. [DOI] [PMC free article] [PubMed] [Google Scholar]
- 30.Liu T, Wang X, Karsdal MA, Leeming DJ, Genovese F. Molecular serum markers of liver fibrosis. Biomark Insights. 2012;7:105–117. doi: 10.4137/BMI.S10009. [DOI] [PMC free article] [PubMed] [Google Scholar]
- 31.Sirli R, Sporea I, Popescu A, Danila M. Ultrasound-based elastography for the diagnosis of portal hypertension in cirrhotics. World J Gastroenterol. 2015;21:11542–11551. doi: 10.3748/wjg.v21.i41.11542. [DOI] [PMC free article] [PubMed] [Google Scholar]
- 32.Tang A, Cloutier G, Szeverenyi NM, Sirlin CB. Ultrasound elastography and MR elastography for assessing liver fibrosis: part 1, principles and techniques. AJR Am J Roentgenol. 2015;205:22–32. doi: 10.2214/AJR.15.14553. [DOI] [PMC free article] [PubMed] [Google Scholar]
- 33.de Ledinghen V, Vergniol J, Foucher J, El-Hajbi F, Merrouche W, Rigalleau V. Feasibility of liver transient elastography with FibroScan using a new probe for obese patients. Liver Int. 2010;30:1043–1048. doi: 10.1111/j.1478-3231.2010.02258.x. [DOI] [PubMed] [Google Scholar]
- 34.Nightingale K. Acoustic radiation force impulse (ARFI) imaging: a review. Curr Med Imaging Rev. 2011;7:328–339. doi: 10.2174/157340511798038657. [DOI] [PMC free article] [PubMed] [Google Scholar]
- 35.D’Onofrio M, Crosara S, De Robertis R, et al. Acoustic radiation force impulse of the liver. World J Gastroenterol. 2013;19:4841–4849. doi: 10.3748/wjg.v19.i30.4841. [DOI] [PMC free article] [PubMed] [Google Scholar]
- 36.Bota S, Herkner H, Sporea I, et al. Meta-analysis: ARFI elastography versus transient elastography for the evaluation of liver fibrosis. Liver Int. 2013;33:1138–1147. doi: 10.1111/liv.12240. [DOI] [PubMed] [Google Scholar]
- 37.Cassinotto C, Lapuyade B, Ait-Ali A, et al. Liver fibrosis: noninvasive assessment with acoustic radiation force impulse elastography--comparison with FibroScan M and XL probes and FibroTest in patients with chronic liver disease. Radiology. 2013;269:283–292. doi: 10.1148/radiol.13122208. [DOI] [PubMed] [Google Scholar]
- 38.Zhang D, Li P, Chen M, et al. Non-invasive assessment of liver fibrosis in patients with alcoholic liver disease using acoustic radiation force impulse elastography. Abdom Imaging. 2015;40:723–729. doi: 10.1007/s00261-014-0154-5. [DOI] [PubMed] [Google Scholar]
- 39.Venkatesh SK, Ehman RL. Magnetic resonance elastography of abdomen. Abdom Imaging. 2015;40:745–759. doi: 10.1007/s00261-014-0315-6. [DOI] [PMC free article] [PubMed] [Google Scholar]
- 40.Singh S, Venkatesh SK, Wang Z, et al. Diagnostic performance of magnetic resonance elastography in staging liver fibrosis: a systematic review and meta-analysis of individual participant data. Clin Gastroenterol Hepatol. 2015;13:440–451.e6. doi: 10.1016/j.cgh.2014.09.046. [DOI] [PMC free article] [PubMed] [Google Scholar]
- 41.Venkatesh SK, Wang G, Teo LL, Ang BW. Magnetic resonance elastography of liver in healthy Asians: normal liver stiffness quantification and reproducibility assessment. J Magn Reson Imaging. 2014;39:1–8. doi: 10.1002/jmri.24084. [DOI] [PubMed] [Google Scholar]
- 42.Lee DH, Lee JM, Han JK, Choi BI. MR elastography of healthy liver parenchyma: normal value and reliability of the liver stiffness value measurement. J Magn Reson Imaging. 2013;38:1215–1223. doi: 10.1002/jmri.23958. [DOI] [PubMed] [Google Scholar]
- 43.Lee Y, Lee JM, Lee JE, et al. MR elastography for noninvasive assessment of hepatic fibrosis: reproducibility of the examination and reproducibility and repeatability of the liver stiffness value measurement. J Magn Reson Imaging. 2014;39:326–331. doi: 10.1002/jmri.24147. [DOI] [PubMed] [Google Scholar]
- 44.Serai SD, Obuchowski NA, Venkatesh SK, et al. Repeatability of MR elastography of liver: a meta-analysis. Radiology. 2017;285:92–100. doi: 10.1148/radiol.2017161398. [DOI] [PMC free article] [PubMed] [Google Scholar]
- 45.Cui J, Heba E, Hernandez C, et al. Magnetic resonance elastography is superior to acoustic radiation force impulse for the Diagnosis of fibrosis in patients with biopsy-proven nonalcoholic fatty liver disease: A prospective study. Hepatology. 2016;63:453–461. doi: 10.1002/hep.28337. [DOI] [PMC free article] [PubMed] [Google Scholar]
- 46.Huwart L, Salameh N, ter Beek L, et al. MR elastography of liver fibrosis: preliminary results comparing spin-echo and echo-planar imaging. Eur Radiol. 2008;18:2535–2541. doi: 10.1007/s00330-008-1051-5. [DOI] [PubMed] [Google Scholar]
- 47.Asbach P, Klatt D, Schlosser B, et al. Viscoelasticity-based staging of hepatic fibrosis with multifrequency MR elastography. Radiology. 2010;257:80–86. doi: 10.1148/radiol.10092489. [DOI] [PubMed] [Google Scholar]
- 48.Arena U, Vizzutti F, Corti G, et al. Acute viral hepatitis increases liver stiffness values measured by transient elastography. Hepatology. 2008;47:380–384. doi: 10.1002/hep.22007. [DOI] [PubMed] [Google Scholar]
- 49.Marcellin P, Asselah T, Boyer N. Fibrosis and disease progression in hepatitis C. Hepatology. 2002;36:S47–56. doi: 10.1002/hep.1840360707. [DOI] [PubMed] [Google Scholar]
- 50.Lee VS, Miller FH, Omary RA, et al. Magnetic resonance elastography and biomarkers to assess fibrosis from recurrent hepatitis C in liver transplant recipients. Transplantation. 2011;92:581–586. doi: 10.1097/TP.0b013e31822805fa. [DOI] [PubMed] [Google Scholar]
- 51.Yoon JH, Lee JM, Suh KS, et al. Combined use of MR fat quantification and MR elastography in living liver donors: can it reduce the need for preoperative liver biopsy? Radiology. 2015;276:453–464. doi: 10.1148/radiol.15140908. [DOI] [PubMed] [Google Scholar]
- 52.Chen J, Talwalkar JA, Yin M, Glaser KJ, Sanderson SO, Ehman RL. Early detection of nonalcoholic steatohepatitis in patients with nonalcoholic fatty liver disease by using MR elastography. Radiology. 2011;259:749–756. doi: 10.1148/radiol.11101942. [DOI] [PMC free article] [PubMed] [Google Scholar]
- 53.Peker E, Erden A. T1 mapping and magnetic resonance elastography: potential new techniques for quantification of parenchymal changes in hepatic amyloidosis. Diagn Interv Radiol. 2017;23:478. doi: 10.5152/dir.2017.17240. [DOI] [PMC free article] [PubMed] [Google Scholar]
- 54.Venkatesh SK, Yin M, Glockner JF, et al. MR elastography of liver tumors: preliminary results. AJR Am J Roentgenol. 2008;190:1534–1540. doi: 10.2214/AJR.07.3123. [DOI] [PMC free article] [PubMed] [Google Scholar]
- 55.Thompson SM, Wang J, Chandan VS, et al. MR elastography of hepatocellular carcinoma: correlation of tumor stiffness with histopathology features-preliminary findings. Magn Reson Imaging. 2017;37:41–45. doi: 10.1016/j.mri.2016.11.005. [DOI] [PMC free article] [PubMed] [Google Scholar]
- 56.Taouli B, Ehman RL, Reeder SB. Advanced MRI methods for assessment of chronic liver disease. AJR Am J Roentgenol. 2009;193:14–27. doi: 10.2214/AJR.09.2601. [DOI] [PMC free article] [PubMed] [Google Scholar]
- 57.Kim YS, Song JS, Kannengiesser S, Seo SY. Comparison of spin-echo echoplanar imaging and gradient recalled echo-based MR elastography at 3 Tesla with and without gadoxetic acid administration. Eur Radiol. 2017;27:4120–4128. doi: 10.1007/s00330-017-4781-4. [DOI] [PubMed] [Google Scholar]


