

Abstract
Background
Machine-generated indices based on quantitative electroencephalography (EEG), such as the patient state index (PSI™) and burst-suppression ratio (BSR), are increasingly being used to monitor intraoperative depth of anaesthesia in the endeavour to improve postoperative neurological outcomes, such as postoperative delirium (POD). However, the accuracy of the BSR compared with direct visualization of the EEG trace with regard to the prediction of POD has not been evaluated previously.
Methods
Forty-one consecutive patients undergoing non-cardiac, non-intracranial surgery with general anaesthesia wore a SedLine® monitor during surgery and were assessed after surgery for the presence of delirium with the Confusion Assessment Method. The intraoperative EEG was scanned for absolute minutes of EEG suppression and correlated with the incidence of POD. The BSR and PSI™ were compared between patients with and without POD.
Results
Visual analysis of the EEG by neurologists and the SedLine®-generated BSR provided a significantly different distribution of estimated minutes of EEG suppression (P=0.037). The Sedline® system markedly underestimated the amount of EEG suppression. The number of minutes of suppression assessed by visual analysis of the EEG was significantly associated with POD (P=0.039), whereas the minutes based on the BSR generated by SedLine® were not associated with POD (P=0.275).
Conclusions
Our findings suggest that SedLine® (machine)-generated indices might underestimate the minutes of EEG suppression, thereby reducing the sensitivity for detecting patients at risk for POD. Thus, the monitoring of machine-generated BSR and PSI™ might benefit from the addition of a visual tracing of the EEG to achieve a more accurate and real-time guidance of anaesthesia depth monitoring and the ultimate goal, to reduce the risk of POD.
Key words: depth of anaesthesia, burst-suppression ratio, confusion assessment method, patient state index, postoperative delirium
Editor's key points.
-
•
Occurrence of EEG suppression during anaesthesia is associated with postoperative delirium.
-
•
Commercially available depth-of-anaesthesia monitors commonly indicate the presence of burst suppression automatically.
-
•
The authors compared the minutes of EEG suppression detected by visual EEG analysis and by a commercial monitor.
-
•
The monitor significantly underestimated the amount of EEG suppression.
Postoperative delirium (POD) is common in older surgical patients, with a prevalence ranging from 11 to 60%.1, 2, 3 Postoperative delirium is associated with prolonged hospitalization, increased rates of mortality and morbidity, long-term disability, and increased health-care cost.1,4,5 Studies using intraoperative processed quantitative EEG monitoring suggest that POD can be decreased by maintaining the patient at a lighter level of anaesthesia, implying that POD is related to the depth of anaesthesia.6, 7, 8 In particular, recent studies using machine-generated, processed EEG indices of intraoperative burst suppression (such as the burst-suppression ratio, BSR) indicate that burst suppression is an independent risk factor for POD, but none of these studies examined the raw EEG data.9,10
Two common quantitative EEG indices used to assess the depth of anaesthesia during surgery are the SedLine® Patient State Index (PSI™)11 and the Medtronic/Covidien Bispectral Index™ (BIS™).12 Both quantitative EEG systems use proprietary algorithms to generate a number between 0 and 100, with 100 being associated with wakefulness and 0 with an isoelectric (completely suppressed) EEG. These algorithms are complicated and typically involve a running power analysis of specific frequency bands combined with changes in symmetry and synchronization in various cortical regions.12 Both the SedLine® and BIS™ monitoring systems also generate a second index called the BSR. The BSR represents the percentage of the previous 63 s epoch of EEG recognized as those periods longer than 0.5 s, during which the EEG voltage does not exceed approximately +5 to − 5 μV. The BSR would be 1.0 for an isoelectric EEG signal and 0 for an EEG signal without any isoelectric periods. A burst-suppression pattern on EEG indicates a severe reduction in the brain's neuronal activity and metabolic rate, which puts the patient at risk for acute and subacute delirium and cognitive impairment.9,10,13 Hence, devising accurate, reliable methods to quantify EEG suppression is an important clinical and research problem.
No previous study has evaluated the accuracy of BSR estimating the absolute time spent in complete EEG suppression in comparison with a direct visual analysis of the EEG trace. Hence, we conducted the first observational study to examine the relationship between the incidence of POD and the absolute time spent in EEG suppression as calculated by the machine-generated BSR and as identified through visual inspection of the EEG tracing by two experienced neurologists.
Methods
Participants and characteristics
This prospective, observational cohort study was conducted from May to December 2014 at the University of California San Francisco Medical Center. The study received approval from the institutional review board, and written patient informed consent was obtained. Inclusion criteria were consecutive adult patients (>40 yr of age) who were fluent in English and undergoing major, elective, non-cardiac surgery requiring general anaesthesia, with an expected postoperative hospital stay for ≥72 h. The age cut-off of 40 yr was chosen instead of the commonly used 60–70 yr as part of a pilot study that was also intended to determine whether there was an effect of age on intraoperative burst suppression that might have to be taken into account as part of a larger cohort study.
Patients were excluded if they were undergoing intracranial or neurovascular surgery. The characteristics of the study population are displayed in Table 1. The anaesthetic types and management were not controlled. There was no power analysis because this was a pilot study designed to determine the feasibility of measuring EEG suppression by off-line visual analysis of the EEG tracing compared with the commonly used indices (PSI™ and BSR) provided by the SedLine® monitoring system. Forty-eight patients consented to the study. For seven patients, there were incomplete EEG or POD data, resulting in a total of 41 patients for this analysis.
Table 1.
Patient demographics, baseline characteristics, and results of the 41 patients. BSR, burst-suppression ratio; CNS disease, central nervous system disease, comprising a history of delirium, dementia, depression, seizures, psychiatric disorder, stroke, transient ischaemic attack, or other neurological disorders; PSI, patient state index™; TICS™, Telephone Interview of Cognitive Status instrument
| Variable | Postoperative delirium |
|
|---|---|---|
| Yes | No | |
| Total number | 7 | 34 |
| Age {yr; mean (sd) [range]} | 64 (9.62) [51–81] | 62 (8.47) [44–75] |
| Preoperative TICS™ {mean (sd) [range]} | 31.2 (4.85) [24.2–37.8] | 33.0 (2.90) [27.3–37.8] |
| Sex [% (n)] | ||
| Female | 42.86 (3) | 52.94 (18) |
| Male | 57.14 (4) | 47.06 (16) |
| Ethnicity [% (n)] | ||
| White | 85.71 (6) | 82.35 (28) |
| Not white | 14.29 (1) | 17.65 (6) |
| ASA classification [% (n)] | ||
| II (mild systemic disease) | 42.86 (3) | 44.12 (15) |
| III (severe systemic disease) | 57.14 (4) | 55.88 (19) |
| Surgery type [% (n)] | ||
| Spine | 57.14 (4) | 44.12 (15) |
| Other | 42.86 (3) | 55.88 (19) |
| History of CNS disease [% (n)] | ||
| Yes | 71.43 (5) | 61.76 (21) |
| No | 28.57 (2) | 38.24 (13) |
| Chronic opioids [% (n)] | ||
| Yes | 0 | 4 |
| No | 7 | 30 |
| Intraoperative PSI™ {median (sd)[range]} | 30.85 (9.27) [18.01–40.32] | 31.92 (10.85) |
| [7.22–55.49] | ||
| Intraoperative BSR {median (sd)[range]} | 4.29 (5.35) [0–14] | 3.94 (11.53) |
| [0–60] | ||
| Duration of surgery {h; median (sd)[range]} | 8.4 (2.99) [3.2–12.5] | 3.95 (2.43) |
| [2.2–13.9] | ||
Study protocol and time line
The baseline cognitive status was measured ∼1 week before surgery using the Telephone Interview of Cognitive Status instrument (TICS™), a measure of global cognitive functioning that is highly correlated with the Mini-Mental® State Examination (MMSE®).14
During surgery, the patients were monitored with a SedLine® brain monitor, which uses a four-lead strip placed over the forehead approximating the position of the F7, F8, FP1, and FP2 EEG electrodes of the international 10-20 system. The reference and earth for the EEG recording was placed in the midline, equidistant from electrodes FP1 and FP2. SedLine® records digital EEG waves in a referential montage, displays a number (the PSI™), and also calculates a BSR indicating depth of anaesthesia. The BSR was calculated in real time by the machine using a proprietary algorithm. Non-zero values of BSR indicate burst suppression on a minute-by-minute basis. Specifically, BSR represents the percentage of complete EEG suppression during the past minute, and was updated every 1.2 s. The anaesthetist was blinded to the PSI™ and BSR generated by SedLine® because both numbers are not used routinely for clinical care at our institution. Two board-certified and experienced neurologists (R.Z. and W.M.), who were blinded to the clinical data and the incidence of POD as the primary outcome, analysed the raw EEG tracing (as acquired by the SedLine® monitor) off-line and identified the amount of burst suppression present during each operation.
The patients were assessed daily for the presence of POD on the first 3 days after surgery by trained personnel using the Confusion Assessment Method (CAM).15 The postoperative visits were conducted between 09.00 and 12.00 h at the patients’ bedside. At each time point, the presence of delirium was measured using the CAM via a structured interview.16 The CAM was developed as a screening instrument based on operationalization of Diagnostic and Statistical Manual of Mental Disorders 3rd Edition Revised (DSM-III-R) criteria for use by non-psychiatric clinicians in high-risk settings. This method has a sensitivity of 94–100% and a specificity of 90–95% for delirium. All research personnel administering the CAM were trained based on a detailed manual developed by Inouye and colleagues17 for administration of the CAM. All instances of delirium were validated by a second investigator (J.M.L.), who reviewed a written summary of each patient's response to the structured interview performed by the first investigator and discussed the assessment with that interviewer.
Identification of delirium required the presence of an acute onset and fluctuating course, inattention, and disorganized thinking, altered level of consciousness, or both, as measured by the CAM rating scale. A patient was diagnosed with POD if he or she was considered to be delirious by CAM on any of the 3 days after surgery.
EEG processing and grading
Two fellowship-trained and experienced neurophysiologists (R.Z. and W.M.) independently reviewed the intraoperative EEG traces acquired by the SedLine® monitoring system for the entire duration of the operation and recorded whether or not burst suppression was present. The review was done by examining the EEG in 30 s epochs and assigning a score based on a modified version of the method of Kugler18 for grading EEG-based anaesthesia depth (see Table 2 and Fig. 1A and B for further details). For any epochs where there was disagreement, the neurologists reviewed them together and decided on a consensus score.
Table 2.
Grading anaesthesia depth based on EEG tracings. α, alpha; β, beta; δ, delta; θ, theta
| Stage | Frequency admixture/dominance in EEG per 30 s epoch | Depth of anaesthesia |
|---|---|---|
| A | α (8–12 Hz) and β (13–30 Hz) activity, with intermixed eye movement/blinking and myogenic artifact from talking/swallowing | Not applicable (awake) |
| B | Fast β and θ (4–7 Hz) but rare δ (1–3 Hz) activity | Light |
| C | δ activity for at least 20% but no more than 50% of epoch | Light to moderate |
| D | δ activity for at least 50% of epoch; brief periods of suppression not to exceed 10 s | Moderate |
| E | Burst-suppression pattern, with at least 10 s but no more than 20 s of suppression per epoch | Profound |
| F | Burst-suppression pattern, with at least 20 s of suppression per epoch | Very profound |
Fig 1.

(A) Intraoperative EEG tracing for Stage E, which indicates >10 but <20 s of EEG suppression per 30 s epoch. The FP1 and F7 electrodes overlay the left, while FP2 and F8 overlay the right frontal head region. Sensitivity is measured in microvolts (uv). The space between two dotted lines equals 1 s, and one page represents a 30 s epoch. (B) Intraoperative EEG tracing for Stage F, which indicates >20 s of EEG suppression per 30 s epoch. Details as for (A).
Calculation of absolute minutes of EEG suppression
The neurologists scored an epoch as having a burst-suppression pattern if there was at least 10 s of suppression of the EEG tracing present in a given 30 s epoch. A distinction was made between those epochs that had at least 10 but fewer than 20 s of suppression (Stage E; Fig. 1A) and those epochs that had at least 20 s of suppression (Stage F; Fig. 1B). The total number of minutes of EEG suppression based on the neurologists’ consensus rating was then calculated as follows:
The BSR represents the percentage of the foregoing 63 s of EEG trace that is flatline. The BSR is recalculated every 1.2 s; therefore, calculation of the total number of minutes of EEG suppression as estimated by the SedLine® monitor was obtained posthoc by integration of the BSR curve throughout the entire surgery. Although there are BSR observations every 1 or 2 s (i.e. discrete values), we have to calculate the entire time spent in EEG suppression by adding up the time of EEG suppression in each small time interval between two consecutive BSR observations plus the time of EEG suppression before the first BSR observation.
The specific calculation for seconds of EEG suppression was performed as follows:
where BSR_1 is the first BSR observation and BSR_n the nth/last BSR observation, and diff_(n,n−1) stands for the time (in seconds) between the nth and the (n−1)th BSR observations. The number of minutes of EEG suppression was then calculated from the number of seconds divided by 60.
Statistical analysis
The distributions of minutes of EEG suppression from neurologists’ consensus ratings and SedLine®-generated analysis (i.e. BSR) were assessed for non-normality. Upon determination of non-normality of both distributions, the distributions were compared using the non-parametric related-samples Kendall's coefficient of concordance test. In addition, we determined whether the median of differences in minutes of EEG suppression estimates between the SedLine® and neurologists’ generated ratings was different from zero using the related-samples sign test. In secondary analyses, we determined the association between incident POD and minutes of EEG suppression calculated by each method by computing two separate logistic regression equations, one for each method of computing minutes of EEG suppression. Both equations used the same analytical sample and the same outcome, incident POD (StataCorp. 2011. Stata Statistical Software: Release 12. College Station, TX: StataCorp LP).
Results
Preoperative patient characteristics and intraoperative data are summarized in Table 1. A total of 41 patients completed the study. Seven patients (17.07%) developed POD. Related-samples Kendall's coefficient of concordance revealed that the distribution of minutes of EEG suppression was significantly different for the two methods (P=0.037; Fig. 2). The median of differences between minutes of suppression by the two methods was marginally different from zero (P=0.055). The total minutes of EEG suppression calculated by the SedLine® BSR underestimated the amount of suppression in the POD cohort on average by 47 min (27 vs 74 min in BSR vs the visual analysis group, respectively) and in total by up to 40% (total minutes of EEG suppression calculated from BSR/total minutes of EEG suppression form neurologists’ consensus ratings=0.60). In addition, for patients with vs without POD, the total minutes of EEG suppression calculated from BSR underestimated the amount of EEG suppression by 64 and 21%, respectively. Especially, the minutes of EEG suppression from BSR were greatly underestimated, by 73, 79, and 58%, for patients with the first, second, and third longest minutes of EEG suppression from the neurologists’ ratings among those having POD, respectively. In secondary analyses, we determined that the association between incident POD and the neurologists’ consensus ratings based on visual analysis of the EEG tracing was significant (P=0.039). However, the relationship between incident POD and minutes of EEG suppression calculated from the SedLine® BSR was not significant (P=0.275).
Fig 2.
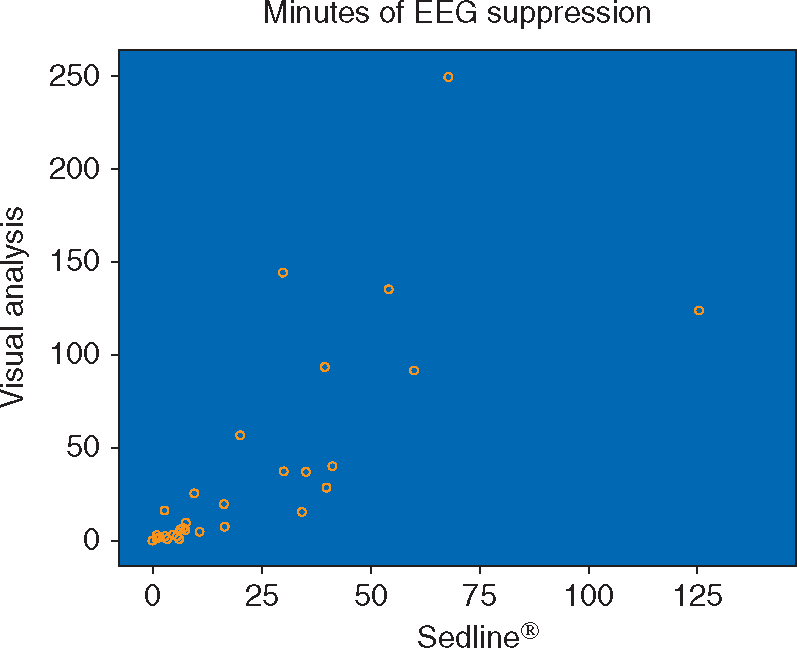
Scatterplot showing how the distribution of minutes of EEG suppression differs between the two methods (i.e. calculation of minutes of suppression through visual analysis of the EEG tracing and based on the SedLine® burst-suppression ratio calculated from a proprietary algorithm).
Discussion
This is the first prospective, observational study to compare neurologists’ estimates of minutes of EEG suppression derived from the visual analysis of raw EEG data with the estimates based on the SedLine® (machine)-generated BSR with regard to the prediction of POD. Our results reveal that compared with neurologists’ consensus ratings, machine-generated estimates underestimated minutes of complete EEG suppression (i.e. flatline EEG). Moreover, the neurologists’, but not SedLine® ratings were significantly associated with incident POD.
Clinical and electrophysiological validation of BIS™, PSI™, and BSR
Both computed quantitative EEG indices (BIS™ and PSI™) were developed retrospectively using the analysis of diagnostic EEG databases of sedated patients.19, 20, 21 Since the approval of BIS™ in 1996 and of PSI™ in 2002, both indices have been independently validated and compared with regard to their ability to predict deep sedation using clinical assessment scores such as the Ramsay Sedation Score or the Modified Observer's Assessment of Alertness/sedation Scale.22, 23, 24, 25, 26, 27, 28 Overall, there appears to be an agreement that both indices predict deep sedation (as defined by clinical scores) equally well, with an average prediction probability of 0.8–0.92 and 0.79–0.86 for PSI™ and BIS™, respectively. Thereby, the average PSI™ values are about 10–15 points lower than BIS™ values. Both scores seem to be more accurate in the context of deep anaesthesia (i.e. mean PSI™ value <26 and mean BIS™ value <40) sustained by i.v. rather than volatile agents.23,27,28 There are some concerns that the wide variation of both indices at lighter stages of anaesthesia leads to false positives (i.e. deeming the patients sedated even if they are not) and that noxious stimuli (i.e. a surgical incision) can significantly alter the BIS™ value in either direction.22,25,26,29 Overall, this makes BIS™ and PSI™ values more reliable in diagnosing over- rather than undersedation.
The relatively few studies that independently validated the accuracy of BIS™ and PSI™ using scalp and intracranial EEG primarily correlated the indices and the BSR with counts of bursts of EEG activity per minute rather than the absolute time spent in EEG suppression (i.e. EEG flatline).30, 31, 32, 33 They all found a strong correlation between burst counts per minute, the BSR, PSI™ values, and BIS™ values, again primarily at stages of deep sedation (i.e. three to six bursts of activity per minute on EEG correlating with mean PSI™ values of <33, BIS™ values of <20, and BSR values of up to 71%).30, 31, 32, 33 This goes along with the finding that BIS™ values have been shown to be linearly correlated with the BSR only beyond a BSR of >40%,21 which emphasizes the importance of using the BSR as an independent variable (rather than an integrated variable as part of the BIS™), in order to guide the depth of anaesthesia during surgery.34
Comparison with previous studies
There are several previous studies that have examined the relationship between anaesthetic depth and the incidence of POD. Most of them measured only the processed EEG using BIS™ solely and did not study burst suppression at all.6, 7, 8 Four studies that used the BIS™ and the related BSR in cardiac surgical patients, critically ill patients, and in adult surgical patients concluded that burst suppression detected by the machine-generated algorithm was associated with increased rates of death at 6 months13 and was an independent risk factor for postoperative or post-coma delirium.9,10,35 The studies that examined the absolute time spent in EEG suppression as a risk factor for POD either calculated the time based on the BSR, which we have demonstrated in the present study can underestimate the time spent in EEG suppression on average by 40% (and in the most extreme situations by up to 79%), or used only intermittent visual inspection of the EEG tracing as fragmented data points and filled in the gaps using linear interpolation.9,10,35
In contrast to previous studies, our study used a continuous visual inspection of the original EEG trace by two trained neurologists throughout the entire duration of surgery as a basis for quantifying the absolute duration of EEG suppression.
Visual analysis of EEG trace as guide for depth of anaesthesia
How feasible is it to train anaesthetists to examine and interpret live EEG tracings during surgery in real time? There are a few single-centre studies looking at exactly that question, and they found that after only a brief structured education session on limited-channel EEG tracings, anaesthetists were able to estimate the BIS™ value with fair accuracy in up to 34% and correctly identify the patient as anaesthetized in >80% simply by looking at the EEG tracings in conjunction with some additional clinical data provided to them (such as vital signs and concentrations of medication).36,37 In fact, the ongoing Electroencephalography Guidance of Anaesthesia to Alleviate Geriatric Syndromes (ENGAGES) trial (a block-randomized, double-blinded, comparative effectiveness trial that investigates various postoperative cognitive outcomes in up to 1232 patients) even has an ‘EEG-guided arm’, in which participating anaesthesia clinicians have been trained to interpret raw EEG waveforms and use their skills to maintain slow-wave anaesthesia and to avoid burst suppression.38
Study limitations
The limitations of our study are the relatively small sample size and the lack of a clear understanding of how BSR is calculated by SedLine®, given that the algorithm was proprietary. It could be that the lack of agreement in minutes of EEG suppression between the two methods was algorithm based.
The main purpose of the present study was to compare two methods for detecting EEG suppression. The small sample size and non-normality of difference scores prevented us from using parametric statistics to compare the two distributions. Instead, we relied on non-parametric tests, which revealed that the two distributions differed. We showed through scatterplots and descriptive analyses that the SedLine® method appears to underestimate minutes of EEG suppression. To provide context for this finding, in secondary analyses we determined the association between EEG suppression and incident POD. We found that only the visual analysis of the EEG trace method of determining minutes of suppression was related to the incidence of POD.
Future studies with larger sample sizes should be conducted to allow parametric testing of the differences in minutes of EEG suppression between the two methods. These studies should consider whether machine-based methods for determining EEG suppression other than SedLine® also differ from neurologists’ visual analysis of the EEG in determining minutes of suppression.
An underlying assumption in this study was that neurologists’ visual analysis was the standard against which to compare the machine-based estimates. Human error could have contributed to the results, but we believe that human error was kept to a minimum because the two board-certified and experienced neurologists were blinded to the clinical data, including incidence of POD. Furthermore, they individually analysed the raw EEG trace off-line and determined the amount of EEG suppression present during each surgery separately. The two neurologists then met to discuss, reanalyse, and resolve any discrepancies in their estimates by consensus.
Conclusion
In conclusion, our study provides evidence that the visual interpretation of the raw EEG tracing rather than a proprietary machine-generated algorithm, such as BSR, might be better at detecting changes in real time with regard to EEG suppression. This finding is important because there is a well-documented association between minutes of EEG suppression and incidence of POD. Hence, the addition of a visual EEG tracing to all intraoperative monitoring systems might help to provide better guidance of the intraoperative anaesthesia and thereby improve postoperative cognitive outcomes.
Authors’ contributions
Study concept: W.M., R.Z., X.Z., J.L.
Study supervision: J.L.
Research data acquisition: T.K., B.R., X.Z.
Data analysis and interpretation: W.M., R.Z., T.K., B.R., L.S., X.Z., J.L., M.Y.
Supervised data analysis and interpretation: L.S.
Drafting of manuscript: W.M., R.Z.
Revision of manuscript for intellectual content: L.S., M.Y., J.L.
Correction of manuscript: X.Z., M.Y., L.S., J.L.
Declaration of interest
None declared.
Funding
US National Institutes of Health (NIH AG048456-01 to J.M.L.).
Handling editor: A. R. Absalom
Contributor Information
W.G. Muhlhofer, Email: wmuhlhofer@uabmc.edu.
R. Zak, Email: rochelle.zak@ucsf.edu.
References
- 1.Saczynski JS, Marcantonio ER, Quach L. Cognitive trajectories after postoperative delirium. N Engl J Med. 2012;367:30–39. doi: 10.1056/NEJMoa1112923. [DOI] [PMC free article] [PubMed] [Google Scholar]
- 2.Bin Abd Razak HR, Yung WYA. Postoperative delirium in patients undergoing total joint arthroplasty: a systematic review. J Arthroplasty. 2015;30:1414–1417. doi: 10.1016/j.arth.2015.03.012. [DOI] [PubMed] [Google Scholar]
- 3.Inouye SK, Westendorp RGJ, Saczynski JS. Delirium in elderly people. Lancet. 2014;383:911–922. doi: 10.1016/S0140-6736(13)60688-1. [DOI] [PMC free article] [PubMed] [Google Scholar]
- 4.Mashour GA, Woodrum DT, Avidan MS. Neurological complications of surgery and anaesthesia. Br J Anaesth. 2015;114:194–203. doi: 10.1093/bja/aeu296. [DOI] [PubMed] [Google Scholar]
- 5.Bilotta F, Lauretta MP, Borozdina A, Mizikov VM, Rosa G. Postoperative delirium: risk factors, diagnosis and perioperative care. Minerva Anestesiol. 2013;79:1066–1076. [PubMed] [Google Scholar]
- 6.Radtke FM, Franck M, Lendner J, Krüger S, Wernecke KD, Spies CD. Monitoring depth of anaesthesia in a randomized trial decreases the rate of postoperative delirium but not postoperative cognitive dysfunction. Br J Anaesth. 2013;110 Suppl 1:i98–105. doi: 10.1093/bja/aet055. [DOI] [PubMed] [Google Scholar]
- 7.Chan MT, Cheng BC, Lee TM, Gin T, CODA Trial Group BIS-guided anesthesia decreases postoperative delirium and cognitive decline. J Neurosurg Anesthesiol. 2013;25:33–42. doi: 10.1097/ANA.0b013e3182712fba. [DOI] [PubMed] [Google Scholar]
- 8.Sieber FE, Zakriya KJ, Gottschalk A. Sedation depth during spinal anesthesia and the development of postoperative delirium in elderly patients undergoing hip fracture repair. Mayo Clin Proc. 2010;85:18–26. doi: 10.4065/mcp.2009.0469. [DOI] [PMC free article] [PubMed] [Google Scholar]
- 9.Soehle M, Dittmann A, Ellerkmann RK, Baumgarten G, Putensen C, Guenther U. Intraoperative burst suppression is associated with postoperative delirium following cardiac surgery: a prospective, observational study. BMC Anesthesiol. 2015;15:61. doi: 10.1186/s12871-015-0051-7. [DOI] [PMC free article] [PubMed] [Google Scholar]
- 10.Fritz BA, Kalarickal PL, Maybrier HR. Intraoperative electroencephalogram suppression predicts postoperative delirium. Anesth Analg. 2016;122:234–242. doi: 10.1213/ANE.0000000000000989. [DOI] [PMC free article] [PubMed] [Google Scholar]
- 11.Drover D, Ortega HR. Patient state index. Best Pract Res Clin Anaesthesiol. 2006;20:121–128. doi: 10.1016/j.bpa.2005.07.008. [DOI] [PubMed] [Google Scholar]
- 12.Rampil IJ. A primer for EEG signal processing in anesthesia. Anesthesiology. 1998;89:980–1002. doi: 10.1097/00000542-199810000-00023. [DOI] [PubMed] [Google Scholar]
- 13.Watson PL, Shintani AK, Tyson R, Pandharipande PP, Pun BT, Ely EW. Presence of electroencephalogram burst suppression in sedated, critically ill patients is associated with increased mortality. Crit Care Med. 2008;36:3171–3177. doi: 10.1097/CCM.0b013e318186b9ce. [DOI] [PMC free article] [PubMed] [Google Scholar]
- 14.Brandt J, Spencer M, Folstein M. The telephone interview for cognitive status. Cognit Behav Neurol. 1988;1:111–118. [Google Scholar]
- 15.Wei LA, Fearing MA, Sternberg EJ, Inouye SK. The Confusion Assessment Method: a systematic review of current usage. J Am Geriatr Soc. 2008;56:823–830. doi: 10.1111/j.1532-5415.2008.01674.x. [DOI] [PMC free article] [PubMed] [Google Scholar]
- 16.Leung JM, Sands LP, Lim E, Tsai TL, Kinjo S. Does preoperative risk for delirium moderate the effects of postoperative pain and opiate use on postoperative delirium? Am J Geriatr Psychiatry. 2013;21:946–956. doi: 10.1016/j.jagp.2013.01.069. [DOI] [PMC free article] [PubMed] [Google Scholar]
- 17.Inouye SK, Van Dyck CH, Alessi CA, Balkin S, Siegal AP, Horwitz RI. Clarifying confusion: the confusion assessment method: a new method for detection of delirium. Ann Intern Med. 1990;113:941–948. doi: 10.7326/0003-4819-113-12-941. [DOI] [PubMed] [Google Scholar]
- 18.Kugler J. Elektroenzephalographie in Klinik und Praxis: eine Einführung. Thieme; Stuttgart, Germany: 1981. [Google Scholar]
- 19.Drover D, Ortega HRR. Patient state index. Best Pract Res Clin Anaesthesiol. 2006;20:121–128. doi: 10.1016/j.bpa.2005.07.008. [DOI] [PubMed] [Google Scholar]
- 20.Health Quality Ontario Bispectral index monitor: an evidence-based analysis. Ont Health Technol Assess Ser. 2004;4:1–70. [PMC free article] [PubMed] [Google Scholar]
- 21.Bruhn J, Bouillon TW, Shafer SL. Bispectral index (BIS) and burst suppression: revealing a part of the BIS algorithm. J Clin Monit Comput. 2000;16:593–596. doi: 10.1023/A:1012216600170. [DOI] [PubMed] [Google Scholar]
- 22.Paliwal B, Rai P, Kamal M. Comparison between dexmedetomidine and propofol with validation of bispectral index for sedation in mechanically ventilated intensive care patients. J Clin Diagn Res. 2015;9:UC01. doi: 10.7860/JCDR/2015/14474.6258. [DOI] [PMC free article] [PubMed] [Google Scholar]
- 23.Schneider G, Heglmeier S, Schneider JÃ, Tempel G, Kochs EF. Patient State Index (PSI) measures depth of sedation in intensive care patients. Intensive Care Med. 2004;30:213–216. doi: 10.1007/s00134-003-2092-5. [DOI] [PubMed] [Google Scholar]
- 24.Lee KH, Kim YH, Sung YJ, Oh MK. The Patient State Index is well balanced for propofol sedation. Hippokratia. 2015;19:235–238. [PMC free article] [PubMed] [Google Scholar]
- 25.Adesanya AO, Rosero E, Wyrick C, Wall MH, Joshi GP. Assessing the predictive value of the bispectral index vs patient state index on clinical assessment of sedation in postoperative cardiac surgery patients. J Crit Care. 2009;24:322–328. doi: 10.1016/j.jcrc.2008.11.004. [DOI] [PubMed] [Google Scholar]
- 26.Schneider G, Gelb AW, Schmeller B, Tschakert R, Kochs E. Detection of awareness in surgical patients with EEG-based indices—bispectral index and patient state index. Br J Anaesth. 2003;91:329–335. doi: 10.1093/bja/aeg188. [DOI] [PubMed] [Google Scholar]
- 27.Soehle M, Kuech M, Grube M. Patient state index vs bispectral index as measures of the electroencephalographic effects of propofol. Br J Anaesth. 2010;105:172–178. doi: 10.1093/bja/aeq155. [DOI] [PubMed] [Google Scholar]
- 28.Soehle M, Ellerkmann RK, Grube M. Comparison between bispectral index and patient state index as measures of the electroencephalographic effects of sevoflurane. J Am Soc Anesthesiol. 2008;109:799–805. doi: 10.1097/ALN.0b013e3181895fd0. [DOI] [PubMed] [Google Scholar]
- 29.Hagihira S. Changes in the electroencephalogram during anaesthesia and their physiological basis. Br J Anaesth. 2015;115:i27–i31. doi: 10.1093/bja/aev212. [DOI] [PubMed] [Google Scholar]
- 30.Riker RR, Fraser GL, Wilkins ML. Comparing the bispectral index and suppression ratio with burst suppression of the electroencephalogram during pentobarbital infusions in adult intensive care patients. Pharmacotherapy. 2003;23:1087–1093. doi: 10.1592/phco.23.10.1087.32766. [DOI] [PubMed] [Google Scholar]
- 31.Arbour RB, Dissin J. Predictive value of the bispectral index for burst suppression on diagnostic electroencephalogram during drug-induced coma. J Neurosci Nurs. 2015;47:113–122. doi: 10.1097/JNN.0000000000000124. [DOI] [PubMed] [Google Scholar]
- 32.Ramírez MIG, Rodríguez-Arias LR, Santiago AO. Correlation between bispectral index and electrocorticographic features during epilepsy surgery. Clin EEG Neurosci. 2016 doi: 10.1177/1550059416654850. http://journals.sagepub.com/doi/pdf/10.1177/1550059416654850 (accessed 3 March 2017) [DOI] [PubMed] [Google Scholar]
- 33.Prichep LS, Gugino LD, John ER. The Patient State Index as an indicator of the level of hypnosis under general anaesthesia. Br J Anaesth. 2004;92:393–399. doi: 10.1093/bja/aeh082. [DOI] [PubMed] [Google Scholar]
- 34.Moldovan M, Calin A, Kumaraswamy VM, Braver D, Simon MV. Burst-suppression ratio on electrocorticography depends on interelectrode distance. J Clin Neurophysiol. 2016;33:127–132. doi: 10.1097/WNP.0000000000000248. [DOI] [PubMed] [Google Scholar]
- 35.Andresen JM, Girard TD, Pandharipande PP, Davidson MA, Ely EW, Watson PL. Burst suppression on processed electroencephalography as a predictor of postcoma delirium in mechanically ventilated ICU patients. Crit Care Med. 2014;42:2244–2251. doi: 10.1097/CCM.0000000000000522. [DOI] [PMC free article] [PubMed] [Google Scholar]
- 36.Barnard JP, Bennett C, Voss LJ, Sleigh JW. Can anaesthetists be taught to interpret the effects of general anaesthesia on the electroencephalogram? Comparison of performance with the BIS and spectral entropy. Br J Anaesth. 2007;99:532–537. doi: 10.1093/bja/aem198. [DOI] [PubMed] [Google Scholar]
- 37.Bottros MM, Palanca BJA, Mashour GA. Estimation of the bispectral index by anesthesiologists: an inverse Turing test. Anesthesiology. 2011;114:1093–1101. doi: 10.1097/ALN.0b013e31820e7c5c. [DOI] [PubMed] [Google Scholar]
- 38.Wildes TS, Winter AC, Maybrier HR. Protocol for the electroencephalography guidance of anesthesia to alleviate geriatric syndromes (ENGAGES) study: a pragmatic, randomised clinical trial. BMJ Open. 2016;6:e011505. doi: 10.1136/bmjopen-2016-011505. [DOI] [PMC free article] [PubMed] [Google Scholar]