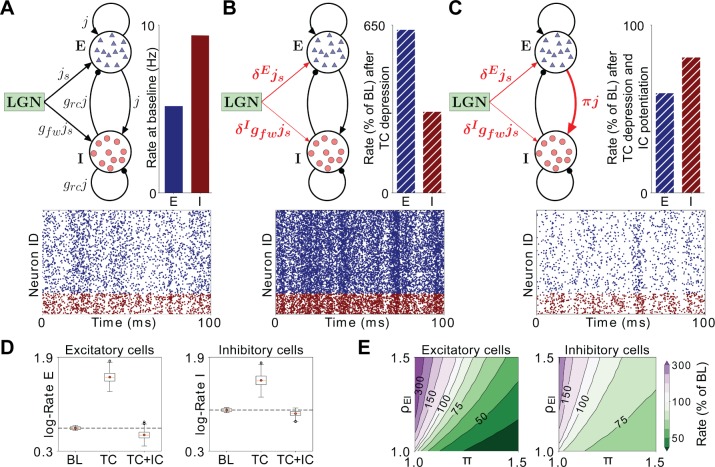
Figure 9. Firing rates in a model layer 4 circuit incorporating MD-induced synaptic changes in V1m.
(A) Schematic of the network model under baseline conditions. All excitatory synaptic weights in the network are given by the parameter j, and inhibitory connections are further scaled with a factor grc. Excitatory neurons receive thalamic input with synaptic weight js, while the stronger thalamic input onto inhibitory neurons is captured by multiplying js with the factor gfw > 1. Bar plot: Firing rates of excitatory (E, red) and inhibitory (I, blue) neurons in the model at baseline (BL). Raster plot: Representative spiking activity across neurons over 100 ms at BL. (B) Schematic of the network model after implementing synaptic depression in thalamocortical (TC) projections onto excitatory neurons (δE) and greater depression onto inhibitory neurons (δI). Bar plot: firing rates as a percentage of BL resulting from these synaptic changes. Raster plot: representative spiking activity across neurons over 100 ms after implementing TC depression. (C) Same as B), but with the addition of intracortical (IC) potentiation (π) of recurrent excitatory drive to inhibitory neurons (TC + IC). (D) Box plots of the firing rates in 2491 implementations of the network with randomly chosen parameters, simulated at BL, after TC depression and after TC depression and IC potentiation. The boxplots show the interquartile range (IQR) of the simulated firing rates (red symbol denotes the mean, red line denotes the median), with the whiskers denoting ± 1.5 IQR. Outliers (black circles) are firing rates beyond the ± 1.5 IQR. Rates are shown on a logarithmic scale for excitatory neurons (left panel) and inhibitory neurons (right panel). (E) Combined effects of increased TC E-I ratio (ρEI) and potentiation of recurrent excitatory drive to inhibition (π) on firing rates of excitatory (left panel) and inhibitory neurons (right panel). Firing rates are shown as percentage of BL for all combinations of π and ρEI. Green-shifted color regions represent lower rates and purple-shifted regions represent higher rates relative to BL.

