. 2018 Oct 5;7:e38465. doi: 10.7554/eLife.38465

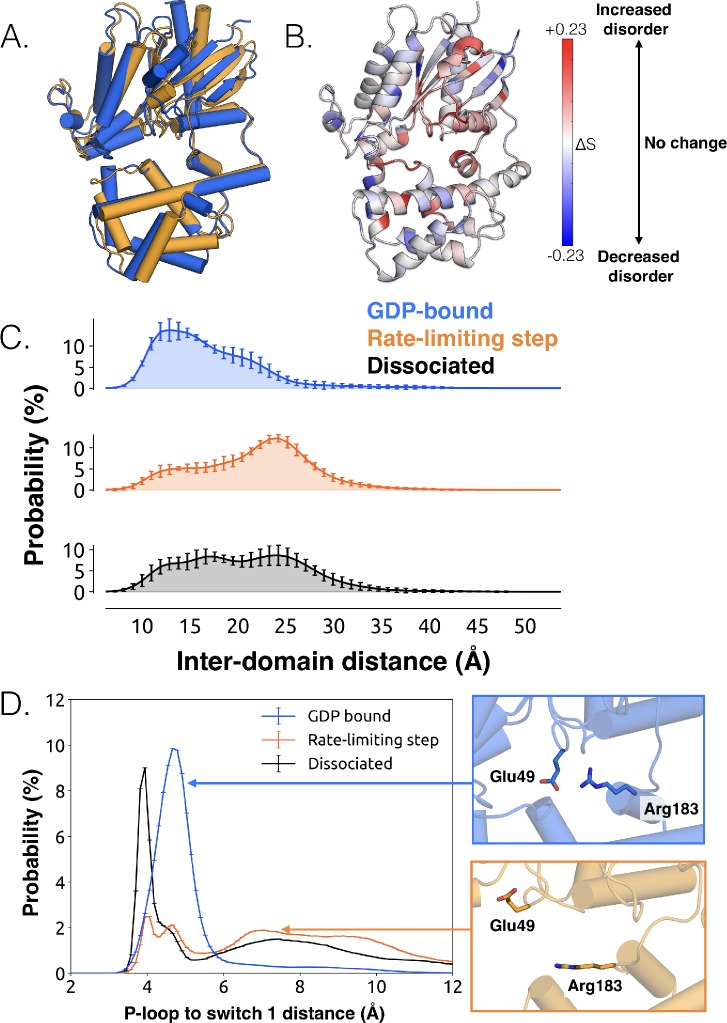
Figure 2. Structural and dynamical changes during the rate limiting step for GDP release.

(A) Overlay of representative structures before (blue) and after (orange) the rate limiting step. (B) Change in conformational disorder (Shannon entropy) across the rate-limiting step, according to the color scale on the right. (C) Histograms of inter-domain distances before (top, blue) and after (middle, orange) the rate limiting step, along with the inter-domain distance distribution after GDP is released (bottom, black). Inter-domain distance is measured using residues analogous to those used in DEER experiments (Dror et al., 2015), Leu97H.HA.29 in the helical domain and Glu250G.H3.4 on H3. (D) Distribution of distances between Glu49G.s1h1.4 and Arg183G.hfs2.2 (left) before (blue) and after (orange) the rate-limiting step, as well as after GDP release (black). Representative structures of the interacting residues are also shown (right).

Figure 2.

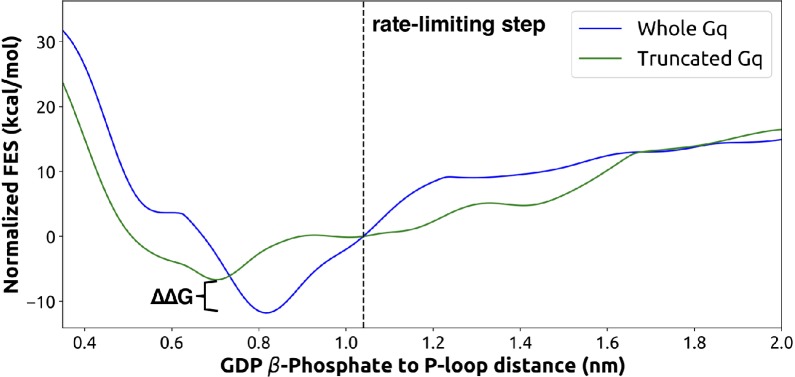
Figure 2—figure supplement 1. Free-energy surface from metadynamics simulations of GDP release for the full Gαq (blue) and truncated form (green, without the last five C-terminal residues).

Figure 2—figure supplement 1.

Both sets of simulations were run for the same amount of time with identical collective variables. The rate-limiting step as identified from the highest flux pathway is marked with a dashed line. The free-energy difference between the GDP-bound states of the two systems is marked with a bracket.
Figure 2—figure supplement 2. Overlay of representative structures of Gαq when bound to GDP (blue) or across the rate-limiting step (orange).
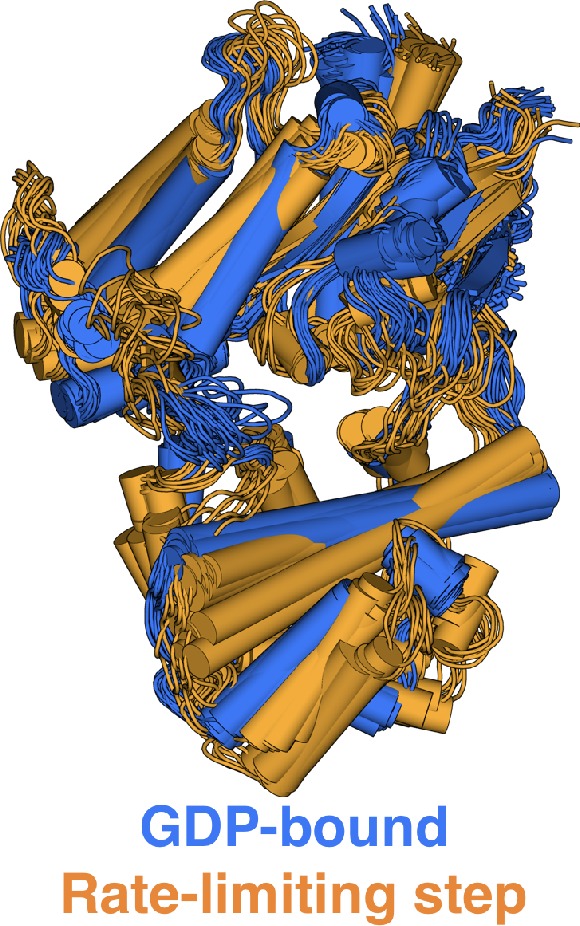
Figure 2—figure supplement 2.

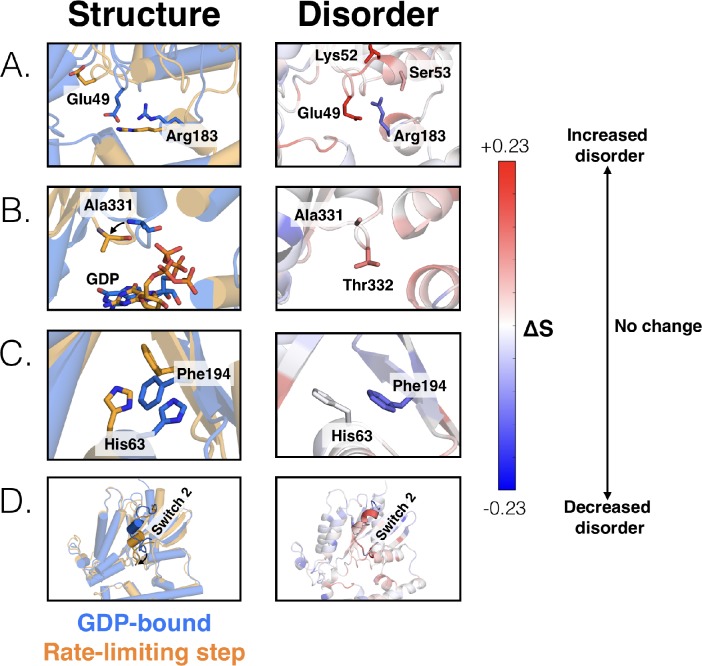
Figure 2—figure supplement 3. Changes in the structure (left) and disorder (right) of specific regions across the rate-limiting step.

Figure 2—figure supplement 3.

(A) Residues that contact the phosphates of GDP, including the salt bridge between Glu49G.s1h1.4 and Arg183G.hfs2.2, (B) the s6h5 loop, (C) the π –π stacking interaction between Phe194G.S2.6 and His63 G.H1.12, and (D) switch 2.
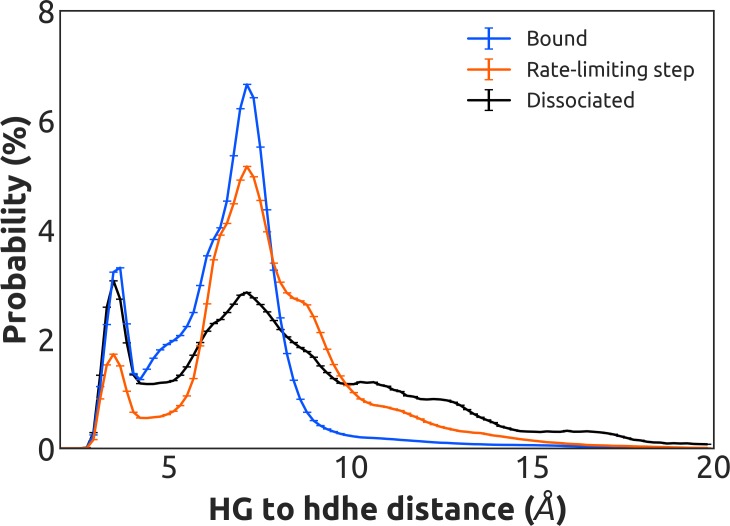
Figure 2—figure supplement 4. Distribution of distances between the side-chains of K275G.s5hg.1 and D155H.hdhe.5 for the GDP-bound state (blue), across the rate-limiting step (orange), and upon GDP dissociation (black).

Figure 2—figure supplement 4.

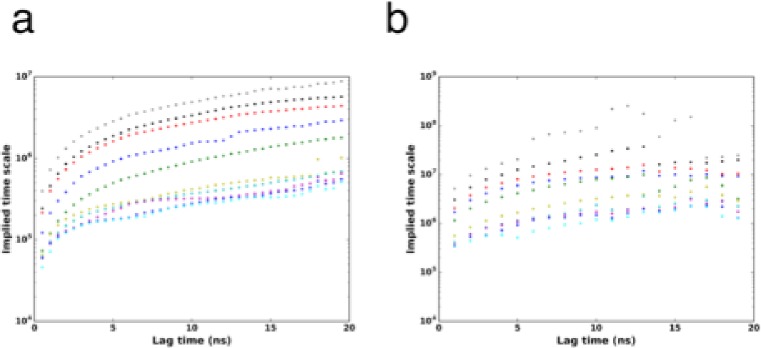
Figure 2—figure supplement 5. Implied timescales for the Markov state model.

Figure 2—figure supplement 5.

(A) Top 10 implied timescales for the 5040 states of Gα. (B) Top 10 implied timescales for the final 221965 states.