
Figure 8. Allosteric network connecting the GPCR- and nucleotide-binding interfaces.
The coloring scheme corresponds to that used in Figure 1, highlighting the GPCR binding interface (gray), GDP phosphate-binding regions (pink), GDP nucleotide-binding regions (green), and the β-sheets (blue).
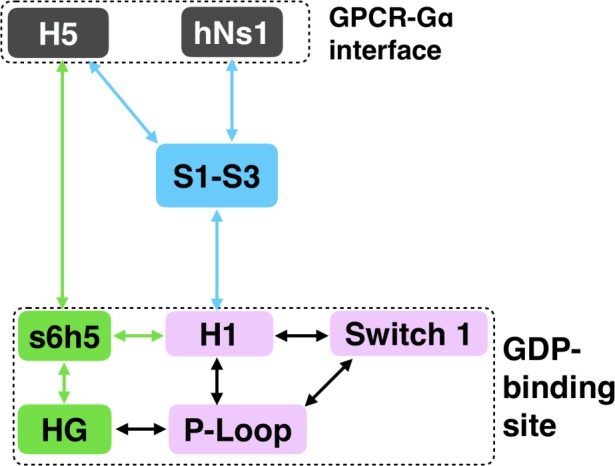
Figure 8—figure supplement 1. Global communication of each residue in the Ras-like domain mapped onto the structure of Gαq, colored based on the scale (right).

The helical domain (gray) is shown for orientation.