Figure 5.

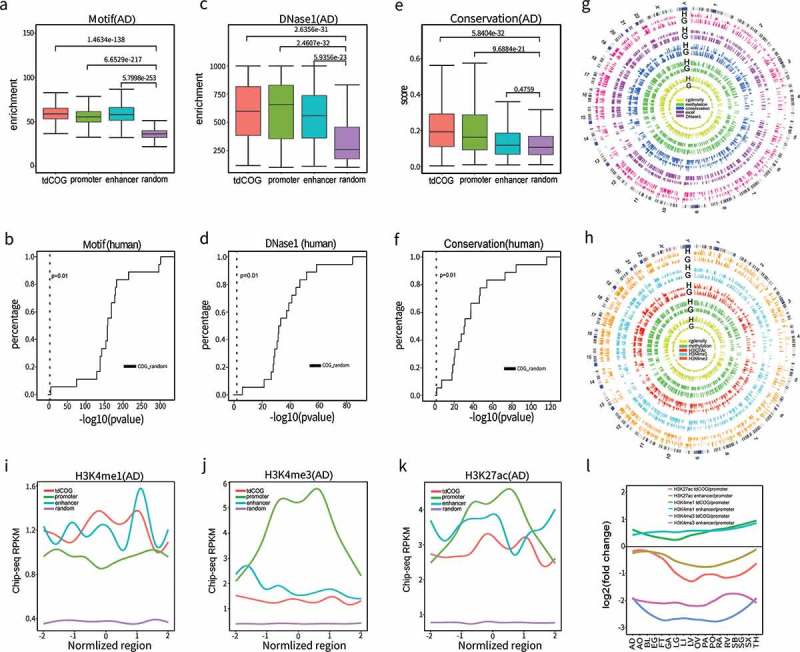
tdCOGs are potential gene regulatory elements. (a-b) The significant enrichment of transcription factor binding motif in tdCOGs. We obtained transcription factor motif (n = 243) from the HOMER database and (a) counted their overlapping with tdCOGs, promoters, enhancers, and random genomic regions in human adrenal tissue. (b) P values (t-test) between tdCOGs and random genomic regions were calculated in each of the 18 human tissues and shown in empirical cumulative distribution plot. (c-d) The significant enrichment of DNaseI hypersensitivity in tdCOGs. We downloaded DNaseI hypersensitivity sites from UCSC genome browser and (c) counted their overlapping with tdCOGs, promoters, enhancers, and random genomic regions in human adrenal tissue. (d) P values (t-test) between tdCOGs and random genomic regions were calculated in each of the 18 human tissues and shown in empirical cumulative distribution plot. (e-f) Higher sequence conservations in tdCOGs. We downloaded sequence conservation data from UCSC genome browser and (e) calculated the mean conservation scores in tdCOGs, promoters, enhancers, and random genomic regions in human adrenal tissue. (f) P values (t-test) between tdCOGs and random genomic regions were calculated in each of the 18 human tissues and shown in empirical cumulative distribution plot. The vertical dashed lines in (b, d, f) mark the x-axis value of P = 0.01. Random genomic regions were selected for multiple times with the same number of tdCOGs (n = 769). (g) Genome wide comparison of CpG density, DNA methylation, sequence conservation, transcription factor bind motif and DnaseI hypersensitivity sites between tdCOGs (G) and HMVs (H) for human adrenal tissue in circos plot. The outmost circle indicates the cytobands of 24 head-to-tail connected chromosomes. Bar height in each circle denotes signal intensity of the corresponding chromosome features. (h) Genome wide comparison of histone modification signals between tdCOGs and HVMs for human adrenal tissue in circos plot. (i-k) Enrichment of histone modifications in tdCOGs, promoters, and enhancers in human adrenal tissue. The regions, after expanding half of their length upstream and downstream, were divided into 100 equal bins. ChIP-seq reads falling in each bin were averaged. (l) Comparison of histone modifications between tdCOGs and enhancers in 18 human tissues. Using promoters as standard, we calculated the fold changes of H3K4me1, H3K4me3, and H3K27ac signals in tdCOGs and enhancers in all 18 human tissues and presented them after log2-transformation.
