

Abstract
Mammalian target of rapamycin complex 2 (mTORC2) with its pivotal component rapamycin-insensitive companion of mTOR (RICTOR) is the major regulator of AKT phosphorylation and is increasingly implicated in tumor growth and progression. In cutaneous melanoma, an extremely aggressive and highly metastatic disease, RICTOR overexpression is involved in tumor development and invasiveness. Therefore, we investigated the impact of RICTOR inhibition in melanoma cells in vitro and in vivo with special emphasis on hepatic metastasis. Moreover, our study focused on the interaction of tumor cells and hepatic stellate cells (HSC) which play a crucial role in the hepatic microenvironment. In silico analysis revealed increased RICTOR expression in melanoma cells and tissues and indicated higher expression in advanced melanoma stages and metastases. In vitro, transient RICTOR knock-down via siRNA caused a significant reduction of tumor cell motility. Using a syngeneic murine splenic injection model, a significant decrease in liver metastasis burden was detected in vivo. Moreover, stimulation of melanoma cells with conditioned medium (CM) from activated HSC or hepatocyte growth factor (HGF) led to a significant induction of AKT phosphorylation and tumor cell motility. Blocking of RICTOR expression in cancer cells diminished constitutive and HGF-induced AKT phosphorylation as well as cell motility. Interestingly, RICTOR blockade also led to an abrogation of CM-induced effects on AKT phosphorylation and motility in melanoma cells. In conclusion, these results provide first evidence for a critical role of mTORC2/RICTOR in melanoma liver metastasis via cancer cell/HSC interactions.
Abbreviations: AGC kinase, protein kinase A, G, and C families (PKA, PKC, PKG); αSMA, α smooth muscle actin; BrdU, 5′-bromodeoxyuridine; CM, conditioned media; DMEM, Dulbecco’s Modified Eagle Medium; FCS, fetal calf serum; GEO, Gene Expression Omnibus; HGF, hepatocyte growth factor; HSC, hepatic stellate cells; mTORC2, mammalian target of rapamycin complex 2; MTT, 3-(4,5-dimethylthiazol-2-yl)-2,5-diphenyltetrazolium; NHEM, normal human epidermal melanocyte; PI3K, phosphoinositide (PI) 3-kinase; PDI, Protein disulfide-isomerase; RAPTOR, Regulatory-Associated Protein of mTOR; RICTOR, Rapamycin-Insensitive Companion of mTOR; S6K, S6 kinase; 4E-BP-1, 4E-binding protein 1
Introduction
Cutaneous melanoma is among the most aggressive and fatal malignancies with a dramatic increase of incidence in the Caucasian population during the last decades [1]. Remarkably, even small and early primary lesions are able to seed satellite, in-transit, lymph node or even distant metastases [2]. Once metastasized, prognosis of patients with melanoma is poor, despite the development of new targeted therapies over the last years [3], [4]. Hepatic metastasis occurs in 14-20% of cutaneous melanoma and is an important determinant of devastating clinical course [2], [5], [6]. Hence, novel therapeutic options are urgently needed to improve the prognosis of patients suffering from this disease.
Activation of the mammalian target of rapamycin (mTOR) signaling pathway is frequently reported in human cancer [7]. However, mTOR signaling is mediated via two distinct multi-component kinases, mTOR complex 1 (mTORC1) and 2 (mTORC2). The rapamycin-sensitive mTORC1 with its essential subunit RAPTOR (Regulatory-Associated Protein of mTOR) has been extensively studied and mainly regulates protein biosynthesis via S6K1 and 4E-BP [7]. In contrast, mTORC2 with its crucial component RICTOR (rapamycin-insensitive companion of mTOR) is less well studied. Several lines of evidence indicate that mTORC2/RICTOR acts primarily as a regulator of AGC kinase phosphorylation/activation, particularly AKTSer473 [7], [8], [9]. Functionally, mTORC2 is involved in mediating growth factor signaling, thereby affecting cell survival and cytoskeleton remodeling [7], [8]. In cancer, RICTOR overexpression and association with poor prognosis has been found in several tumor entities, including colorectal cancer, hepatocellular carcinoma and pancreatic cancer [10], [11], [12]. With regard to melanoma, Laugier et al. showed that the RICTOR locus is frequently amplified and that deregulation of RICTOR is involved in melanoma development via PI3K signaling [13]. Recently, the mTORC2-AKT axis has been connected to metabolic reprogramming in melanoma [14]. Finally, mTORC2 regulation of AKT-MMP-2/9 pathway by RICTOR has been shown to regulate vasculogenic mimicry in melanoma [15]. Nonetheless, little is known about the role of RICTOR in melanoma progression and metastasis.
The liver is a major metastasis-susceptible site for multiple malignancies including melanoma. Notably, the majority of patients with hepatic metastasis die from the disease in the absence of efficient treatment [6], [16]. Different phases during the development of liver metastasis have been described with several non-cellular and cellular components being involved [17], [18], [19]. Among these, liver specific pericytes, also known as hepatic stellate cells (HSC), have been shown to transdifferentiate into highly proliferative and motile myofibroblasts thereby promoting tumor cell migration, growth and survival [20]. Particularly, HSC are implicated in stimulation of angiogenesis [21], suppression of the anti-tumor immune response [22] and supply of tumor cells with growth factors and cytokines, such as hepatocyte growth factor (HGF) [23], [24]. Interestingly, a recent report also shows a reciprocal connection with melanoma cells stimulating proliferation and motility of HSC [25]. However, the interaction between melanoma cells and HSC is still poorly understood.
In the present study, we assessed the role of mTORC2/RICTOR in hepatic metastasis from melanoma cells in vitro and in vivo with special emphasis on HSC-melanoma cell interaction. Our results demonstrate that RICTOR depletion causes a significant impairment of tumor cell motility and AKT phosphorylation in vitro as well as significantly reduction of metastases formation in vivo. Interestingly, RICTOR blockade in melanoma cells also leads to reduced responsiveness to protumorigenic effects of conditioned media (CM) from HSC and HGF. In summary, we provide evidence for mTORC2/RICTOR being an interesting target for anti-neoplastic therapy in melanoma liver metastasis.
Material and Methods
Cell Lines, Culture Conditions and Reagents
Two human melanoma cell lines (MelIM, MelJU) and the murine melanoma cell line B16 were used for the experiments. Expression analysis was performed using normal human epidermal melanocytes (NHEM-I and NHEM-II) in comparison to both human melanoma cell lines (MelIM, MelJU). Furthermore, we used the two human HSC cell lines LX2 cells and HSChTERT. LX2 were generated by spontaneous immortalization in low serum conditions [26]. HSChTERT cells are an immortal activated human hepatic stellate cell line generated by ectopic telomerase expression [27]. All three melanoma cell lines were derived from metastases of malignant melanoma as described before [28]. MelIM and MelJU cells were cultured in low Glucose (1 g/L) Dulbecco’s Modified Eagle Medium (DMEM) supplemented with 10% fetal calf serum (FCS), while B16 cells, HSChTERT and LX2 cells were grown in high glucose (4,5 g/L) DMEM supplemented with 10% FCS. All cell lines were maintained at 37°C in a humidified atmosphere with 5% CO2. Conditioned media (CM) from HSC lines was generated as previously described [29]. Human recombinant HGF was obtained from Peprotech (Hamburg, Germany).
In Silico Analysis
In silico analysis of RICTOR RNA expression levels was performed using a Gene Expression Omnibus (GEO) dataset (GDS1989). OncomineTM cancer microarray database [30] analysis for gene expressions was performed using the website https://www.oncomine.org/.
Immunohistochemical Analysis of RICTOR Expression in Human Melanoma Liver Metastases
All patients were operated and diagnosed at the University Medical Center Freiburg. After diagnosis, tissue specimens collected by the Institute of Surgical Pathology at the University Medical Center Freiburg have been included into the presented study for initial expression analyses of RICTOR. Therefore, a retrospective cohort comprising six patients with hepatic metastasized malignant melanomas has been compiled. Tissue specimens were reviewed through a pathologist from the Tumorbank of the Comprehensive Cancer Center Freiburg. Written informed consent was obtained from each patient before inclusion.
All tissue specimens underwent gross section and were immediately formalin fixed. After formalin fixation and paraffin embedding, 2 μm-thick sections were cut, mounted onto cover slips, dried at 58° Celsius for 48 hours, deparaffinized in xylene and dehydrated with ethanol. Epitope heat demasking was performed for five minutes via an autoclave (pressure 0.8 bar). Slides were stained using the ready to use primary antibodies RICTOR (monoclonal, mouse anti-RICTOR Abcam, Cambridge, UK). Dako REAL™ Link (Santa Clara, CA, USA), biotinylated secondary antibodies, and subsequent incubation with Dako REAL™ streptavidin alkaline phosphatase (Santa Clara, CA, USA) was performed. For visualization, RED chromogen (Santa Clara, CA, USA) was used. Counterstaining was performed with hematoxylin before adding a coverslip.
Suppression of RICTOR Expression
Due to the lack of specific inhibitors, RNA interference was used to suppress RICTOR expression. MelIM, MelJU and B16 were transiently transfected with two different siRNA sequences targeting human [(Silencer® Select; s48410 (=RICTOR si1), s226000 (=RICTOR si2)); Invitrogen, Waltham, MA, USA] or murine [(Silencer® Select; s95670 (RICTOR si1), s95672 (RICTOR si2)); Invitrogen, Waltham, MA, USA] RICTOR and scrambled siRNA control [(Silencer® Select; scrambled siRNA = ctrl. Si); Invitrogen, Waltham, MA, USA] using Lipofectamine RNAiMAX transfection reagent (Invitrogen, Waltham, MA, USA). Briefly, pre-plated cells were incubated with transfection mixture [Opti-MEM® (Gibco, Waltham, MA, USA), Lipofectamine 2.5% vol/vol, siRNA 50 nM] for 6 hours. 48 hours after transfection knock-down efficiency was confirmed by Western blotting and tumor cells were processed for further experiments.
Measurement of Cell Growth
Assessment of in vitro growth upon RICTOR blockade was performed using the MTT [3-(4,5-dimethylthiazol-2-yl)-2,5-diphenyltetrazolium] assay as described [11], [31]. Cancer cells transfected with RICTOR siRNA (and respective controls) were seeded into 96-well plates (2x10³ cells/well). Cells were grown with medium containing 10% FCS. After 24 and 48 hours, the MTT assay was performed, as described elsewhere [31]. In addition, effects of RICTOR inhibition on growth of tumor cells in vitro were determined in a cell-counting assay as described [31]. Briefly, 105 cells were seeded into 6-well dishes; after 24 and 48 hours, cells were trypsinised and counted. Finally, cell proliferation was monitored by 5′-bromodeoxyuridine (BrdU) incorporation assay (Roche Diagnostics, Mannheim, Germany). Three thousand cells were cultured for 24 and 48 hours in 96-well plates and stained with BrdU as previously described [32]. The percentage of cells exhibiting genomic BrdU incorporation was measured by absorbance at 370 nm with Tecan Infinite200 (Tecan, Männedorf, Switzerland). Percentages were calculated relative to ctrl. si.
Analysis of Cell Migration
Migration assays were conducted using modified Boyden chambers with 8 μm filter pore inserts (BD, Heidelberg, Germany), as previously described [11], [31]. Briefly, after transfection with RICTOR siRNA, 5×10⁴ cancer cells were suspended in serum-starved medium (1% FCS). HGF (50 ng/ml), CM from HSCs (LX2 and HSChTERT) or 10% FCS served as chemoattractant. After 24 hours, migrated cells were fixed, stained (Diff Quik, Medion Diagnostics, Miami, FL, USA), counted in four random fields and average results were calculated.
Western Blotting
Western blotting was performed to confirm RICTOR knock-down and to assess its impact on AKT expression/phosphorylation, as described [11], [31]. In brief, cells were grown under constitutive conditions or stimulated with either CM from HSC or HGF (50 ng/ml) for 15 minutes after overnight (o/n) serum-starvation. Protein samples (30 μg) were subjected to a denaturating 10% SDS-PAGE. Membranes were sequentially probed with primary antibodies against RICTOR, pAKTSer473, pAKTThr308, and AKT (Cell Signaling, Beverly, MA, USA). PDI (Enzo Life Sciences, Farmingdale, NY, USA) served as a loading control. Antibodies were detected by enhanced chemiluminescence (GE Healthcare Life Sciences, Freiburg, Germany). Finally, densitometry was performed using ImageJ (1.46r; http://imagej.nih.gov.ij). Expression of pAKTSer473 was calculated in relation to total AKT.
Mouse Model of Hepatic Metastasis
To assess the impact of RICTOR inhibition on hepatic metastasis in vivo, a syngeneic mouse model was performed as described [33]. Experiments were approved by the Institutional Animal Care and Use Committee of the University of Regensburg and the regional authorities. In addition, experiments were conducted according to “Guidelines for the Welfare of Animals in Experimental Neoplasia” published by The United Kingdom Coordinating Committee on Cancer Research.
In this model, B16 cells (2.5 x 10⁵ cells) were injected into the spleen of C57BL/6N mice (eight-week old male, Charles River, Sulzfeld, Germany). The experiment was performed with 3 groups [control, RICTOR si1 (transient transfection with s95670), RICTOR si2 (transient transfection with s95672); 11 animals/group]. Two RICTOR siRNAs with different sequences were used to avoid off-target effects. 10 days after intrasplenic tumor cell injection, mice were terminated. Upon necropsy, the liver was dissected, weighed and processed for further analyses.
Assessment of Hepatic Tumor Burden
First, extent of hepatic metastases was evaluated by a macroscopic score (0 = no tumor load (not shown), 1 = low tumor load (only scattered tumor spots visible on the liver surface), 2 = medium tumor load (confluent tumor visible on anterior or posterior surface of the liver), 3 = high tumor load (confluent tumor visible on anterior and posterior surface of the liver), Figure 2C). Additionally, liver weight was determined and used as a surrogate parameter for hepatic tumor burden. To assess the hepatic tumor load more precisely, staining for H&E (Merck 1.09 249.1000 and 1.09 844.1000) using standard protocols for formalin-fixed tissues was performed on 5μm liver sections serially cut at 100μm intervals. Sections were analyzed at 10x magnification with a Zeiss Axioplan 2 microscope under bright-field conditions, and images captured with a Zeiss Axiocam camera using AxioVision 3.0 software as described before [34]. Total liver area and tumor area were measured using ImageJ and determined as μm2. Tumor load was subsequently calculated as percent of total liver area.
Figure 2.

RICTOR depletion in human and murine melanoma cell lines and its impact on growth and motility in vitro.
(A, B) Upon transient transfection with two different siRNAs (RICTOR si1, RICTOR si2), RICTOR expression is impaired compared to controls (ctrl. Si = scramble RNA), as determined by Western blotting (A) and densitometry (B).
(C) In B16 cells, significant reduction of MTT signal was detected after 24 hours. After 48 hours, a growth inhibitory effect is only observed upon RICTOR si1 (#,*P < .05 vs. ctrl. Si; bars=SEM).
(D) BrdU incorporation assay shows no significant anti-proliferative effect of RICTOR knock-down on B16 cells after 24 and 48 hours.
(E, F, G) Constitutive tumor cell motility measured by Boyden Chamber assays is significantly decreased upon RICTOR inhibition in MelIM (F), MelJU (G) and B16 melanoma (H) cells lines compared to controls (*P < .05 vs. ctrl. Si; bars=SEM).
Immunohistochemical Assessment of Activated HSC (αSMA)
To identify active HSC, liver sections were stained for α-smooth muscle actin (αSMA), a known stellate cell marker, as described [23], [35]. Briefly, cryosections of liver were fixed in cold acetone and chloroform, washed with PBS and exposed to primary antibody against αSMA (1:200; Abcam, Cambridge, UK) and the secondary antibody AlexaFluor 594 (1:200; Live Technologies, Carlsbad, CA, USA) was applied as described. Hoechst 33342 (1:400, Cell Signaling, Beverly, MA, USA) was used for the nuclear counterstain.
Analysis of HGF mRNA Expression
RICTOR and HGF mRNA expression was determined in human melanoma cell lines and hepatic stellate cells using quantitative RT-PCR. In addition, mRNA expression of HGF, αSMA, collagen-1α, and RICTOR was determined in liver tissue, as previously described [11], [36].
Statistical Analysis
Statistical analyses were carried out using SigmaStat (Version 3.0). Results of in vivo experiments were analyzed for significant outliers using the Grubb’s test (www.graphpad.com). Tumor-associated variables of in vivo experiments were tested for statistical significance using the Mann-Whitney U test for nonparametric data or ANOVA followed by Tukey’s multiple comparison tests for more than 2 groups. The two-sided Student’s t test was applied for analysis of in vitro data. All results are expressed as the mean ± standard error of the mean (SEM).
Results
RICTOR Expression in Melanoma Cells and Tissues
Initially, we analyzed the expression of RICTOR in 2 different human melanoma cell lines (MelIM, MelJU) and found a significantly elevated expression as compared with normal human melanocytes (Figure 1A). Next, we performed Gene Expression Omnibus (GEO) dataset analysis (GDS1989). Comparison of RICTOR mRNA levels in human nevi, non-metastatic and metastatic melanoma tissues showed significant up-regulation of RICTOR expression in metastatic melanoma tissues (Figure 1B). In silico analysis using the OncomineTM human cancer microarray database [30] revealed enhanced RICTOR mRNA levels in the "invasive margin" as compared to the "tumor center" of melanoma tissues (Figure 1C). The same dataset (“Roesch Melanoma” [37]) also showed elevated RICTOR expression levels according to the Clark levels V compared to IV with a tendency towards statistical significance (Supplementary Figure 1A). Furthermore, RICTOR mRNA levels tended to be higher in “advanced stage” melanoma compared to “early stage” in the “Smith Skin” dataset [38] (Supplementary Figure 1B), M1c-stage compared to M1b-stage in “Bogunovic Melanoma” dataset [39] (Supplementary Figure 1C) and in metastatic melanoma compared to non-metastastic in “Haqq Melanoma” [40] (Supplementary Figure 1D). Finally, RICTOR expression was detected in human melanoma liver metastases by immunohistochemical assessment (Supplementary Figure 1E). In summary, these data indicate increased RICTOR expression in melanoma cells and tissues compared with normal melanocytes, non-tumorous skin and nevi, respectively. Further, RICTOR appears to be further enhanced in advanced melanoma stages including liver metastases, suggesting a role of RICTOR in melanoma progression and metastasis.
Figure 1.
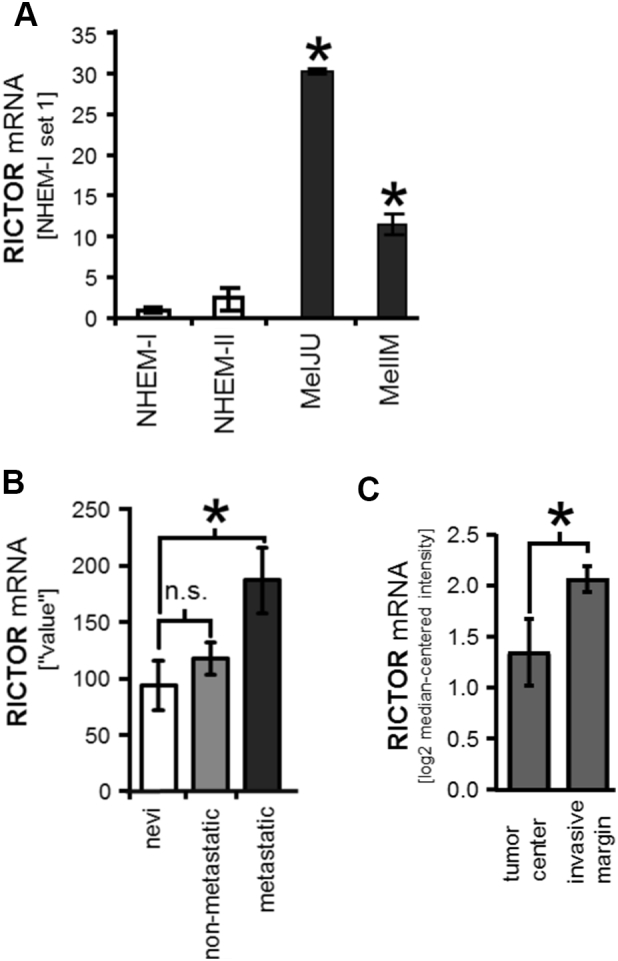
Expression of RICTOR in melanoma cells and tissues.
(A) Quantitative RT-PCR analysis shows a significant higher RICTOR mRNA expression in human melanoma cell lines MelJU and MelIM compared to normal human epidermal melanocytes (NHEM) (*P < .05 vs. NHEM-I; bars=SE).
(B) Gene Expression Omnibus (GEO) dataset analysis (GDS1989) comparing RICTOR mRNA expression in human nevi (benign nevi (n=2), atypical nevi (n=2)), non-metastatic melanoma tissues (n=4) and metastatic melanoma tissues (metastatic growth phase melanoma (n=2) and lymph node metastasis (n=2)). (n.s. non-significant; *P < .05 vs. nevi; bars=SE).
(C) RICTOR mRNA levels in the "tumor center" (n=9) are significantly lower compared to the "invasive margin" (n=9) of melanoma tissues (*P < .05). The data were obtained from the OncomineTM cancer microarray database using the dataset "Roesch Melanoma" (n=18 samples).
Analysis of Functional Effects of RICTOR Knock-Down in Melanoma Cells In Vitro
To further analyze the effect of RICTOR in melanoma, we suppressed RICTOR expression in 3 different melanoma cells lines (MelIM, MelJU, B16) by siRNA. Efficacy of RICTOR knock-down by siRNA in cancer cell lines was assessed by Western blotting (Figure 2A). siRNA transfection led to an approximately 70-90% compared to cells transfected with scrambled RNA (ctrl. si), as determined by densitometry (Figure 2B). Next, we investigated the impact of RICTOR knock-down on growth of melanoma cell lines in vitro. After 48 hours, a slide but statistically significant impairment upon RICTOR knock-down was observed in MTT assays with human MelIM and MelJU cells (Supplementary Figure 2, A and B). Similarly, murine B16 melanoma cells showed a significantly reduced signal already after 24 hours, while after 48 hours significant impairment was detected only with RICTOR si1 but not RICTOR si2 (Figure 2C). Additionally performed cell count analyses showed no reduction of cell number after 24 and 48 hours in MelIM, MelJU or B16 melanoma cells (data not shown). Since these results were not conclusive, we performed BrdU assay using B16 cells indicating no affection of tumor cell proliferation in vitro (Figure 2D). In contrast, analyses of melanoma cell motility upon RICTOR blockade by Boyden Chamber assays revealed significant impairment of constitutive tumor cell motility upon RICTOR knock-down after 24 hours in human MelIM and MelJU (Figure 2, E and F) as well as in murine B16 cells (Figure 2G). In summary, targeting RICTOR in melanoma cell lines limited effects on tumor growth and but significantly impairs tumor cell motility in vitro.
Inhibition of Hepatic Metastasis Formation In Vivo by Targeting RICTOR
To assess our results regarding tumor cell motility in vivo, a syngeneic murine splenic injection liver metastasis model using B16 cells was applied. Ten days after tumor cell injection, macroscopically visible hepatic tumor load was significantly reduced in mice injected with RICTOR depleted B16 cells (Figure 3, A and C). The reduced tumor load was also reflected by a significantly lower total liver weight upon RICTOR knock-down (Figure 3B). Assessment of RICTOR expression in liver tissue showed no significant difference between the groups, although a trend towards reduced expression was found upon RICTOR knock-down (Supplementary Figure 3A). However, PCR was performed with liver tissue but not microdissected liver metastases and, therefore, might not be significant. Nonetheless, our results indicate that targeting the mTORC2 component RICTOR in melanoma cells has the potential to reduce metastatic tumor growth in the liver.
Figure 3.

Modulation of melanoma metastasis in vivo (B16 splenic injection model).
(A) Significant reduction of macroscopically visible hepatic tumor load is found in both groups with RICTOR depletion compared to controls. (*P < .05 vs. control; bars=SE).
(B) This effect is confirmed with regard to liver weight. (*P < .05 vs. control; bars=SE).
(C) Examples for macroscopic stratification of hepatic tumor burden from 0 to 3: 0 = no tumor load (not shown), 1 = low tumor load, 2 = medium tumor load, 3 = high tumor load.
(D) Examples of H&E liver sections of mice with intrasplenically injected B16 cells (control cells and two RICTOR siRNA) after 10 days. (bars=1 mm).
(E) Percentage of tumor area related to total liver area is significantly lower upon RICTOR depletion compared to controls. (*P < .05 vs. control; bars=SEM).
For further and more precise evaluation of the effect of RICTOR knock-down on the hepatic tumor burden, livers were stained with H&E (Figure 3D). Interestingly, the microscopically detectable metastases as determined by tumor area/total liver area covered 47.6% in control livers but only 22% (RICTOR si1) and 29% (RICTOR si2) upon RICTOR knock-down, respectively (Figure 3E). This difference proved to be significant. In summary, our results indicate that targeting the mTORC2 component RICTOR has the potential to reduce hepatic metastasis of melanoma cells in vivo.
Interaction Between HSC and Melanoma Cells Upon RICTOR Knock-Down
The role of activated hepatic stellate cells in liver metastasis is increasingly recognized since these cells are also involved in forming a metastatic niche in the liver [17]. Interestingly, immunohistochemical staining for αSMA (a known marker for activated HSC) showed HSC surrounding melanoma metastases (Figure 4A) although no difference in αSMA and collagen-α1 mRNA expression was found between both groups (Supplementary Figure 3, B and C). Nonetheless, we aimed to further analyze the interaction of HSC and melanoma cells with special emphasis on the role of RICTOR in tumor cells. To follow-up on this, motility of MelIM and MelJU upon RICTOR knock-down was determined using CM from HSChTERT and LX2 as chemoattractants. Results showed that CM from both HSC lines substantially increases tumor cell motility compared to controls (Figure 4, B and C and Supplementary Figure 4, A and B). Blockade of the mTORC2 component RICTOR in melanoma cells significantly reduced CM-induced tumor cell migration (Figure 4, B and C and Supplementary Figure 4, A and B). Since RICTOR/mTORC2 is the major regulator of AKT signaling, effects of RICTOR blockade on CM-induced AKT phosphorylation were subsequently investigated. Indeed, CM from HSChTERT and LX2 led to an induction of AKTSer473 phosphorylation in MelIM cancer cells which was strongly reduced by inhibition of the mTORC2 component RICTOR (Figure 4, D–G). Similar results were obtained for MelJU (data not shown). In summary, CM from HSC induces motility and AKTSer473 phosphorylation in melanoma cell lines, which can be effectively reduced by RICTOR depletion.
Figure 4.

Modulation of HSC-induced motility and signaling via RICTOR blockade in melanoma cells.
(A) aSMA staining reveals HSC surrounding liver metastases (bars = 100 μm).
(B, C) Conditioned medium (CM) from HSChTERT (B) and LX2 (C) leads to a significant induction of MelIM motility after 24 hours (#P < .05 vs. untreated cells; bars=SEM). RICTOR knock-down in MelIM significantly reduced this effect (*P < .05 vs. ctrl. si; bars=SEM).
(D) CM from HSChTERT leads to a strong induction of pAKTSer473 in MelIM melanoma cells, which is suppressed by RICTOR siRNA. Only minor effects of RICTOR inhibition are found on pAKTThr308 phosphorylation.
(E) Densitometry reveals up to a 60% reduction of AKTSer473 phosphorylation.
(F, G) Similar inhibitory effects on AKT phosphorylation are found, when MelIM cells are stimulated with CM from LX2.
HGF is Mainly Secreted by HSCs and RICTOR Blockade Can Impair Its Effects on Motility and Signaling in Melanoma Cells
In search for the factors secreted by HSC to explain our in vitro effects, we focused on HGF. HGF has previously been described as an important mediator of melanoma cell migration [23], [41], [42]. Interestingly, quantitative RT-PCR analysis revealed that HGF mRNA expression was more than 1000-fold higher in HSC compared with human melanoma cell lines (Figure 5A). Moreover, RICTOR blockade in melanoma cells in vitro does not modify HGF mRNA expression (Supplementary Figure 5, A and B). This finding suggests that HSC are the main source of HGF in melanoma metastases and that HGF may also be a critical promoter of HSC-induced melanoma cell motility. To verify this hypothesis, we analyzed the effect HGF stimulation on motility and signaling in melanoma cell lines in vitro. Results demonstrate that HGF significantly increased motility of MelIM and MelJU cells (Figure 5, B and C). Importantly, RICTOR blockade in melanoma cell lines significantly impaired HGF-induced effect on tumor cell motility (Figure 5, B and C). Furthermore, incubation of both melanoma cell lines with HGF led to an induction of AKTSer473 and AKTThr308 phosphorylation. Upon RICTOR depletion, AKTSer473 phosphorylation was impaired (Figure 5, D-G). In conclusion, our results demonstrate that (HSC secreted) HGF is a critical promoter for the recruitment of melanoma cells to the liver and that this effect is, at least in part, mediated via activation of mTORC2/RICTOR/AKT signaling.
Figure 5.

RICTOR blockade modulates (HSC-secreted)-HGF-induced motility and AKT phosphorylation.
(A) HGF mRNA assessed by qRT-PCR shows more than 1000-fold higher mRNA expression in primary HSCs from two different donors (HSC-1 and HSC-2) compared to melanoma cell lines MelIM and MelJU.
(B) HGF (50 ng/ml) significantly induces MelIM cell motility after 24 hours. Blockade of RICTOR in melanoma cells via siRNA approach abrogates this effect, as determined by Boyden Chamber assays. (#, *P < .05 vs. ctrl. si; bars=SEM)
(C) Similar results are found for MelJU.
(D, E) In MelIM, HGF (50 ng/ml) leads to a marked increase of AKTSer473 phosphorylation, while RICTOR blockade substantially reduces HGF-induced phosphorylation, as determined by Western blotting and subsequent densitometry.
(F, G) Similar results regarding HGF-induced AKTSer473 phosphorylation upon RICTOR inhibition are obtained for the MelJU melanoma cell line.
Discussion
Although novel therapeutic options have been successfully used for a proportion of melanoma patients, metastatic disease still has a poor prognosis. In case of liver metastases, 5-year overall survival is reported to be less than 10% [5], [43], [44]. In the present study we assess the essential mTORC2 component RICTOR as a potential target for anti-metastatic therapy in melanoma.
Results from our in vitro analyses using the in silico technique showed an increased expression of RICTOR mRNA in more advanced melanoma stages. Previously, Laugier et al. described that RICTOR overexpression enhanced melanocyte clonogenicity particularly upon NRAS-transformation. In addition, their study depicted RICTOR amplification as a frequent event in melanoma [13]. Furthermore, a recent report from Liang and coworkers delineated an overexpression of RICTOR in invasive melanoma upon evaluation by immunohistochemistry [15]. These results support our findings showing a higher RICTOR mRNA expression at the invasive margin. Even more, we found a significant increase of RICTOR in metastatic disease compared to pre-malignant nevi and an expression of RICTOR in resected melanoma liver metastases. Taken together, our results add further evidence to the fact that the mTORC2 component RICTOR is important for melanoma formation and progression.
From our in vitro analyses we found no effects of mTORC2/RICTOR inhibition on growth of melanoma cells This observation was not expected since Liang recently reported a significant inhibition of melanoma cell proliferation and cell cycle arrest in G2/M phase upon RICTOR blockade [15]. Additionally, growth inhibition by RICTOR blockade was also confirmed by others for gastric and colon cancer cells [45], [46]. In contrast, results from our previous study with pancreatic cancer cell lines also found only minor effects of RICTOR blockade on tumor cell growth in vitro, but a significant inhibition of tumor cell proliferation in vivo [11]. One might speculate that similar to pancreatic cancer, other pathways such as MAPK or WNT/ß-catenin are more important in regulating growth of melanoma cells [47], [48]. Finally, we found only minor constitutive phosphorylation of AKT on both phosphorylation sites (Ser473 and Thr308) and, concomitantly, only little effect of RICTOR blockade on constitutive AKT phosphorylation (Figures 4, D and F; Figure 5, D and F). This might also explain the minor effects we observed on melanoma growth in vitro. Nonetheless, these results warrant further evaluation.
With regard to melanoma cell motility, we detected a significant inhibition of constitutive motility upon RICTOR blockade in vitro. These results are in line with previous reports that showed strongly impaired migration and invasion of melanoma cells after RICTOR inhibition in vitro [15]. Mechanistically, Gulhati et al. connected RICTOR-mediated impairment of colon cancer cell motility to effects on EMT and RhoA/Rac1 signaling [49]. In addition, Zhang et al. reported that RICTOR inhibition reduced the motility of breast cancer cell lines via effects on protein kinase Cζ (PKCζ) and F-actin binding protein cofilin [50]. Taken together, results from our study confirm the so far reported inhibitory effects of RICTOR blockade on tumor cell motility, supporting a potential role of RICTOR in cancer cell metastasis.
To further evaluate this issue we performed a syngeneic mouse splenic injection model. Our results showed a significant reduction of tumor burden in the liver upon siRNA-mediated RICTOR depletion. So far, a reduction of pulmonary metastasis from different breast cancer models has been described via effects on Rac1 and PRICKLE-RICTOR interaction upon mTORC2/RICTOR inhibition [51], [52]. Similar, Li et al. showed reduction of lung and bone metastasis in a mouse model of prostate cancer [53]. Regarding liver metastasis from human colon cancer, higher RICTOR mRNA and protein expression has been described compared to the primary tumor [49]. Recently, Sun et al. found no liver metastasis in a renal cell carcinoma xenograft model upon RICTOR knock-down [54]. The latter finding is in line with our previous study on pancreatic cancer, where a trend towards reduced liver metastasis was found [11]. However, we used a splenic injection model which harbors potential limitations such as the inability to represent the entire metastatic process and an artificial route to administer the tumor cells [55]. Nonetheless, the model is established for this issue and widely used [33], [55]. Moreover, our aim was to specifically target mTORC2/RICTOR in tumor cells in the metastatic process with can performed using the splenic injection model [56]. Finally, the present study is the first that addresses the issue of establishment of liver lesions with regard to mTORC2/RICTOR using a syngeneic melanoma mouse model in vivo. The latter further strengthens the results due to the existence of a functional immune system in the mice. In summary, these data strongly support our hypothesis for mTORC2/RICTOR being an important player in the development of melanoma metastasis in liver.
Since the hepatic environment has the potential to create a metastatic niche for cancer cells, we also addressed this issue. Staining for αSMA confirmed the previously described surrounding of liver metastases by HSC [42]. This is of particular importance since HSC are known drivers of hepatic tumor growth and metastasis formation [20], [23]. Therefore, we assessed the impact of CM from HSC on motility and AKT phosphorylation of melanoma cells with regard to mTORC2/RICTOR. Results from our experiments revealed that RICTOR inhibition efficiently impairs CM-induced motility and AKTSer473 phosphorylation. These effects were further shown to be associated with HGF secreted by HSC, since similar results were detected when melanoma cells were stimulated with HGF. The rationale for this claim is based on our observation that HSC are the main source of HGF compared to melanoma cells and on recently published data showing the importance of the HSC – HGF/c-MET signaling axis for invasion of hepatoma cells [41]. Moreover, we found no effects of mTORC2/RICTOR blockade on expression of HGF mRNA in melanoma cells in vitro and HGF mRNA in the liver in vivo (Supplementary Figure 3D) which further supports our hypothesis that inhibition of RICTOR impairs HGF-induced signaling rather than HGF expression itself. However, HGF is not the exclusive mediator of HSC/tumor cell interaction. Indeed, several mechanisms have been described by which HSC can promote cancer metastasis including activation of the SDF1/CXCR4 axis and TGF-β/IQGAP-1 pathway [57], [58]. Moreover, the interaction between tumor cells and HSC seem to be more complex since we recently demonstrated that melanoma cells can induce proliferation and migration of HSC [25]. This is of particular importance with regard to potentially available therapies targeting mTORC2/RICTOR especially because little is currently known about the effect of RICTOR depletion in HSC. Finally, the interaction of HSC and tumor cells is only one part of the metastatic niche formation. Of course, other parts of the hepatic microenvironment, e.g. Kupffer cells or sinusoidal endothelial cells are important during the development of liver metastases (reviewed by [17]). So far, little is known neither about the role of mTORC2/RICTOR in these cells nor about the interaction with mTORC2/RICTOR inhibition in tumor cells. Nonetheless, to our knowledge this is the first report that describes the effect of mTORC2/RICTOR blockade in melanoma cells on CM from HSC.
In conclusion, the present study shows that RICTOR is associated with advanced disease in melanoma. In addition, we described for the first time that mTORC2/RICTOR inhibition in melanoma cells has the potential to reduce liver metastasis in vivo via effects on tumor cell motility. Furthermore, we found that mTORC2/RICTOR inhibition in melanoma cells significantly decreases the responsiveness of melanoma cells to HSC- and HGF-induced stimulation. Therefore, we provide evidence that targeting mTORC2/RICTOR is an interesting approach for anti-metastastic therapy in melanoma liver metastasis.
The following are the supplementary data related to this article.
(A) RICTOR mRNA levels tended to be higher according to the Clark levels (IV: n=16; V: n=2). The data were obtained from the OncomineTM cancer microarray database using the dataset "Roesch Melanoma" (n=18 samples). (B) RICTOR mRNA levels in "advanced stage" (vertical growth phase melanoma, metastatic growth phase melanoma and melanoma positive lymph nodes, n=7) tended to be higher compared to "early stage" (benign nevi and melanoma in situ, n=6) tissue samples. The data were obtained from the OncomineTM cancer microarray database using the dataset "Smith Skin" (n=18 samples). (C) RICTOR mRNA expression in M1b-stage (N=3) as compared to M1c-stage tissues (N=2) from metastatic melanoma. A trend towards higher expression in M1c-stage was observed. The data were obtained from the OncomineTM cancer microarray database using the dataset "Bogunovic Melanoma" (n=44 samples). (D) RICTOR mRNA expression levels in melanoma tissue samples derived from primary (n=6) compared to metastatic (n=14) tumor sites. The data were obtained from the OncomineTM cancer microarray database using the dataset "Haqq Melanoma" (n=37 samples). (E) Cytoplasma positive staining for RICTOR. Furthermore, RICTOR demonstrates a strong positive staining in granulocytes.
(A) MTT assay with MelIM showed a significantly reduced signal upon RICTOR inhibition after 48 hours (*P < .05 vs. ctrl. Si; bars=SEM). (B) Similar, in MelJU RICTOR blockade led to reduced signal 48 hours (*P < .05 vs. ctrl. Si; bars=SEM). However, growth inhibitory effects were not confirmed using the cell count assay (data not shown)
(RT-PCR from liver tissue) (A) Only a trend towards reduced RICTOR mRNA expression was found in liver tissue 10 days after tumor cells inoculation. However, analysis was not performed with microdissected liver metastases which might explain the missing reduction. (B) Expression of αSMA mRNA in liver tissue did not differ between RICTOR knock-down groups and control in vivo. (C) Similar, no difference of collagen-α1 mRNA expression was found. (D) Analysis of HGF mRNA from liver tissue did not show a difference between control and RICTOR knock-down in vivo.
(A) Conditioned medium (CM) from HSChTERT led to significant induction of MelJU motility after 24 hours (#P < .05 vs. untreated cells; bars=SEM). RICTOR knock-down in MelJU significantly reduced this effect (*P < .05 vs. ctrl. Si; bars=SEM). (B) Similar results were obtained upon incubation of MelJU with CM from LX2 cells. Again, a significant induction of motility was found (#P < .05 vs. untreated cells; bars=SEM) which was significantly reduced by RICTOR knock-down (*P < .05 vs. ctrl. Si; bars=SEM).
(A) RICTOR blockade with siRNA has no effect on HGF mRNA expression in MelIM melanoma cells in vitro. (B) Similar results were obtained upon RICTOR blockade in MelJU cells.
Acknowledgments
Acknowledgements
We want to thank Meenhard Herlyn (The Wistar Institute, Philadelphia, PA, USA) for providing different human melanoma cell lines and Scott Friedman (School of Medicine at Mount Sinai, New York, NY, USA) for providing LX2 cells. Furthermore, we thank Marvin Anders for excellent technical assistance.
Footnotes
Declaration of interest: None.
Funding; These studies were supported in part by the German Research Council (Deutsche Forschungsgemeinschaft (DFG) to Chr.H., Cl.H, E.K.G. and S.A.L. (FOR2127) and grants from the Interdisciplinary Center for Clinical Research (IZKF) Erlangen to P.D. and Cl.H.
Contributor Information
Katharina M. Schmidt, Email: Katharina.schmidt@ukr.de.
Peter Dietrich, Email: peter.dietrich@fau.de.
Christina Hackl, Email: christina.hackl@ukr.de.
Jessica Guenzle, Email: jessica.guenzle@uniklinik-freiburg.de.
Peter Bronsert, Email: peter.bronsert@uniklinik-freiburg.de.
Christine Wagner, Email: christine.wagner@ukr.de.
Stefan Fichtner-Feigl, Email: stefan.fichtner@uniklinik-freiburg.de.
Hans J. Schlitt, Email: hans.schlitt@ukr.de.
Edward K. Geissler, Email: edward.geissler@ukr.de.
Claus Hellerbrand, Email: claus.hellerbrand@fau.de.
Sven A. Lang, Email: sven.lang@uniklinik-freiburg.de.
References
- 1.Leiter U, Eigentler T, Garbe C. Epidemiology of skin cancer. Adv Exp Med Biol. 2014;810:120–140. doi: 10.1007/978-1-4939-0437-2_7. [DOI] [PubMed] [Google Scholar]
- 2.Tas F, Erturk K. Recurrence behavior in early-stage cutaneous melanoma: pattern, timing, survival, and influencing factors. Melanoma Res. 2017;27:134–139. doi: 10.1097/CMR.0000000000000332. [DOI] [PubMed] [Google Scholar]
- 3.Hodi FS, O'Day SJ, McDermott DF, Weber RW, Sosman JA, Haanen JB, Gonzalez R, Robert C, Schadendorf D, Hassel JC. Improved survival with ipilimumab in patients with metastatic melanoma. N Engl J Med. 2010;363:711–723. doi: 10.1056/NEJMoa1003466. [DOI] [PMC free article] [PubMed] [Google Scholar]
- 4.Tronnier M, Mitteldorf C. Treating advanced melanoma: current insights and opportunities. Cancer Manag Res. 2014;6:349–356. doi: 10.2147/CMAR.S49494. [DOI] [PMC free article] [PubMed] [Google Scholar]
- 5.Aubin JM, Rekman J, Vandenbroucke-Menu F, Lapointe R, Fairfull-Smith RJ, Mimeault R, Balaa FK, Martel G. Systematic review and meta-analysis of liver resection for metastatic melanoma. Br J Surg. 2013;100:1138–1147. doi: 10.1002/bjs.9189. [DOI] [PubMed] [Google Scholar]
- 6.Leiter U, Meier F, Schittek B, Garbe C. The natural course of cutaneous melanoma. J Surg Oncol. 2004;86:172–178. doi: 10.1002/jso.20079. [DOI] [PubMed] [Google Scholar]
- 7.Saxton RA, Sabatini DM. mTOR Signaling in Growth, Metabolism, and Disease. Cell. 2017;169:361–371. doi: 10.1016/j.cell.2017.03.035. [DOI] [PubMed] [Google Scholar]
- 8.Pretre V, Wicki A. Inhibition of Akt and other AGC kinases: A target for clinical cancer therapy? Semin Cancer Biol. 2017;48:70–77. doi: 10.1016/j.semcancer.2017.04.011. [DOI] [PubMed] [Google Scholar]
- 9.Sarbassov DD, Ali SM, Kim DH, Guertin DA, Latek RR, Erdjument-Bromage H, Tempst P, Sabatini DM. Rictor, a novel binding partner of mTOR, defines a rapamycin-insensitive and raptor-independent pathway that regulates the cytoskeleton. Curr Biol. 2004;14:1296–1302. doi: 10.1016/j.cub.2004.06.054. [DOI] [PubMed] [Google Scholar]
- 10.Kaibori M, Shikata N, Sakaguchi T, Ishizaki M, Matsui K, Iida H, Tanaka Y, Miki H, Nakatake R, Okumura T. Influence of Rictor and Raptor Expression of mTOR Signaling on Long-Term Outcomes of Patients with Hepatocellular Carcinoma. Dig Dis Sci. 2015;60:919–928. doi: 10.1007/s10620-014-3417-7. [DOI] [PubMed] [Google Scholar]
- 11.Schmidt KM, Hellerbrand C, Ruemmele P, Michalski CW, Kong B, Kroemer A, Hackl C, Schlitt HJ, Geissler EK, Lang SA. Inhibition of mTORC2 component RICTOR impairs tumor growth in pancreatic cancer models. Oncotarget. 2017;8:24491–24505. doi: 10.18632/oncotarget.15524. [DOI] [PMC free article] [PubMed] [Google Scholar]
- 12.Sticz T, Molnar A, Mark A, Hajdu M, Nagy N, Vegso G, Micsik T, Kopper L, Sebestyen A. mTOR activity and its prognostic significance in human colorectal carcinoma depending on C1 and C2 complex-related protein expression. J Clin Pathol. 2017;70:410–416. doi: 10.1136/jclinpath-2016-203913. [DOI] [PubMed] [Google Scholar]
- 13.Laugier F, Finet-Benyair A, Andre J, Rachakonda PS, Kumar R, Bensussan A, Dumaz N. RICTOR involvement in the PI3K/AKT pathway regulation in melanocytes and melanoma. Oncotarget. 2015;6:28120–28131. doi: 10.18632/oncotarget.4866. [DOI] [PMC free article] [PubMed] [Google Scholar]
- 14.Chen XY, Li DF, Han JC, Wang B, Dong ZP, Yu LN, Pan ZH, Qu CJ, Chen Y, Sun SG. Reprogramming induced by isoliquiritigenin diminishes melanoma cachexia through mTORC2-AKT-GSK3beta signaling. Oncotarget. 2017;8:34565–34575. doi: 10.18632/oncotarget.16655. [DOI] [PMC free article] [PubMed] [Google Scholar]
- 15.Liang X, Sun R, Zhao X, Zhang Y, Gu Q, Dong X, Zhang D, Sun J, Sun B. Rictor regulates the vasculogenic mimicry of melanoma via the AKT-MMP-2/9 pathway. J Cell Mol Med. 2017;21:3579–3591. doi: 10.1111/jcmm.13268. [DOI] [PMC free article] [PubMed] [Google Scholar]
- 16.Van den Eynden GG, Majeed AW, Illemann M, Vermeulen PB, Bird NC, Hoyer-Hansen G, Eefsen RL, Reynolds AR, Brodt P. The multifaceted role of the microenvironment in liver metastasis: biology and clinical implications. Cancer Res. 2013;73:2031–2043. doi: 10.1158/0008-5472.CAN-12-3931. [DOI] [PubMed] [Google Scholar]
- 17.Brodt P. Role of the Microenvironment in Liver Metastasis: From Pre- to Prometastatic Niches. Clin Cancer Res. 2016;22:5971–5982. doi: 10.1158/1078-0432.CCR-16-0460. [DOI] [PubMed] [Google Scholar]
- 18.Vidal-Vanaclocha F. The prometastatic microenvironment of the liver. Cancer Microenviron. 2008;1:113–129. doi: 10.1007/s12307-008-0011-6. [DOI] [PMC free article] [PubMed] [Google Scholar]
- 19.Vidal-Vanaclocha F. The liver prometastatic reaction of cancer patients: implications for microenvironment-dependent colon cancer gene regulation. Cancer Microenviron. 2011;4:163–180. doi: 10.1007/s12307-011-0084-5. [DOI] [PMC free article] [PubMed] [Google Scholar]
- 20.Kang N, Gores GJ, Shah VH. Hepatic stellate cells: partners in crime for liver metastases? Hepatology. 2011;54:707–713. doi: 10.1002/hep.24384. [DOI] [PMC free article] [PubMed] [Google Scholar]
- 21.Olaso E, Salado C, Egilegor E, Gutierrez V, Santisteban A, Sancho-Bru P, Friedman SL, Vidal-Vanaclocha F. Proangiogenic role of tumor-activated hepatic stellate cells in experimental melanoma metastasis. Hepatology. 2003;37:674–685. doi: 10.1053/jhep.2003.50068. [DOI] [PubMed] [Google Scholar]
- 22.Chen CH, Kuo LM, Chang Y, Wu W, Goldbach C, Ross MA, Stolz DB, Chen L, Fung JJ, Lu L. In vivo immune modulatory activity of hepatic stellate cells in mice. Hepatology. 2006;44:1171–1181. doi: 10.1002/hep.21379. [DOI] [PubMed] [Google Scholar]
- 23.Amann T, Bataille F, Spruss T, Muhlbauer M, Gabele E, Scholmerich J, Kiefer P, Bosserhoff AK, Hellerbrand C. Activated hepatic stellate cells promote tumorigenicity of hepatocellular carcinoma. Cancer Sci. 2009;100:646–653. doi: 10.1111/j.1349-7006.2009.01087.x. [DOI] [PMC free article] [PubMed] [Google Scholar]
- 24.Shimizu S, Yamada N, Sawada T, Ikeda K, Kawada N, Seki S, Kaneda K, Hirakawa K. In vivo and in vitro interactions between human colon carcinoma cells and hepatic stellate cells. Jpn J Cancer Res. 2000;91:1285–1295. doi: 10.1111/j.1349-7006.2000.tb00916.x. [DOI] [PMC free article] [PubMed] [Google Scholar]
- 25.Meyer T, Koch A, Ebert EV, Czech B, Mueller M, Bosserhoff A, Lang SA, Hellerbrand C. Effect of melanoma cells on proliferation and migration of activated hepatic stellate cells in vitro. Pathol Res Pract. 2017;213:400–404. doi: 10.1016/j.prp.2016.12.014. [DOI] [PubMed] [Google Scholar]
- 26.Xu L, Hui AY, Albanis E, Arthur MJ, O'Byrne SM, Blaner WS, Mukherjee P, Friedman SL, Eng FJ. Human hepatic stellate cell lines, LX-1 and LX-2: new tools for analysis of hepatic fibrosis. Gut. 2005;54:142–151. doi: 10.1136/gut.2004.042127. [DOI] [PMC free article] [PubMed] [Google Scholar]
- 27.Schnabl B, Choi YH, Olsen JC, Hagedorn CH, Brenner DA. Immortal activated human hepatic stellate cells generated by ectopic telomerase expression. Lab Investig. 2002;82:323–333. doi: 10.1038/labinvest.3780426. [DOI] [PubMed] [Google Scholar]
- 28.Schmidt J, Riechers A, Stoll R, Amann T, Fink F, Spruss T, Gronwald W, Konig B, Hellerbrand C, Bosserhoff AK. Targeting melanoma metastasis and immunosuppression with a new mode of melanoma inhibitory activity (MIA) protein inhibition. PLoS One. 2012;7 doi: 10.1371/journal.pone.0037941. [DOI] [PMC free article] [PubMed] [Google Scholar]
- 29.Engelmann JC, Amann T, Ott-Rotzer B, Nutzel M, Reinders Y, Reinders J, Thasler WE, Kristl T, Teufel A, Huber CG. Causal Modeling of Cancer-Stromal Communication Identifies PAPPA as a Novel Stroma-Secreted Factor Activating NFkappaB Signaling in Hepatocellular Carcinoma. PLoS Comput Biol. 2015;11 doi: 10.1371/journal.pcbi.1004293. [DOI] [PMC free article] [PubMed] [Google Scholar]
- 30.Rhodes DR, Yu J, Shanker K, Deshpande N, Varambally R, Ghosh D, Barrette T, Pandey A, Chinnaiyan AM. ONCOMINE: a cancer microarray database and integrated data-mining platform. Neoplasia. 2004;6:1–6. doi: 10.1016/s1476-5586(04)80047-2. [DOI] [PMC free article] [PubMed] [Google Scholar]
- 31.Scheller T, Hellerbrand C, Moser C, Schmidt K, Kroemer A, Brunner SM, Schlitt HJ, Geissler EK, Lang SA. mTOR inhibition improves fibroblast growth factor receptor targeting in hepatocellular carcinoma. Br J Cancer. 2015;112:841–850. doi: 10.1038/bjc.2014.638. [DOI] [PMC free article] [PubMed] [Google Scholar]
- 32.Guenzle J, Wolf LJ, Garrelfs NW, Goeldner JM, Osterberg N, Schindler CR, Saavedra JE, Weyerbrock A. ATF3 reduces migration capacity by regulation of matrix metalloproteinases via NFkappaB and STAT3 inhibition in glioblastoma. Cell Death Dis. 2017;3:17006. doi: 10.1038/cddiscovery.2017.6. [DOI] [PMC free article] [PubMed] [Google Scholar]
- 33.Koch A, Lang SA, Wild PJ, Gantner S, Mahli A, Spanier G, Berneburg M, Muller M, Bosserhoff AK, Hellerbrand C. Glucose transporter isoform 1 expression enhances metastasis of malignant melanoma cells. Oncotarget. 2015;6:32748–32760. doi: 10.18632/oncotarget.4977. [DOI] [PMC free article] [PubMed] [Google Scholar]
- 34.Hackl C, Schacherer D, Anders M, Wiedemann LM, Mohr A, Schlitt HJ, Stroszczynski C, Tranquart F, Jung EM. Improved Detection of preclinical Colorectal Liver Metastases by High Resolution Ultrasound including Molecular Ultrasound Imaging using the targeted Contrast Agent BR55. Ultraschall Med. 2016;37:290–296. doi: 10.1055/s-0041-111838. [DOI] [PubMed] [Google Scholar]
- 35.Brandes F, Schmidt K, Wagner C, Redekopf J, Schlitt HJ, Geissler EK, Lang SA. Targeting cMET with INC280 impairs tumour growth and improves efficacy of gemcitabine in a pancreatic cancer model. BMC Cancer. 2015;15:71. doi: 10.1186/s12885-015-1064-9. [DOI] [PMC free article] [PubMed] [Google Scholar]
- 36.Pannem RR, Dorn C, Hellerbrand C, Massoumi R. Cylindromatosis gene CYLD regulates hepatocyte growth factor expression in hepatic stellate cells through interaction with histone deacetylase 7. Hepatology. 2014;60:1066–1081. doi: 10.1002/hep.27209. [DOI] [PubMed] [Google Scholar]
- 37.Roesch A, Vogt T, Stolz W, Dugas M, Landthaler M, Becker B. Discrimination between gene expression patterns in the invasive margin and the tumour core of malignant melanomas. Melanoma Res. 2003;13:503–509. doi: 10.1097/00008390-200310000-00009. [DOI] [PubMed] [Google Scholar]
- 38.Smith AP, Hoek K, Becker D. Whole-genome expression profiling of the melanoma progression pathway reveals marked molecular differences between nevi/melanoma in situ and advanced-stage melanomas. Cancer Biol Ther. 2005;4:1018–1029. doi: 10.4161/cbt.4.9.2165. [DOI] [PubMed] [Google Scholar]
- 39.Bogunovic D, O'Neill DW, Belitskaya-Levy I, Vacic V, Yu YL, Adams S, Darvishian F, Berman R, Shapiro R, Pavlick AC. Immune profile and mitotic index of metastatic melanoma lesions enhance clinical staging in predicting patient survival. Proc Natl Acad Sci U S A. 2009;106:20429–20434. doi: 10.1073/pnas.0905139106. [DOI] [PMC free article] [PubMed] [Google Scholar]
- 40.Haqq C, Nosrati M, Sudilovsky D, Crothers J, Khodabakhsh D, Pulliam BL, Federman S, Miller JR, III, Allen RE, Singer MI. The gene expression signatures of melanoma progression. Proc Natl Acad Sci U S A. 2005;102:6092–6097. doi: 10.1073/pnas.0501564102. [DOI] [PMC free article] [PubMed] [Google Scholar]
- 41.Liu WT, Jing YY, Yu GF, Chen H, Han ZP, Yu DD, Fan QM, Ye F, Li R, Gao L. Hepatic stellate cell promoted hepatoma cell invasion via the HGF/c-Met signaling pathway regulated by p53. Cell Cycle. 2016;15:886–894. doi: 10.1080/15384101.2016.1152428. [DOI] [PMC free article] [PubMed] [Google Scholar]
- 42.Olaso E, Santisteban A, Bidaurrazaga J, Gressner AM, Rosenbaum J, Vidal-Vanaclocha F. Tumor-dependent activation of rodent hepatic stellate cells during experimental melanoma metastasis. Hepatology. 1997;26:634–642. doi: 10.1002/hep.510260315. [DOI] [PubMed] [Google Scholar]
- 43.Aghayan DL, Kazaryan AM, Fretland AA, Sahakyan MA, Rosok BI, Bjornbeth BA, Edwin B. Laparoscopic liver resection for metastatic melanoma. Surg Endosc. 2018;32:1470–1477. doi: 10.1007/s00464-017-5834-0. [DOI] [PubMed] [Google Scholar]
- 44.Balch CM, Soong SJ, Gershenwald JE, Thompson JF, Reintgen DS, Cascinelli N, Urist M, McMasters KM, Ross MI, Kirkwood JM. Prognostic factors analysis of 17,600 melanoma patients: validation of the American Joint Committee on Cancer melanoma staging system. J Clin Oncol. 2001;19:3622–3634. doi: 10.1200/JCO.2001.19.16.3622. [DOI] [PubMed] [Google Scholar]
- 45.Bian Y, Wang Z, Xu J, Zhao W, Cao H, Zhang Z. Elevated Rictor expression is associated with tumor progression and poor prognosis in patients with gastric cancer. Biochem Biophys Res Commun. 2015;464:534–540. doi: 10.1016/j.bbrc.2015.07.001. [DOI] [PubMed] [Google Scholar]
- 46.Roulin D, Cerantola Y, Dormond-Meuwly A, Demartines N, Dormond O. Targeting mTORC2 inhibits colon cancer cell proliferation in vitro and tumor formation in vivo. Mol Cancer. 2010;9:57. doi: 10.1186/1476-4598-9-57. [DOI] [PMC free article] [PubMed] [Google Scholar]
- 47.Amaral T, Sinnberg T, Meier F, Krepler C, Levesque M, Niessner H, Garbe C. The mitogen-activated protein kinase pathway in melanoma part I - Activation and primary resistance mechanisms to BRAF inhibition. Eur J Cancer. 2017;73:85–92. doi: 10.1016/j.ejca.2016.12.010. [DOI] [PubMed] [Google Scholar]
- 48.Xue G, Romano E, Massi D, Mandala M. Wnt/beta-catenin signaling in melanoma: Preclinical rationale and novel therapeutic insights. Cancer Treat Rev. 2016;49:1–12. doi: 10.1016/j.ctrv.2016.06.009. [DOI] [PubMed] [Google Scholar]
- 49.Gulhati P, Bowen KA, Liu J, Stevens PD, Rychahou PG, Chen M, Lee EY, Weiss HL, O'Connor KL, Gao T. mTORC1 and mTORC2 regulate EMT, motility, and metastasis of colorectal cancer via RhoA and Rac1 signaling pathways. Cancer Res. 2011;71:3246–3256. doi: 10.1158/0008-5472.CAN-10-4058. [DOI] [PMC free article] [PubMed] [Google Scholar]
- 50.Zhang F, Zhang X, Li M, Chen P, Zhang B, Guo H, Cao W, Wei X, Cao X, Hao X. mTOR complex component Rictor interacts with PKCzeta and regulates cancer cell metastasis. Cancer Res. 2010;70:9360–9370. doi: 10.1158/0008-5472.CAN-10-0207. [DOI] [PubMed] [Google Scholar]
- 51.Daulat AM, Bertucci F, Audebert S, Serge A, Finetti P, Josselin E, Castellano R, Birnbaum D, Angers S, Borg JP. PRICKLE1 Contributes to Cancer Cell Dissemination through Its Interaction with mTORC2. Dev Cell. 2016;37:311–325. doi: 10.1016/j.devcel.2016.04.011. [DOI] [PubMed] [Google Scholar]
- 52.Morrison Joly M, Williams MM, Hicks DJ, Jones B, Sanchez V, Young CD, Sarbassov DD, Muller WJ, Brantley-Sieders D, Cook RS. Two distinct mTORC2-dependent pathways converge on Rac1 to drive breast cancer metastasis. Breast Cancer Res. 2017;19:74. doi: 10.1186/s13058-017-0868-8. [DOI] [PMC free article] [PubMed] [Google Scholar]
- 53.Li N, Xue W, Yuan H, Dong B, Ding Y, Liu Y, Jiang M, Kan S, Sun T, Ren J. AKT-mediated stabilization of histone methyltransferase WHSC1 promotes prostate cancer metastasis. J Clin Invest. 2017;127:1284–1302. doi: 10.1172/JCI91144. [DOI] [PMC free article] [PubMed] [Google Scholar]
- 54.Sun B, Chen L, Fu H, Guo L, Guo H, Zhang N. Upregulation of RICTOR gene transcription by the proinflammatory cytokines through NF-kappaB pathway contributes to the metastasis of renal cell carcinoma. Tumour Biol. 2016;37:4457–4466. doi: 10.1007/s13277-015-4296-z. [DOI] [PubMed] [Google Scholar]
- 55.Oh BY, Hong HK, Lee WY, Cho YB. Animal models of colorectal cancer with liver metastasis. Cancer Lett. 2017;387:114–120. doi: 10.1016/j.canlet.2016.01.048. [DOI] [PubMed] [Google Scholar]
- 56.Francia G, Cruz-Munoz W, Man S, Xu P, Kerbel RS. Mouse models of advanced spontaneous metastasis for experimental therapeutics. Nat Rev Cancer. 2011;11:135–141. doi: 10.1038/nrc3001. [DOI] [PMC free article] [PubMed] [Google Scholar]
- 57.Liu C, Billadeau DD, Abdelhakim H, Leof E, Kaibuchi K, Bernabeu C, Bloom GS, Yang L, Boardman L, Shah VH. IQGAP1 suppresses TbetaRII-mediated myofibroblastic activation and metastatic growth in liver. J Clin Invest. 2013;123:1138–1156. doi: 10.1172/JCI63836. [DOI] [PMC free article] [PubMed] [Google Scholar]
- 58.Matsusue R, Kubo H, Hisamori S, Okoshi K, Takagi H, Hida K, Nakano K, Itami A, Kawada K, Nagayama S. Hepatic stellate cells promote liver metastasis of colon cancer cells by the action of SDF-1/CXCR4 axis. Ann Surg Oncol. 2009;16:2645–2653. doi: 10.1245/s10434-009-0599-x. [DOI] [PubMed] [Google Scholar]
Associated Data
This section collects any data citations, data availability statements, or supplementary materials included in this article.
Supplementary Materials
(A) RICTOR mRNA levels tended to be higher according to the Clark levels (IV: n=16; V: n=2). The data were obtained from the OncomineTM cancer microarray database using the dataset "Roesch Melanoma" (n=18 samples). (B) RICTOR mRNA levels in "advanced stage" (vertical growth phase melanoma, metastatic growth phase melanoma and melanoma positive lymph nodes, n=7) tended to be higher compared to "early stage" (benign nevi and melanoma in situ, n=6) tissue samples. The data were obtained from the OncomineTM cancer microarray database using the dataset "Smith Skin" (n=18 samples). (C) RICTOR mRNA expression in M1b-stage (N=3) as compared to M1c-stage tissues (N=2) from metastatic melanoma. A trend towards higher expression in M1c-stage was observed. The data were obtained from the OncomineTM cancer microarray database using the dataset "Bogunovic Melanoma" (n=44 samples). (D) RICTOR mRNA expression levels in melanoma tissue samples derived from primary (n=6) compared to metastatic (n=14) tumor sites. The data were obtained from the OncomineTM cancer microarray database using the dataset "Haqq Melanoma" (n=37 samples). (E) Cytoplasma positive staining for RICTOR. Furthermore, RICTOR demonstrates a strong positive staining in granulocytes.
(A) MTT assay with MelIM showed a significantly reduced signal upon RICTOR inhibition after 48 hours (*P < .05 vs. ctrl. Si; bars=SEM). (B) Similar, in MelJU RICTOR blockade led to reduced signal 48 hours (*P < .05 vs. ctrl. Si; bars=SEM). However, growth inhibitory effects were not confirmed using the cell count assay (data not shown)
(RT-PCR from liver tissue) (A) Only a trend towards reduced RICTOR mRNA expression was found in liver tissue 10 days after tumor cells inoculation. However, analysis was not performed with microdissected liver metastases which might explain the missing reduction. (B) Expression of αSMA mRNA in liver tissue did not differ between RICTOR knock-down groups and control in vivo. (C) Similar, no difference of collagen-α1 mRNA expression was found. (D) Analysis of HGF mRNA from liver tissue did not show a difference between control and RICTOR knock-down in vivo.
(A) Conditioned medium (CM) from HSChTERT led to significant induction of MelJU motility after 24 hours (#P < .05 vs. untreated cells; bars=SEM). RICTOR knock-down in MelJU significantly reduced this effect (*P < .05 vs. ctrl. Si; bars=SEM). (B) Similar results were obtained upon incubation of MelJU with CM from LX2 cells. Again, a significant induction of motility was found (#P < .05 vs. untreated cells; bars=SEM) which was significantly reduced by RICTOR knock-down (*P < .05 vs. ctrl. Si; bars=SEM).
(A) RICTOR blockade with siRNA has no effect on HGF mRNA expression in MelIM melanoma cells in vitro. (B) Similar results were obtained upon RICTOR blockade in MelJU cells.