

Abstract
Diabetes is a chronic metabolic disorder that affects 415 million people worldwide. This pathology is often associated with long-term complications, such as critical limb ischemia (CLI), which increases the risk of limb loss and mortality. Mesenchymal stromal cells (MSCs) represent a promising option for the treatment of diabetes complications. Although MSCs are widely used in autologous cell-based therapy, their effects may be influenced by the constant crosstalk between the graft and the host, which could affect the MSC fate potential. In this context, we previously reported that MSCs derived from diabetic patients with CLI have a defective phenotype that manifests as reduced fibrinolytic activity, thereby enhancing the thrombotic risk and compromising patient safety. Here, we found that MSCs derived from diabetic patients with CLI not only exhibit a prothrombotic profile but also have altered multi-differentiation potential, reduced proliferation, and inhibited migration and homing to sites of inflammation. We further demonstrated that this aberrant cell phenotype is reversed by the platelet-derived growth factor (PDGF) BB, indicating that PDGF signaling is a key regulator of MSC functionality. These findings provide an attractive approach to improve the therapeutic efficacy of MSCs in autologous therapy for diabetic patients.
Keywords: adipose-derived mesenchymal stromal cells, PDGF, thrombotic state, migration, proliferation, homing, critical limb ischemia, diabetes
Graphical Abstract
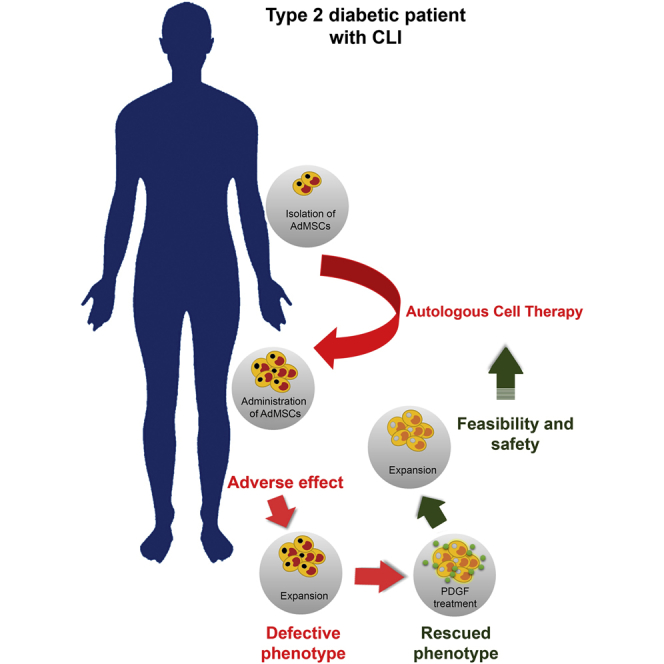
Capilla-González et al. show that adipose-derived mesenchymal stromal cells (AdMSCs) from a diabetic patient with critical limb ischemia (CLI) display a defective phenotype that can be reversed by the platelet-derived growth factor (PDGF) BB, enabling safer and more suitable AdMSCs for the development of new cell-based therapy for diabetic patients.
Introduction
Diabetes mellitus (DM) is a chronic disease characterized by alterations in insulin regulation and glucose uptake. This pathological condition is often associated with vascular complications, such as critical limb ischemia (CLI) that manifests as chronic resting pain, non-healing limb ulcers and gangrene. Diabetic patients with CLI generally have a poor prognosis, with a high risk of major amputation and premature mortality.1 Cell-based therapies represent a promising strategy for the treatment of CLI, helping to avoid amputation in these patients.2, 3, 4, 5, 6, 7 Particularly, mesenchymal stromal cells (MSCs) have shown significant therapeutic potential due to their fibrinolytic and antithrombogenic properties.8, 9, 10, 11, 12 To date, there are more than 10 registered clinical trials (https://www.clinicaltrials.gov) using autologous MSCs for the treatment of diabetes and its complications, and these cells are presumably safer and more effective than allogenic cells. However, the therapeutic effects of MSCs have been questioned when they come from a diabetic milieu.13, 14, 15, 16, 17 We have completed a phase I/II trial on the use of autologous adipose-derived MSCs (AdMSCs) for the treatment of CLI in diabetic patients (ClinicalTrials.gov: NCT01257776). In our clinical study, two individuals with type 2 diabetes mellitus (T2DM) developed distal microthrombosis after intra-arterial infusion. Therefore, we investigated the phenotype of AdMSCs derived from these two patients and found reduced fibrinolytic activity when exposed to diabetic blood sera.13 A full understanding of the phenotypic changes occurring in MSCs during diabetes will help us to maximize their therapeutic effectiveness and minimize the side effects of autologous cell therapy.
The platelet-derived growth factor (PDGF) pathway is known to modulate the coagulation and fibrinolysis systems that control blood clots formation.18, 19, 20, 21, 22, 23, 24 The PDGF family consists of four ligands (AA, BB, CC, and DD) that interact with two PDGF receptor isoforms (PDGFRα and PDGFRβ). PDGF binding to its receptor activates an intrinsic tyrosine kinase activity that initiates intracellular signaling cascades, e.g., phosphatidylinositol 3-kinase (PI3K), Janus kinase (JAK), and the extracellular signal-regulated protein kinase (ERK).25 Several reports indicate that members of the PDGF pathway (i.e., PDGF-BB, ERK, and its downstream target SMAD) mediate the expression of tissue factor (TF),18, 19, 20, 21, 22 the key initiator of the coagulation cascade.26 Fibrinolysis is also enhanced by PDGF-BB, which is involved in the hyalocyte-mediated degradation of fibrin clots in vitreous body hemorrhage.23, 24 Moreover, PDGF is a critical regulator of essential MSC processes, such as proliferation, differentiation, cell motility, and angiogenesis.27, 28, 29, 30, 31 A more robust understanding of how PDGF signaling modulates MSC biology may be crucial for elucidating the functional modifications that these cells undergo during diabetes and other diseases.
In this study, we aimed to thoroughly characterize AdMSCs derived from T2DM patients with CLI who experienced adverse events during autologous cell therapy (i.e., therapeutically non-effective MSCs) and to seek strategies to restore the defective phenotype. We found that AdMSCs showed reduced proliferative and migratory capacities compared to AdMSCs derived from healthy individuals, in addition to exhibiting a prothrombotic phenotype. These alterations were associated with impaired PDGF signaling and were restored by PDGF-BB stimulation. Our findings indicate that the use of PDGF-BB could represent a promising approach to rescue the impaired phenotypes of AdMSCs isolated from diabetic patients before being used in autologous cell therapy. This strategy will potentially minimize the risk of subsequent adverse events in the host.
Results
D-AdMSCs Preserved Their Specific Cell-Surface Markers but Displayed Altered Differentiation Tendency
We first examined the expression of MSC-specific markers in AdMSCs isolated from T2DM patients with CLI who underwent the adverse event previously described13 (D-AdMSCs) and AdMSCs isolated from healthy donors (C-AdMSCs). Flow cytometry analysis revealed that D-AdMSCs and C-AdMSCs expressed the markers CD29, CD13, CD73, CD105, and CD90. In contrast, both D-AdMSCs and C-AdMSCs were negative for the expression of CD31, CD45, CD34, and human leukocyte antigen (HLA) II (Figure 1A). Culture-expanded D-AdMSCs were morphologically similar to C-AdMSCs and were able to differentiate into adipogenic and osteogenic lineages (Figure 1B). However, the differentiation tendency of D-AdMSCs was altered compared to C-AdMSCs. When exposed to adipogenic differentiation media, D-AdMSCs displayed an enhanced capacity to generate adipocytes, as demonstrated by the presence of intracellular lipid droplets stained with oil red O (D-AdMSCs, 3.35% ± 0.31%; C-AdMSCs, 1.75% ± 0.24%; p = 0.007) (Figure 1C). In contrast, when exposed to osteogenic differentiation media, D-AdMSCs exhibited a reduced capacity to generate osteocytes, as demonstrated by lower alkaline phosphatase activity (D-AdMSCs, 2.7% ± 0.9%; C-AdMSCs, 57.9% ± 5.7%; p = 0.00008) (Figure 1D). Altogether, these results suggest that D-AdMSCs preserve the stemness potential but exhibit an altered differentiation tendency.
Figure 1.

Characterization of C-AdMSCs and D-AdMSCs
(A) Flow cytometry analysis of cultured AdMSCs showing that both control and diabetic cells were positive for the MSC-specific markers CD29, CD13, CD73, CD105, and CD90, whereas they were negative for CD31, CD45, CD34, and HLA II. Respective isotype controls were used to define gate M1 and discard non-specific staining (less than 1%). (B) Phase contrast image of primary subconfluent cultures of C-AdMSCs and D-AdMSCs showing typical adherent fibroblast-like morphology, adipogenic differentiation (demonstrated by the presence of lipid droplets stained with oil red O), and osteogenic differentiation (demonstrated by alkaline phosphatase activity). (C) Quantification of the area occupied by the oil red O staining. (D) Quantification of the area occupied by the alkaline phosphatase staining. Scale bar: 100 μm in (B). Data are represented as mean ± SEM. **p < 0.01 (two-tailed t test).
Proliferation and Migration Capacities Were Decreased in D-AdMSCs
To determine whether diabetes affects the in vitro proliferative capacity of AdMSCs, we first performed colony-forming unit assays. We noted a reduction in the number of colonies (D-AdMSCs, 47.33 ± 3.67 colonies; C-AdMSCs, 71.33 ± 2.73 colonies; p = 0.006), as well as in the size of those colonies (D-AdMSCs, 18.93 ± 1.17 mm2; C-AdMSCs, 25.26 ± 1.74 mm2; p = 0.017), in D-AdMSCs compared to C-AdMSCs (Figures 2A–2C). Similarly, Ki67 immunocytochemistry indicated that D-AdMSCs proliferated 73% less than C-AdMSCs (D-AdMSCs, 13.9% ± 1.8%; C-AdMSCs, 51.6% ± 2.5%; p = 3 × 10⁻¹⁰) (Figures 2D and 2E). We further measured the proliferative capacity of AdMSCs by determining the incorporation of bromodeoxyuridine (BrdU) by flow cytometry 3 hr after BrdU incubation. The results revealed that D-AdMSCs incorporated 2.5-fold less BrdU than did C-AdMSCs (Figure 2F). The metabolic activity, determined by alamarBlue assay over an 8-day period, supported this reduction in D-AdMSC proliferation (Figure S1A). Altogether, these results indicate that the ability to proliferate is compromised in AdMSCs derived from diabetic patients with CLI.
Figure 2.

Migratory and Proliferative Capacities of C-AdMSCs and D-AdMSCs
(A) Representative image of colony-forming unit assays stained with cresyl violet from C-AdMSCs and D-AdMSCs. (B) Graph depicting the number of AdMSC colonies. Note the decreased number of colonies in D-AdMSCs. (C) Graph depicting the size of the AdMSC colonies. Note the decreased colony size in D-AdMSCs. (D) Quantification of Ki67+ cells, revealing a reduction in the percentage of proliferative cells in D-AdMSCs. (E) Immunocytochemistry against Ki67 (green) in C-AdMSCs and D-AdMSCs. Cell nuclei were stained with Hoechst dye (blue). (F) Representative flow cytometric analysis of BrdU incorporation by C-AdMSCs and D-AdMSCs. Percentage of cells expressing BrdU is indicated. Cells were exposed to BrdU for 3 hr before cell fixation. (G) Graph depicting the percentage of reduction of the scratched area after 48 hr. (H) Representative phase contrast images of a scratch assay showing the migration of AdMSCs after 48 hr. (I) Graph depicting the number of migrated cells through a transwell membrane after 48 hr. (J) Cresyl violet staining of AdMSCs that transmigrated through a transwell membrane after 48 hr. Scale bars: 100 μm in (E and H) and 50 μm in (J). Data are represented as mean ± SEM. *p < 0.05, **p < 0.001 (two-tailed t test).
Next, the migratory capacity of AdMSCs was analyzed by scratch assays. The results showed that both C-AdMSCs and D-AdMSCs were able to invade the scratch area within the first 6 hr (reduction index: D-AdMSCs, 6.96% ± 0.86%; C-AdMSCs, 11.08% ± 1.17%; p = 0.02). However, D-AdMSCs showed a significant reduction in the invasiveness 48 hr after scratching compared to controls (D-AdMSCs, 39.9% ± 6.7%; C-AdMSCs, 83.4% ± 1.7%; p = 9.3 × 10⁻⁵) (Figures 2G and 2H). To further investigate the migratory capacity of AdMSCs, we used Boyden’s chamber method. The results revealed that migration through 8-μm pore transwell membranes was reduced by 43.5% for D-AdMSCs 48 hr after seeding (D-AdMSCs, 82 ± 4 cells; C-AdMSCs, 149 ± 6 cells; p = 1.4 × 10⁻⁵) (Figures 2I and 2J).
To eliminate the possibility that reduced cell viability may be the cause of the differences observed in proliferation and migration, apoptosis levels were evaluated using Annexin V/propidium iodide staining and flow cytometry. The results showed non-significant differences between C-AdMSCs and D-AdMSCs (Figure S1B). The numbers of live and dead cells in culture were also examined with the trypan blue exclusion test using a hemocytometer. Quantification of non-stained (viable cells) (D-AdMSCs, 96.54% ± 0.8%; C-AdMSCs, 97.31% ± 1.4%; p = 0.66) and stained cells (dead cells) (D-AdMSCs, 2.22% ± 0.97%; C-AdMSCs, 1.12% ± 0.97%; p = 0.50) also showed non-significant differences between C-AdMSCs and D-AdMSCs (Figure S1C).
Coagulation and Fibrinolytic Factors Were Altered in D-AdMSCs
To determine whether the coagulation and fibrinolysis cascades were altered in D-AdMSCs, we measured the mRNA expression levels of coagulation and fibrinolytic factors (Figure S2) by real-time qRT-PCR. The results revealed that TF pathway inhibitor (Tfpi), metalloprotease 2 (Mmp2), tissue inhibitor of metalloprotease 2 (Timp2), α2-antiplasmin, and particularly Tf were upregulated in D-AdMSCs compared to control cells (Figure 3A). Despite the overall increase, pro-coagulation factors increased more than 2-fold compared to pro-fibrinolytic factors (p = 3.19 × 10⁻⁴), suggesting a prothrombotic phenotype (Figure 3B). The notable increase in Tf was further demonstrated by flow cytometry, which showed that D-AdMSCs expressed 5-fold higher levels of TF protein than control cells (Figure 3C). Immunofluorescence analysis determined an evident perinuclear accumulation of TF in C-AdMSCs, whereas there was a homogeneous cytoplasmic and cell surface distribution of TF in D-AdMSCs (Figure 3D). In addition, we measured levels of extracellular plasminogen activator inhibitor type 1 (PAI-1) and tissue plasminogen activator (tPA), key factors of the fibrinolysis cascade, in the media of cultured AdMSCs (Figures 3E–3G). Although no significant changes in tPA levels were noted, media from D-AdMSCs contained 35% more PAI-1 than did control cells (D-AdMSCs, 120,518 ± 2,749 pg/mL; C-AdMSCs, 89,318 ± 2,806 pg/mL; p = 0.00002). Thus, the tPA/PAI-1 ratio was reduced in D-AdMSCs (D-AdMSCs, 0.008 ± 0.0001 a.u.; C-AdMSCs, 0.012 ± 0.0007 a.u.; p = 0.007). In summary, AdMSCs derived from diabetic patients with CLI exhibited an increase in coagulation factors, particularly TF, accompanied by an increased release of the antifibrinolytic PAI-1.
Figure 3.

Coagulation and Fibrinolytic Factors in C-AdMSCs and D-AdMSCs
(A) qRT-PCR measurements for a selected set of genes involved in coagulation and fibrinolysis. The results were normalized to the internal controls Ppia and Rplp0. Note the increased expression of all tested genes in D-AdMSCs compared to C-AdMSCs (set as 1; red line). (B) Bar graph depicting the combined expression of prothrombotic (Tf, Timp2, and α2-antiplasmin) and profibrinolytic (Tfpi and Mmp2) genes assessed in (A). (C) Representative flow cytometry analysis determining the percentage of AdMSCs expressing the pro-coagulant marker TF. Note the higher expression of TF in the D-AdMSC population. (D) Immunocytochemistry staining for TF (green) in D-AdMSCs and C-AdMSCs. Cell nuclei were stained with Hoechst dye (blue). Staining for TF was more evident in the perinuclear region of C-AdMSCs, while it was homogeneously distributed in the surface and cytoplasm of D-AdMSCs. (E) Bar graph depicting a significant increase in the secretion of PAI-1 by cultured D-AdMSCs. (F) Bar graph depicting no differences in the secretion of tPA by cultured D-AdMSCs. (G) Bar graph depicting a significant decrease in the tPA/PAI-1 ratio of D-AdMSCs. Scale bar: 100 μm in (D). Data are represented as mean ± SEM. *p < 0.05, **p < 0.01, ***p < 0.001 (two-tailed t test).
PDGF Signaling Was Compromised in AdMSCs Derived from T2DM Patients
We next evaluated whether TF expression may be modulated by PDGF signaling. PDGF levels were first measured by determining PDGF serum concentrations in healthy (C-serum) and diabetic (D-serum) subjects. ELISA for PDGF-BB showed increased levels of this factor in D-serum compared to C-serum (D-serum, 2,177 ± 1.5 pg/mL; C-serum, 563 ± 32 pg/mL; p = 0.012), suggesting a dysfunctional signaling environment for D-AdMSCs (Figure 4A). Similar results were found for PDGF-AA (Figure S3). PDGF levels in the conditioned media of cultured AdMSCs were below the limits of detection. PDGF-BB is the highest-affinity ligand for PDGFRβ. Thus, we evaluated the expression of this receptor isoform by flow cytometry, immunocytochemistry, and western blot, detecting no differences between D-AdMSCs and C-AdMSCs (Figures 4B–4E; Figure S3). Next, PDGFRβ phosphorylation was evaluated in the presence of PDGF-BB stimulation (20 ng/mL) by western blot (Figures 4F and 4I). The results revealed that PDGFRβ was transiently phosphorylated in both groups, with maximal activation 5–15 min after stimulation. However, PDGFRβ phosphorylation levels in D-AdMSCs were lower compared to control cells at all time points. This result indicates that although diabetic patients exhibit increased circulating PDGF-BB levels, PDGFRβ sensitivity to its ligand is diminished. We then examined the downstream signaling effects on ERK1/2 and SMAD2/3. Under basal conditions (i.e., non-PDGF stimulation), phospho-ERK1/2 (pERK1/2) was decreased in D-AdMSCs compared to C-AdMSCs, while phosphor-SMAD subtype 2 (pSMAD2) levels were increased. As expected, PDGF-BB stimulation induced transient ERK1/2 phosphorylation in both D-AdMSCs and C-AdMSCs, with maximal activation of 5–15 min. However, this phosphorylation occurred at a lower rate in D-AdMSCs. SMAD2 phosphorylation was insensitive to PDGF-BB stimulation in D-AdMSCs. The sustained activation of SMAD2 under basal conditions was further evaluated by immunocytochemistry, which revealed that D-AdMSCs showed nuclei more immunoreactive for pSMAD2 compared to C-AdMSCs (D-AdMSCs, 33.45 ± 2.4 a.u.; C-AdMSCs, 17.39 ± 3.8 a.u.; p = 0.012). The basal activation of SMAD2 in D-AdMSCs was accompanied by increased expression of TF (D-AdMSCs, 48.84 ± 5.9 a.u.; C-AdMSCs, 25.75 ± 3.3 a.u.; p = 0.014) (Figures 4J–4L). Altogether, these results suggest that under basal conditions, D-AdMSCs exhibit restricted ERK1/2 signaling even though SMAD2 is activated, which may promote the production of TF. In addition, PDGF-BB stimulation potentiates ERK1/2 signaling in D-AdMSCs, whereas it fails to enhance SMAD2 phosphorylation.
Figure 4.

PDGF Signaling in C-AdMSCs and D-AdMSCs
(A) PDGF-BB levels detected in the serum of healthy (C-serum) and diabetic (D-serum) donors by ELISA, showing an increased concentration of PDGF-BB in D-serum. (B) Flow cytometry analysis determining the percentage of AdMSCs expressing PDGFRβ. (C) Quantification of PDGFRβ fluorescence intensity did not reveal significant differences between D-AdMSCs and C-AdMSCs. (D) Representative western blot for PDGFRβ protein levels in AdMSCs. Glyceraldehyde-3-phosphate dehydrogenase (GAPDH) was used as an internal control. (E) Densitometry analysis of western blots for PDGFRβ levels. (F) Densitometry analysis of western blots for phosphorylated PDGFRβ levels following PDGF stimulation. (G) Densitometry analysis of western blots for phosphorylated ERK1/2 levels following PDGF stimulation. (H) Densitometry analysis of western blots for phosphorylated SMAD2 levels following PDGF stimulation. (I) Representative western blot showing the expression levels of total and phosphorylated PDGFRβ, ERK1/2 and SMAD2/3 in AdMSCs. GAPDH was used as an internal control. (J) Immunocytochemistry staining for pSMAD2 (red) and TF (green) in AdMSCs. Cell nuclei were stained with Hoechst dye (blue). (K) Quantification of pSMAD2 fluorescence intensity in (J), revealing a significant increase in D-AdMSCs. (L) Quantification of TF fluorescence intensity in (J), revealing a significant increase in D-AdMSCs. Scale bar: 100 μm in (J). Data are represented as mean ± SEM. *p < 0.05, **p < 0.001 (two-tailed t test, two-way ANOVA).
PDGF-BB Rescued the Impaired Phenotype of D-AdMSCs
To evaluate whether the impaired phenotype of D-AdMSCs could be rescued, cells were exposed to PDGF-BB (20 ng/mL), and their proliferative and migratory capacities were examined. Immunostaining for Ki67 showed a 1.6-fold increase in D-AdMSCs exposed to PDGF-BB for 5 hr (D-AdMSCs, 43.4% ± 4.6%; D-AdMSCs + PDGF, 68.9% ± 2.6%; p < 0.001), while no significant differences were found in C-AdMSCs (Figures 5A and 5B). PDGF-BB exposure also enhanced migration of D-AdMSCs in scratch assays (D-AdMSCs, 36.9% ± 6.7%; D-AdMSCs + PDGF, 70.9% ± 3.6%; p < 0.001) and transwell assays (D-AdMSCs, 75.7 ± 4 cells; D-AdMSCs + PDGF, 94.5 ± 1.6 cells; p = 0.038), while effects on C-AdMSCs were less robust (Figures 5C–5F).
Figure 5.

Effects of PDGF-BB in Rescuing AdMSCs from the Diabetic Phenotype
(A) Representative immunofluorescence images of proliferating cells using Ki67 (green) 5 hr after PDGF-BB stimulation. Cell nuclei were stained with Hoechst dye (blue). (B) Bar graph depicting the percentage of Ki67+ cells after PDGF-BB stimulation. (C) Representative phase contrast images of the scratch assay over time, with or without enrichment of PDGF-BB. (D) Bar graph depicting the percentage of reduced scratch area after 48 hr. PDGF-BB-enhanced cell migration in D-AdMSCs. (E) Bar graph depicting the number of migrated cells through a transwell membrane after 48 hr in media enriched or not with PDGF-BB. (F) Representative phase contrast images of the transwell assay in (D), stained with cresyl violet. (G) Flow cytometry analysis determining the percentage of AdMSCs expressing the pro-coagulant marker TF after PDGF-BB stimulation. Note the reduced expression of TF in D-AdMSC stimulated with PDGF-BB. (H) Representative images of the fibrin gel assay stained with H&E after 24 hr in culture. Note the clearing zone surrounding cells resulting from the AdMSC-mediated lysis of the fibrin clot. (I) Bar graphs depicting the levels of D-dimers in the media resulting from fibrin degradation over time (data were normalized relative to the 24 hr time point). Note the significant decrease in the fibrin degradation ability of D-AdMSCs and the subsequent rescue by PDGF. Scale bars: 100 μm in (A), 250 μm in (C), and 50 μm in (F and H). Data are represented as mean ± SEM. In (B), (D), and (E), ###p < 0.001 compared to C-AdMSCs, ***p < 0.001 compared to D-AdMSCs, #p < 0.05 compared to C-AdMSCs, and *p < 0.05 compared to D-AdMSCs (two-tailed t test, two-way ANOVA).
We also evaluated the TF levels in AdMSCs in response to PDGF-BB exposure. D-AdMSCs showed a slight decrease in TF expression following PDGF-BB stimulation, while C-AdMSCs showed a 19% increase in TF expression (Figure 5G). Furthermore, the fibrinolytic capacity of AdMSCs was evaluated by fibrin gel assay. This assay mimics the ex vivo fibrin degradation by cells embedded in fibrin clots. The ability of AdMSCs to degrade fibrin clots was visualized as a steady clearing zone surrounding cells 24 hr after seeding. D-AdMSCs appeared to show reduced fibrinolytic abilities compared to C-AdMSCs. The steady clearing zone was increased in cells exposed to PDGF (Figure 5H). To validate these observations, AdMSC-mediated lysis of the fibrin clot was measured by determining the levels of fibrin degradation products (i.e., D-dimers) present in the media (Figure 5I). D-AdMSCs showed no differences in fibrin degradation over time (D-AdMSCs 24 hr, 1 ± 0 a.u.; D-AdMSCs 72 hr, 1.17 ± 0.07 a.u.; p = 0.082), while C-AdMSCs displayed a time-dependent increase in the levels of fibrin degradation products (C-AdMSCs 24 hr, 1 ± 0 a.u.; C-AdMSCs 72 hr, 2.4 ± 0.66 a.u.; p = 0.021). Consistently, PDGF-BB treatment rescued fibrinolytic activity in D-AdMSCs (D-AdMSCs 72 hr, 1.17 ± 0.07 a.u.; D-AdMSCs + PDGF 72 hr, 2.9 ± 0.26 a.u.; p = 0.003).
Biodistribution of Transplanted D-AdMSCs Exhibited a Rescued Homing Ability after PDGF-BB Stimulation
Given that efficient homing is crucial for the success of cell therapy, we studied the ability of AdMSCs to migrate in response to inflammatory lesions, using a mouse model of cutaneous wounds. XenoLight DiR (DiIC18(7) (1,1'-dioctadecyl-3,3,3',3'-tetramethylindotricarbocyanine iodide))-labeled AdMSCs were administered via tail vein into severe combined immunodeficiency (SCID) mice the day after wounding, and cell biodistribution was examined over time (Figure 6A). Non-wounded mice were also injected with the same dose of cells and used as control. Five hours after transplantation, fluorescence was restricted to the lungs and liver. However, on day 1 post-wounding, we observed homing of transplanted cells into the inflammatory lesion, which reached a peak at day 4. Fluorescence tended to slowly decrease after this time point (Figure 6B). Repeated cell infusions would be required for a sustained therapeutic effect. By analyzing the fluorescent signal in the lesion at day 4, we found that D-AdMSCs showed an impaired ability to migrate within the wound compared to C-AdMSCs (D-AdMSCs, 1.28 ± 0.03 a.u.; C-AdMSCs, 1.73 ± 0.11 a.u.; p = 0.048). This defect of in vivo migration was significantly rescued by PDGF-BB stimulation (D-AdMSCs, 1.28 ± 0.03 a.u.; D-AdMSCs + PDGF, 1.74 ± 0.03 a.u.; p = 0.007), maintaining this tendency over an 8-day period (Figures 6B–6D). The presence of AdMSCs in the lesion was further demonstrated by histological analysis of the wound tissue (Figure 6D). First, H&E staining revealed a thickened epidermis composed of multiple layers of keratinocytes due to increased post-wounding proliferation, as shown by Ki67 immunostaining. Subsequent immunohistochemistry against human nuclei confirmed that AdMSCs were incorporated into the lesion. At autopsy, we did not observe tumor mass in those mice receiving AdMSCs, either pre-treated with PDGF or not. Altogether, these results indicate that D-AdMSCs showed a reduced ability to migrate and home to sites of injury after intravenous transplantation in mice. This defect in homing can be rescued by PDGF-BB stimulation.
Figure 6.

Biodistribution of Transplanted AdMSCs in an In Vivo Cutaneous Wound Model
(A) XenoLight DiR-labeled AdMSCs were transplanted via tail veins into SCID mice the day after cutaneous incision. Images show bioluminescence activity in representative animals before and after (5 hr, days 4 and 8) cell transplantation. Black boxes delimit cutaneous incisions area. (B) Fluorescence in the wound area was quantified over an 8-day period. Values were normalized to the fluorescence in the wound area at day 0. The maximal fluorescence intensity was detected at day 4. (C) Quantification of the relative fluorescence in the wound area at day 4. Values were normalized to the fluorescence in the wound area at day 0. D-AdMSCs showed reduced invasion into the wound area, and this defect was rescued by PDGF stimulation. (D) Detailed analysis of the bioluminescence activity in the wound area at day 4. H&E staining of the wound tissue revealed a thickened epidermis (e, dark layer) over the dermis (d, light layer), as a result of post-wounding events. Immunohistochemistry against Ki67 (green) revealed proliferating cells (arrows) at the wound site. Immunohistochemistry against human nuclei (hNuclei; red) revealed the presence of AdMSCs (arrows) at the wound site. Cell nuclei were stained with Hoechst dye (blue). Scale bars: 100 μm (H&E) and 20 μm (immunohistochemistry [IHC]) in (D). Data are represented as mean ± SEM. #p < 0.05 compared to C-AdMSCs, **p < 0.01 compared to D-AdMSCs (two-tailed t test).
The Defective Phenotype of AdMSCs Differs across Multiple T2DM Patients Successfully Treated with Autologous Cell Therapy for CLI
To determine whether the defective phenotype found in D-AdMSCs was associated with the adverse event previously described,13 we evaluated AdMSCs derived from T2DM patients with CLI that did not undergo adverse reaction after cell infusion (i.e., therapeutically effective AdMSCs [DEf-AdMSCs]). We found that migration was significantly decreased in AdMSCs from these patients compared to control cells. Consistently, PDGF-BB treatment rescued the defect on migration. However, we found a heterogeneity between patients when evaluating DEf-AdMSC proliferation, mRNA expression levels of factors involved in coagulation and fibrinolysis (i.e., Tf, Tfpi, Mmp2, Timp1, and Timp2), and protein levels of TF, PAI-1, and tPA (Figure S4). These data suggest that the defective phenotype is emphasized in therapeutically non-effective AdMSCs.
Discussion
MSC-based therapy has shown promising, but not yet conclusive, results for the treatment of diabetes and its complications. Several studies indicate that MSCs derived from diabetic patients exhibit an defective phenotype that may compromise their success in cell therapy.13, 17, 32, 33, 34, 35, 36, 37, 38, 39, 40, 41, 42, 43, 44 In this study, we confirmed the defective phenotype of AdMSCs derived from diabetic patients with CLI, which was associated with the adverse event previously described.13 In addition, we propose a treatment with PDGF-BB to rescue the healthy phenotype.
D-AdMSCs Exhibit a Defective Phenotype that May Compromise Their Effectiveness in Cell Therapy
The Mesenchymal and Tissue Stem Cell Committee of the International Society for Cellular Therapy proposed the minimal criteria that define human MSCs.45 Even though the D-AdMSCs used in our study met all these criteria, we found a modified differentiation tendency. Studies have reported that MSCs derived from diabetic rats exhibited reduced osteogenic potential and enhanced adipogenesis.17, 46 These findings are consistent with our observations using human AdMSCs. Modifications in the differentiation tendency could stem from individual heterogeneities, including obesity and skeletal fragility, which have been related to increased adipogenesis47, 48, 49 and poor bone strength,50 respectively. Furthermore, proliferation, migration, and homing to sites of inflammation were attenuated in AdMSCs derived from T2DM patients with CLI, which may compromise a successful engraftment after cell therapy for CLI. These alterations are in line with previous studies showing that MSCs derived from the bone marrow of mice homozygous for the diabetes spontaneous mutation (Leprdb) exhibit reduced proliferation in vitro, as well as poor engraftment to the site of injury in an excisional splint wound model.51 Thus, data support that MSCs derived from diabetic individuals present impaired therapeutic capacity. Finally, we found that the balance between coagulation and fibrinolysis was shifted toward a prothrombotic state in D-AdMSCs. These findings agree with our previous study reporting that D-AdMSCs cultured in the presence of blood sera release higher levels of PAI-1, reduced levels of tPA, and lower D-dimer formation compared with C-AdMSCs.13 Now, we have included the evaluation of the procoagulant TF, whose expression was found to be increased in D-AdMSCs. TF is a transmembrane receptor that binds to clotting factor VIIa (FVIIa), forming the TF-FVIIa complex responsible for initiating the coagulation cascade.52 The subcellular localization of TF (cell surface pool and Golgi pool) is critical for determining its activity. It is known that FVIIa binding to TF mobilizes TF from the Golgi, increasing TF expression at the cell surface, which could be induced as response to injury.53, 54 Consistent with this, we found that TF has a perinuclear location in C-AdMSCs but was localized at the plasma membrane in D-AdMSCs, supporting the prothrombotic profile. However, further functional studies (e.g., blood clotting assay) are necessary to corroborate a prothrombotic state in D-AdMSCs. The altered properties described in this and other studies question the suitability of MSCs from diabetic donors for autologous cell therapy.
PDGF Signaling Attenuation May Account for the Defective Phenotype of D-AdMSCs
PDGF signaling is known to modulate essential MSC processes, such as differentiation, migration, and proliferation,27, 28, 29, 30, 31 as well as coagulation and fibrinolysis systems.18, 19, 20, 21, 22, 23, 24 Here, we demonstrated that PDGF signaling was attenuated in D-AdMSCs. In particular, we found that PDGFRβ phosphorylation was less sensitive to PDGF-BB stimulation in D-AdMSCs than in control cells. This modulation may be due to a defect on PDGFRβ or to the existence of a competition between PDGF-BB and other proteins for binding to PDGFRβ. The decreased PDGFRβ phosphorylation in D-AdMSCs led to impaired ERK signaling that was associated with a reduction in their ability to proliferate and migrate, as shown in previous studies.29, 55, 56 However, SMAD2 displayed a persistent activation under basal conditions that occurs in an ERK-independent manner. Upon phosphorylation, SMAD proteins form a complex that translocates into the nucleus to regulate gene transcription.57 According to previous research, SMAD has been involved in the modulation of the procoagulant TF.22 Thus, we suggest that the sustained activation of SMAD2 in D-AdMSCs contributes to the observed prothrombotic phenotype. Previous reports have demonstrated that transforming growth factor β (TGF-β) plays a critical role in the initiation of SMAD signaling.58 TGF-β is involved in the control of metabolic homeostasis during diabetogenesis.59, 60 Hence, TGF-β signaling appears to be a good candidate for inducing SMAD2 translocation to the nucleus in D-AdMSCs and the subsequent increase in TF expression in an ERK-independent manner. Further studies are necessary to clarify the mechanism involved in the production of TF in diabetic patients.
PDGF-BB Treatment Reverts the Pathological Phenotype of D-AdMSCs and May Maximize Their Effectiveness in Cell Therapy
Our study demonstrated that the modulation of PDGF signaling by PDGF-BB exposure improves proliferation, migration, and homing to sites of inflammation, which may be associated with the activation of ERK1/2. In particular, homing is of special relevance in cell therapy for CLI, because infused cells have to be able to respond to local inflammation and migrate toward the lesion. Increasing the homing of D-AdMSCs will favor its success in autologous cell therapy. In addition, fibrin gel assay provided evidence that PDGF-BB treatment rescued the defect in fibrinolysis, which helped to dissolve fibrin clots from the vascular system, thus preventing vessel occlusion and favoring homing of infused cells. Previous studies have suggested that PDGF-BB is involved in the hyalocyte-mediated degradation of fibrin clots in vitreous body hemorrhage.23, 24 Modification on the extracellular matrix remodeling processes upon PDGF stimulation may lead to the rescued fibrinolytic phenotype.61, 62 However, PDGF-BB treatment does not modify the expression of TF in D-AdMSCs, which may be due to the persistent activation of SMAD2 found in these cells. In contrast, PDGF-BB induced the expression of TF in C-AdMSCs, which correlates with the activation of the ERK/SMAD axis. These results support the role of SMAD in the regulation of TF. However, the precise mechanisms for control of the fibrinolysis and/or coagulation balance remain to be elucidated.
In conclusion, this study provides evidence that D-AdMSCs display a defective phenotype that can be rescued by a pre-treatment with PDGF-BB. In particular, we demonstrated an improvement in proliferation, migration, and homing, as well as an enhanced fibrinolytic capacity, after PDGF-BB exposure. In addition, we identify the ERK/SMAD pathway as part of the mechanism by which PDGF treatment rescues the defective phenotype of D-AdMSCs (Figure 7). Although further studies are required, our results suggest that the pre-treatment with PDGF-BB will help to improve the therapeutic effect of AdMSCs derived from T2DM patients in autologous cell therapy.
Figure 7.

Schematic Representation of PDGFR, ERK, and SMAD Signaling in AdMSCs
In AdMSCs from healthy donors, PDGF binding to its receptor activates ERK signaling, which in turn induces the translocation of SMAD to the nucleus and its phosphorylation. The activation of ERK and SMAD promotes the transcription of their target genes, including Tf. In AdMSCs derived from diabetic patients, PDGF signaling is downregulated, which results in partial inhibition of ERK1/2. However, SMAD is upregulated in AdMSCs derived from diabetic patients; consequently, TF expression is enhanced. This suggests that other pathways are involved in the sustained activation of SMAD observed in AdMSCs derived from diabetic patients.
Materials and Methods
Patient Samples
AdMSCs and sera were obtained from T2DM patients with CLI enrolled in a clinical trial (ClinicalTrials.gov: NCT01257776). The use of human samples was formally approved by local and regional medical research ethics committees and included the informed consent of patients. See Table S1 for sample information.
AdMSC Culture and Differentiation
AdMSCs were cultured in growth media composed of DMEM (Life Technologies, Carlsbad, CA) supplemented with 10% fetal bovine serum (FBS) and 1% penicillin-streptomycin and were incubated at 37°C in a 20% O2 and 5% CO2 humidified atmosphere. Media were changed every 2–3 days. Percentages of cell viability and death were determined for each cell passage by trypan blue exclusion test (Sigma-Aldrich). Differentiation of AdMSCs into adipocytes was performed using StemMACs AdipoDiff media (Miltenyi Biotec, Cologne, Germany). After 21 days, the presence of lipid droplets was determined by staining the cells with oil red O (Sigma-Aldrich, St. Louis, MO) (n = 4 replicates). Similarly, differentiation of AdMSCs into osteoblasts was performed by StemMACs OsteoDiff (Miltenyi Biotec). After 10 days, the presence of osteoblasts was determined by measuring the alkaline phosphatase activity using the SIGMAFAST BCIP/NBT (5-bromo-4-chloro-3-indolyl phosphate/nitro blue tetrazolium; Sigma-Aldrich) (n = 4 replicates). Quantification of oil red O and alkaline phosphatase staining was determined using ImageJ software (National Institute of Mental Health, Bethesda, MD).
PDGF-BB Stimulation
AdMSCs were grown in growth media until subconfluence and then starved for 24 hr in serum-free medium before stimulation with PDGF-BB (PeproTech, NJ). Cells were incubated with 20 ng/mL of PDGF-BB for the indicated time periods, according to published studies.29, 63
Preparation of Conditioned Media Derived from AdMSCs
AdMSCs were seeded into T75 flasks with growth media and allowed to grow until subconfluence. The media was then changed to serum-free media (5 mL total volume). After 24 hr, conditioned media derived from AdMSCs was collected, centrifuged, and stored at −80°C until use.
Colony-Forming Unit Assay
AdMSCs were plated onto 100-mm dishes at a low density (100 cells per dish) and cultured for 14 days in growth media (n = 3 replicates). Then, cells were fixed with 4% paraformaldehyde and stained with 0.5% cresyl violet (Sigma-Aldrich) to analyze the number and size of the colonies using ImageTool software (Evans Technology, Roswell, GA).
Scratch Assay
AdMSCs were seeded into 12-well plates with growth media until confluence (n = 6 replicates). A scratch across the entire diameter of the well was performed using a 200-μL pipette tip, and the media were immediately changed. A set area from the scratch was imaged at different time points (0, 6, 12, 24, and 48 hr after scratching) using an Olympus IX71 microscope. Then, the cell-free zone in the scratch was measured, and results were expressed as the reduction index of the scratched area.
Boyden Chamber-Based Cell Migration Assay
Migration of AdMSCs was assessed using Boyden’s chamber method with hanging cell culture inserts (24 wells, 8-μm pore; Millipore). The lower chamber was filled with growth media, and then 15,000 cells were plated in the top chamber using serum-free medium to promote cell migration through the pores of the membrane (n = 3–5 replicates). For stimulation assays, PDGF-BB was added to the upper and lower chambers. The cells were incubated at 37°C in a 20% O2 and 5% CO2 humidified atmosphere and allowed to migrate for 48 hr. After incubation, non-migrated cells on the upper side of the inserts were removed by using a cotton swab. Migrated cells on the lower side of the inserts were fixed with 4% paraformaldehyde and stained with 0.5% cresyl violet. Then, 9 random fields per membrane were imaged and counted for comparison using an Olympus IX71 microscope.
alamarBlue Assay
AdMSCs were seeded onto 96-well plates (1,500 cells per well) in growth media and allowed to attach for 24 hr. Then, alamarBlue reagent (Life Technologies) was added to each well at a concentration of 10%, following the manufacturer’s recommendations. The alamarBlue reduction was measured over time at 570- and 600-nm absorbance using a Varioskan Flash microplate reader (Thermo Electron, Vantaa, Finland). Wells containing culture medium without cells were included as negative controls.
Flow Cytometry
AdMSCs were harvested and subjected to flow cytometry for phenotypic study using the molecular markers CD13, CD29, CD31, CD34, CD45, CD73, CD90, CD105, and HLA II. A BrdU Flow kit was used to determine cell proliferation (BD Biosciences, San Jose, CA). An annexin V/propidium iodide apoptosis detection kit was used to evaluate cell death (Immunostep, Salamanca, Spain). TF and PDGFRβ expression was also assessed by flow cytometry. The appropriate isotypes were included in each assay (see Table S2 for antibody information). Data were analyzed using an ACSCalibur Flow Cytometer (BD FACSCalibur cytometry system).
Immunocytochemistry
Subconfluent cells grown on glass coverslips were fixed with 4% paraformaldehyde (n = 4–15 replicates). Cells were incubated in 10% normal goat serum for 1 hr at room temperature, followed by overnight incubation with primary antibodies at 4°C. Then, cells were washed and incubated with the appropriate secondary antibodies conjugated with fluorophores (see Table S2 for antibodies information). Hoechst 3342 nucleic acid stain (Sigma-Aldrich) was used to detect cell nuclei. Coverslips were then mounted with fluorescent mounting medium (Dako, Glostrup, Denmark) on a glass slide. Fluorescence labeling was examined using an Olympus IX71 microscope equipped with DPController and DPManager software (Center Valley, PA).
Western Blot
Harvested cells were lysed for protein extraction using radioimmunoprecipitation assay (RIPA) buffer (Sigma-Aldrich), supplemented with a protease and phosphatase inhibitor cocktail. Proteins from whole-cell lysates (30 μg) were resolved using 10% Tris-glycine gel electrophoresis and transferred onto a nitrocellulose membrane (Whatman, Dassel, Germany). Membranes were then blocked with 5% non-fat milk and probed with primary antibodies (see Table S2 for antibody information). Detection was performed with the appropriate horseradish peroxidase-conjugated secondary antibodies using an enhanced chemiluminescence reagent (GE Healthcare Life Sciences). Densitometric analyses for the blots were performed using ImageJ software (v.1.4r; NIH, Bethesda, MD). Data were collected from three independent experiments.
Measurement of Human tPA and PAI-1 Secretion
Levels of tPA and PAI-1 secreted in the media were measured using pre-coated ELISA plates (eBioscience, San Diego, CA) according to the manufacturer’s instructions and as previously described.13, 64 The tPA and PAI-1 concentrations were determined using the SkanIt Software for Varioskan Flash (v.2.4.1) (n = 4 replicates).
Measurement of Human PDGF
Levels of PDGF-AA and PDGF-BB was measured in conditioned media and serum samples using the Quantikine ELISA kit (R&D Systems, Minneapolis, MN) according to the manufacturer’s instructions. Absorbance was determined using the SkanIt software for Varioskan Flash (v.2.4.1) (n = 2 replicates).
Fibrin Gel Assay and D-dimer Detection
Fibrin gels were prepared as previously described.11 Following polymerization, 1 mL growth media with or without PDGF-BB was added to the clotted fibrin gels. Medium was collected 24 and 73 hr later for D-dimer detection using the D-Dimer Human SimpleStep ELISA kit (Abcam, Cambridge, UK) according to the manufacturer according to the manufacturer’s instructions. Gels were fixed in 4% paraformaldehyde and processed for H&E staining (n = 3 replicates).
RNA Extraction and qRT-PCR
RNA was isolated from AdMSCs using the easy-blue total RNA extraction kit (iNtRON Biotechnology, Seongnam, Korea). Total RNA (1 μg) was used to synthesize cDNA with Moloney murine leukemia virus (M-MLV) reverse transcriptase (Promega, Madison, WI). A 96-well custom array panel (Roche Diagnostics, Basel, Switzerland) was designed to quantify the expression of genes involved in coagulation and fibrinolysis by qRT-PCR using a LightCycler 480 instrument (Roche). We used 35 ng of the synthesized cDNA and LightCycler 480 Probes Master (Roche) with the following thermocycling conditions: 10 min at 95°C followed by 45 thermal cycles of 95°C for 10 s, 60°C for 30 s, and 72°C for 1 s. The target genes were amplified and analyzed with LightCycler 480 Software 1.4.9 (Roche), using triplicate samples. The relative gene expression was normalized using peptidylprolyl isomerase A (Ppia) and ribosomal protein large P0 (Rplp0) as housekeeping genes (see Table S3 for primers information). Data were collected from three independent experiments.
Animals
Two-month-old female SCID mice (CB17/lcr-Prkdcscid/lcrlcoCrl) were purchased from Charles River Laboratory (Barcelona, Spain). All animals (n = 15) were housed under a 12-hr light/dark cycle with food and water available ad libitum. Animals were randomly distributed into five groups: non-wounded mice injected with AdMSCs (n = 3), wounded mice injected with C-AdMSCs (n = 3), wounded mice injected with C-AdMSCs + PDGF (n = 3), wounded mice injected with D-AdMSCs (n = 3), and wounded mice injected with D-AdMSCs + PDGF (n = 3). All animal procedures were reviewed and approved by the Animal Experimentation and Ethics Committee of CABIMER and conform to all relevant regulatory standards.
Preparation of Labeled AdMSCs
C-AdMSCs and D-AdMSCs were grown until subconfluence and either exposed or not to PDGF-BB for 24 hr. Then, cells were trypsinized and incubated with 320 μg/mL XenoLight DiR fluorescent dye (PerkinElmer, Boston, MA) for 30 min at 37°C according to the manufacturer’s instructions. Before transplantation, free dye was removed by washing labeled cells in PBS.
Cutaneous Wound Model and AdMSC Transplantation
A sterile incision wound of 10 mm in length was made on the right side of the abdomen of shaved, anesthetized mice. The incision was immediately sutured. The next day, XenoLight DiR-labeled AdMSCs (2.5 × 10⁵ cells in 200 μL of PBS) were transplanted via lateral tail vein into SCID mice. Animals were subsequently monitored daily using the IVIS Imaging System 200 Series (Caliper Life Science, Hopkinton, MA) to examine in vivo cell distribution over 15 days. Fluorescence intensity in the wound area was analyzed using Living Image 3.2 software (Caliper Life Sciences). Non-wounded mice were also injected with the same dose of cells and used as control. Wound tissues were collected at day 4 for histological analysis. After fixation with 4% paraformaldehyde, tissue was paraffin embedded, and 7-μm-thick sections were obtained for H&E staining, as well as for immunohistochemistry.
Statistical Analysis
Data were expressed as mean ± SEM and analyzed using SigmaPlot 12.5 software (Jandel Scientific, San Rafael, CA). Student’s t test was performed to compare two experimental groups, while ANOVA was performed to compare multiple groups. For samples that were not normally distributed, the non-parametric Mann-Whitney U test was used. The differences were considered significant at a p value of less than 0.05.
Author Contributions
V.C.-G., A.H., and B.S. conceived and designed the experiments; V.C.-G., J.L.-B., N.E., and Y.A. performed the experiments; V.C.-G., J.L.-B., N.E., Y.A., A.d.l.C., R.R.-S., F.M., A.H., and B.S. analyzed the data; V.C.-G., A.H., and B.S. wrote the manuscript. All authors were involved in manuscript revision and granted final approval of the submitted version.
Conflicts of Interest
The authors declare no competing interests.
Acknowledgments
We thank Nuria Mellado-Damas, Olimpia Perez-Morato, and Julien Caballero for their valuable technical help. This work was funded by grants from the Spanish Ministry of Economy, Industry and Competitiveness and by the Institute of Health Carlos III (RD16/0011/0034, PI16/00259, and PI17/02104), the nonprofit Fundación Progreso y Salud of the Andalusian Regional Ministry of Health (PI-0109-2014 and PI-0272-2017) and was co-financed by FEDER (European Regional Development Fund) and ACTION Cost (European Cooperation in Science and Technology; BM1305). V.C.-G. was the recipient of a Sara Borrell postdoctoral contract from the Ministry of Economy, Industry and Competitiveness and the Institute of Health Carlos III (CD16/00118). CIBERDEM is an initiative of the Institute of Health Carlos III.
Footnotes
Supplemental Information includes four figures and three tables and can be found with this article online at https://doi.org/10.1016/j.ymthe.2018.08.011.
Supplemental Information
References
- 1.Apelqvist J., Bakker K., van Houtum W.H., Nabuurs-Franssen M.H., Schaper N.C., International Working Group on the Diabetic Foot International consensus and practical guidelines on the management and the prevention of the diabetic foot. Diabetes Metab. Res. Rev. 2000;16(Suppl 1):S84–S92. doi: 10.1002/1520-7560(200009/10)16:1+<::aid-dmrr113>3.0.co;2-s. [DOI] [PubMed] [Google Scholar]
- 2.Ruiz-Salmeron R., de la Cuesta-Diaz A., Constantino-Bermejo M., Pérez-Camacho I., Marcos-Sánchez F., Hmadcha A., Soria B. Angiographic demonstration of neoangiogenesis after intra-arterial infusion of autologous bone marrow mononuclear cells in diabetic patients with critical limb ischemia. Cell Transplant. 2011;20:1629–1639. doi: 10.3727/096368910X0177. [DOI] [PubMed] [Google Scholar]
- 3.Kim E.K., Li G., Lee T.J., Hong J.P. The effect of human adipose-derived stem cells on healing of ischemic wounds in a diabetic nude mouse model. Plast. Reconstr. Surg. 2011;128:387–394. doi: 10.1097/PRS.0b013e31821e6de2. [DOI] [PubMed] [Google Scholar]
- 4.Maharlooei M.K., Bagheri M., Solhjou Z., Jahromi B.M., Akrami M., Rohani L., Monabati A., Noorafshan A., Omrani G.R. Adipose tissue derived mesenchymal stem cell (AD-MSC) promotes skin wound healing in diabetic rats. Diabetes Res. Clin. Pract. 2011;93:228–234. doi: 10.1016/j.diabres.2011.04.018. [DOI] [PubMed] [Google Scholar]
- 5.Soria B., Montanya E., Martín F., Hmadcha A. A role for the host in the roadmap to diabetes stem cell therapy. Diabetes. 2016;65:1155–1157. doi: 10.2337/dbi16-0003. [DOI] [PubMed] [Google Scholar]
- 6.Rigato M., Monami M., Fadini G.P. Autologous cell therapy for peripheral arterial disease: systematic review and meta-analysis of randomized, nonrandomized, and noncontrolled studies. Circ. Res. 2017;120:1326–1340. doi: 10.1161/CIRCRESAHA.116.309045. [DOI] [PubMed] [Google Scholar]
- 7.Liang L., Li Z., Ma T., Han Z., Du W., Geng J., Jia H., Zhao M., Wang J., Zhang B. Transplantation of human placenta-derived mesenchymal stem cells alleviates critical limb ischemia in diabetic nude rats. Cell Transplant. 2017;26:45–61. doi: 10.3727/096368916X692726. [DOI] [PMC free article] [PubMed] [Google Scholar]
- 8.Hashi C.K., Zhu Y., Yang G.Y., Young W.L., Hsiao B.S., Wang K., Chu B., Li S. Antithrombogenic property of bone marrow mesenchymal stem cells in nanofibrous vascular grafts. Proc. Natl. Acad. Sci. USA. 2007;104:11915–11920. doi: 10.1073/pnas.0704581104. [DOI] [PMC free article] [PubMed] [Google Scholar]
- 9.Nakagami H., Maeda K., Morishita R., Iguchi S., Nishikawa T., Takami Y., Kikuchi Y., Saito Y., Tamai K., Ogihara T., Kaneda Y. Novel autologous cell therapy in ischemic limb disease through growth factor secretion by cultured adipose tissue-derived stromal cells. Arterioscler. Thromb. Vasc. Biol. 2005;25:2542–2547. doi: 10.1161/01.ATV.0000190701.92007.6d. [DOI] [PubMed] [Google Scholar]
- 10.Prockop D.J., Oh J.Y. Mesenchymal stem/stromal cells (MSCs): role as guardians of inflammation. Mol. Ther. 2012;20:14–20. doi: 10.1038/mt.2011.211. [DOI] [PMC free article] [PubMed] [Google Scholar]
- 11.Neuss S., Schneider R.K., Tietze L., Knüchel R., Jahnen-Dechent W. Secretion of fibrinolytic enzymes facilitates human mesenchymal stem cell invasion into fibrin clots. Cells Tissues Organs (Print) 2010;191:36–46. doi: 10.1159/000215579. [DOI] [PubMed] [Google Scholar]
- 12.Agis H., Kandler B., Fischer M.B., Watzek G., Gruber R. Activated platelets increase fibrinolysis of mesenchymal progenitor cells. J. Orthop. Res. 2009;27:972–980. doi: 10.1002/jor.20819. [DOI] [PubMed] [Google Scholar]
- 13.Acosta L., Hmadcha A., Escacena N., Pérez-Camacho I., de la Cuesta A., Ruiz-Salmeron R., Gauthier B.R., Soria B. Adipose mesenchymal stromal cells isolated from type 2 diabetic patients display reduced fibrinolytic activity. Diabetes. 2013;62:4266–4269. doi: 10.2337/db13-0896. [DOI] [PMC free article] [PubMed] [Google Scholar]
- 14.Davies L.C., Alm J.J., Heldring N., Moll G., Gavin C., Batsis I., Qian H., Sigvardsson M., Nilsson B., Kyllonen L.E. Type 1 diabetes mellitus donor mesenchymal stromal cells exhibit comparable potency to healthy controls in vitro. Stem Cells Transl. Med. 2016;5:1485–1495. doi: 10.5966/sctm.2015-0272. [DOI] [PMC free article] [PubMed] [Google Scholar]
- 15.Escacena N., Quesada-Hernández E., Capilla-Gonzalez V., Soria B., Hmadcha A. Bottlenecks in the efficient use of advanced therapy medicinal products based on mesenchymal stromal cells. Stem Cells Int. 2015;2015:895714. doi: 10.1155/2015/895714. [DOI] [PMC free article] [PubMed] [Google Scholar]
- 16.Boland L., Burand A.J., Brown A.J., Boyt D., Lira V.A., Ankrum J.A. IFN-γ and TNF-α pre-licensing protects mesenchymal stromal cells from the pro-inflammatory effects of palmitate. Mol. Ther. 2018;26:860–873. doi: 10.1016/j.ymthe.2017.12.013. [DOI] [PMC free article] [PubMed] [Google Scholar]
- 17.Kim H., Han J.W., Lee J.Y., Choi Y.J., Sohn Y.D., Song M., Yoon Y.S. Diabetic mesenchymal stem cells are ineffective for improving limb ischemia due to their impaired angiogenic capability. Cell Transplant. 2015;24:1571–1584. doi: 10.3727/096368914X682792. [DOI] [PMC free article] [PubMed] [Google Scholar]
- 18.Ernofsson M., Siegbahn A. Platelet-derived growth factor-BB and monocyte chemotactic protein-1 induce human peripheral blood monocytes to express tissue factor. Thromb. Res. 1996;83:307–320. doi: 10.1016/0049-3848(96)00139-9. [DOI] [PubMed] [Google Scholar]
- 19.Kamimura M., Bea F., Akizawa T., Katus H.A., Kreuzer J., Viedt C. Platelet-derived growth factor induces tissue factor expression in vascular smooth muscle cells via activation of Egr-1. Hypertension. 2004;44:944–951. doi: 10.1161/01.HYP.0000146908.75091.99. [DOI] [PubMed] [Google Scholar]
- 20.Schecter A.D., Giesen P.L., Taby O., Rosenfield C.L., Rossikhina M., Fyfe B.S., Kohtz D.S., Fallon J.T., Nemerson Y., Taubman M.B. Tissue factor expression in human arterial smooth muscle cells. TF is present in three cellular pools after growth factor stimulation. J. Clin. Invest. 1997;100:2276–2285. doi: 10.1172/JCI119765. [DOI] [PMC free article] [PubMed] [Google Scholar]
- 21.Gebhard C., Akhmedov A., Mocharla P., Angstenberger J., Sahbai S., Camici G.G., Lüscher T.F., Tanner F.C. PDGF-CC induces tissue factor expression: role of PDGF receptor alpha/beta. Basic Res. Cardiol. 2010;105:349–356. doi: 10.1007/s00395-009-0060-0. [DOI] [PubMed] [Google Scholar]
- 22.Arderiu G., Espinosa S., Peña E., Aledo R., Badimon L. PAR2-SMAD3 in microvascular endothelial cells is indispensable for vascular stability via tissue factor signaling. J. Mol. Cell Biol. 2015;8:255–270. doi: 10.1093/jmcb/mjv065. [DOI] [PubMed] [Google Scholar]
- 23.Noda Y., Hata Y., Hisatomi T., Nakamura Y., Hirayama K., Miura M., Nakao S., Fujisawa K., Sakamoto T., Ishibashi T. Functional properties of hyalocytes under PDGF-rich conditions. Invest. Ophthalmol. Vis. Sci. 2004;45:2107–2114. doi: 10.1167/iovs.03-1092. [DOI] [PubMed] [Google Scholar]
- 24.Noda Y., Hata Y., Nakamura Y., Hisatomi T., Sassa Y., Nakao S. PDGF-BB induces proliferation, migration and fibrinolytic activity of cultured bovine hyalocytes. Invest. Ophthalmol. Vis. Sci. 2003;44 432–432. [Google Scholar]
- 25.Rehman J., Traktuev D., Li J., Merfeld-Clauss S., Temm-Grove C.J., Bovenkerk J.E., Pell C.L., Johnstone B.H., Considine R.V., March K.L. Secretion of angiogenic and antiapoptotic factors by human adipose stromal cells. Circulation. 2004;109:1292–1298. doi: 10.1161/01.CIR.0000121425.42966.F1. [DOI] [PubMed] [Google Scholar]
- 26.Morrissey J.H., Neuenschwander P.F., Huang Q., McCallum C.D., Su B., Johnson A.E. Factor VIIa-tissue factor: functional importance of protein-membrane interactions. Thromb. Haemost. 1997;78:112–116. [PubMed] [Google Scholar]
- 27.Kim W.S., Park H.S., Sung J.H. The pivotal role of PDGF and its receptor isoforms in adipose-derived stem cells. Histol. Histopathol. 2015;30:793–799. doi: 10.14670/HH-11-598. [DOI] [PubMed] [Google Scholar]
- 28.Ryu Y.J., Cho T.J., Lee D.S., Choi J.Y., Cho J. Phenotypic characterization and in vivo localization of human adipose-derived mesenchymal stem cells. Mol. Cells. 2013;35:557–564. doi: 10.1007/s10059-013-0112-z. [DOI] [PMC free article] [PubMed] [Google Scholar]
- 29.Gharibi B., Ghuman M.S., Hughes F.J. Akt- and Erk-mediated regulation of proliferation and differentiation during PDGFRβ-induced MSC self-renewal. J. Cell. Mol. Med. 2012;16:2789–2801. doi: 10.1111/j.1582-4934.2012.01602.x. [DOI] [PMC free article] [PubMed] [Google Scholar]
- 30.Ball S.G., Shuttleworth A., Kielty C.M. Inhibition of platelet-derived growth factor receptor signaling regulates Oct4 and Nanog expression, cell shape, and mesenchymal stem cell potency. Stem Cells. 2012;30:548–560. doi: 10.1002/stem.1015. [DOI] [PMC free article] [PubMed] [Google Scholar]
- 31.Zhang M., Jiang F., Zhang X., Wang S., Jin Y., Zhang W., Jiang X. The effects of platelet-derived growth factor-bb on human dental pulp stem cells mediated dentin-pulp complex regeneration. Stem Cells Transl. Med. 2017;6:2126–2134. doi: 10.1002/sctm.17-0033. [DOI] [PMC free article] [PubMed] [Google Scholar]
- 32.Alzahrani S.H., Ajjan R.A. Coagulation and fibrinolysis in diabetes. Diab. Vasc. Dis. Res. 2010;7:260–273. doi: 10.1177/1479164110383723. [DOI] [PubMed] [Google Scholar]
- 33.Cucuianu M., Coca M. Thrombotic tendency in diabetes mellitus. Revisiting and revising a study initiated 30 years ago. Rom. J. Intern. Med. 2012;50:107–115. [PubMed] [Google Scholar]
- 34.Chudý P., Chudá D., Ivanková J., Sinák I., Talapková R., Staško J., Kubisz P. Therapeutic angiogenesis improves fibrinolytic imbalance in patients with critical limb ischemia. Blood Coagul. Fibrinolysis. 2014;25:156–160. doi: 10.1097/MBC.0000000000000014. [DOI] [PubMed] [Google Scholar]
- 35.Lee A.J., Lowe G.D., Woodward M., Tunstall-Pedoe H. Fibrinogen in relation to personal history of prevalent hypertension, diabetes, stroke, intermittent claudication, coronary heart disease, and family history: the Scottish Heart Health Study. Br. Heart J. 1993;69:338–342. doi: 10.1136/hrt.69.4.338. [DOI] [PMC free article] [PubMed] [Google Scholar]
- 36.Mansfield M.W., Stickland M.H., Grant P.J. PAI-1 concentrations in first-degree relatives of patients with non-insulin-dependent diabetes: metabolic and genetic associations. Thromb. Haemost. 1997;77:357–361. [PubMed] [Google Scholar]
- 37.Tepper O.M., Galiano R.D., Capla J.M., Kalka C., Gagne P.J., Jacobowitz G.R., Levine J.P., Gurtner G.C. Human endothelial progenitor cells from type II diabetics exhibit impaired proliferation, adhesion, and incorporation into vascular structures. Circulation. 2002;106:2781–2786. doi: 10.1161/01.cir.0000039526.42991.93. [DOI] [PubMed] [Google Scholar]
- 38.Kotlinowski J., Dulak J., Józkowicz A. [Type 2 diabetes mellitus impairs endothelial progenitor cells functions] Postepy Biochem. 2013;59:257–266. [PubMed] [Google Scholar]
- 39.Sibal L., Aldibbiat A., Agarwal S.C., Mitchell G., Oates C., Razvi S., Weaver J.U., Shaw J.A., Home P.D. Circulating endothelial progenitor cells, endothelial function, carotid intima-media thickness and circulating markers of endothelial dysfunction in people with type 1 diabetes without macrovascular disease or microalbuminuria. Diabetologia. 2009;52:1464–1473. doi: 10.1007/s00125-009-1401-0. [DOI] [PubMed] [Google Scholar]
- 40.Moon J.H., Chae M.K., Kim K.J., Kim H.M., Cha B.S., Lee H.C., Kim Y.J., Lee B.W. Decreased endothelial progenitor cells and increased serum glycated albumin are independently correlated with plaque-forming carotid artery atherosclerosis in type 2 diabetes patients without documented ischemic disease. Circ. J. 2012;76:2273–2279. doi: 10.1253/circj.cj-11-1499. [DOI] [PubMed] [Google Scholar]
- 41.Desouza C.V. Does drug therapy reverse endothelial progenitor cell dysfunction in diabetes? J. Diabetes Complications. 2013;27:519–525. doi: 10.1016/j.jdiacomp.2013.04.007. [DOI] [PubMed] [Google Scholar]
- 42.Capla J.M., Grogan R.H., Callaghan M.J., Galiano R.D., Tepper O.M., Ceradini D.J., Gurtner G.C. Diabetes impairs endothelial progenitor cell-mediated blood vessel formation in response to hypoxia. Plast. Reconstr. Surg. 2007;119:59–70. doi: 10.1097/01.prs.0000244830.16906.3f. [DOI] [PubMed] [Google Scholar]
- 43.Loomans C.J., de Koning E.J., Staal F.J., Rookmaaker M.B., Verseyden C., de Boer H.C., Verhaar M.C., Braam B., Rabelink T.J., van Zonneveld A.J. Endothelial progenitor cell dysfunction: a novel concept in the pathogenesis of vascular complications of type 1 diabetes. Diabetes. 2004;53:195–199. doi: 10.2337/diabetes.53.1.195. [DOI] [PubMed] [Google Scholar]
- 44.Tamarat R., Silvestre J.S., Le Ricousse-Roussanne S., Barateau V., Lecomte-Raclet L., Clergue M., Duriez M., Tobelem G., Lévy B.I. Impairment in ischemia-induced neovascularization in diabetes: bone marrow mononuclear cell dysfunction and therapeutic potential of placenta growth factor treatment. Am. J. Pathol. 2004;164:457–466. doi: 10.1016/S0002-9440(10)63136-7. [DOI] [PMC free article] [PubMed] [Google Scholar]
- 45.Dominici M., Le Blanc K., Mueller I., Slaper-Cortenbach I., Marini F., Krause D., Deans R., Keating A., Prockop Dj., Horwitz E. Minimal criteria for defining multipotent mesenchymal stromal cells. The International Society for Cellular Therapy position statement. Cytotherapy. 2006;8:315–317. doi: 10.1080/14653240600855905. [DOI] [PubMed] [Google Scholar]
- 46.Ferrer-Lorente R., Bejar M.T., Tous M., Vilahur G., Badimon L. Systems biology approach to identify alterations in the stem cell reservoir of subcutaneous adipose tissue in a rat model of diabetes: effects on differentiation potential and function. Diabetologia. 2014;57:246–256. doi: 10.1007/s00125-013-3081-z. [DOI] [PubMed] [Google Scholar]
- 47.Oñate B., Vilahur G., Camino-López S., Díez-Caballero A., Ballesta-López C., Ybarra J., Moscatiello F., Herrero J., Badimon L. Stem cells isolated from adipose tissue of obese patients show changes in their transcriptomic profile that indicate loss in stemcellness and increased commitment to an adipocyte-like phenotype. BMC Genomics. 2013;14:625. doi: 10.1186/1471-2164-14-625. [DOI] [PMC free article] [PubMed] [Google Scholar]
- 48.Zhu X.Y., Ma S., Eirin A., Woollard J.R., Hickson L.J., Sun D., Lerman A., Lerman L.O. Functional plasticity of adipose-derived stromal cells during development of obesity. Stem Cells Transl. Med. 2016;5:893–900. doi: 10.5966/sctm.2015-0240. [DOI] [PMC free article] [PubMed] [Google Scholar]
- 49.Scarda A., Franzin C., Milan G., Sanna M., Dal Prà C., Pagano C., Boldrin L., Piccoli M., Trevellin E., Granzotto M. Increased adipogenic conversion of muscle satellite cells in obese Zucker rats. Int. J. Obes. 2010;34:1319–1327. doi: 10.1038/ijo.2010.47. [DOI] [PubMed] [Google Scholar]
- 50.Srikanthan P., Crandall C.J., Miller-Martinez D., Seeman T.E., Greendale G.A., Binkley N., Karlamangla A.S. Insulin resistance and bone strength: findings from the study of midlife in the United States. J. Bone Miner. Res. 2014;29:796–803. doi: 10.1002/jbmr.2083. [DOI] [PMC free article] [PubMed] [Google Scholar]
- 51.Shin L., Peterson D.A. Impaired therapeutic capacity of autologous stem cells in a model of type 2 diabetes. Stem Cells Transl. Med. 2012;1:125–135. doi: 10.5966/sctm.2012-0031. [DOI] [PMC free article] [PubMed] [Google Scholar]
- 52.Ruf W., Edgington T.S. Structural biology of tissue factor, the initiator of thrombogenesis in vivo. FASEB J. 1994;8:385–390. [PubMed] [Google Scholar]
- 53.Mandal S.K., Pendurthi U.R., Rao L.V. Cellular localization and trafficking of tissue factor. Blood. 2006;107:4746–4753. doi: 10.1182/blood-2005-11-4674. [DOI] [PMC free article] [PubMed] [Google Scholar]
- 54.Peña E., Arderiu G., Badimon L. Subcellular localization of tissue factor and human coronary artery smooth muscle cell migration. J. Thromb. Haemost. 2012;10:2373–2382. doi: 10.1111/j.1538-7836.2012.04910.x. [DOI] [PubMed] [Google Scholar]
- 55.Sun X., Gao X., Zhou L., Sun L., Lu C. PDGF-BB-induced MT1-MMP expression regulates proliferation and invasion of mesenchymal stem cells in 3-dimensional collagen via MEK/ERK1/2 and PI3K/AKT signaling. Cell. Signal. 2013;25:1279–1287. doi: 10.1016/j.cellsig.2013.01.029. [DOI] [PubMed] [Google Scholar]
- 56.Zhan Y., Kim S., Izumi Y., Izumiya Y., Nakao T., Miyazaki H., Iwao H. Role of JNK, p38, and ERK in platelet-derived growth factor-induced vascular proliferation, migration, and gene expression. Arterioscler. Thromb. Vasc. Biol. 2003;23:795–801. doi: 10.1161/01.ATV.0000066132.32063.F2. [DOI] [PubMed] [Google Scholar]
- 57.Ross S., Hill C.S. How the Smads regulate transcription. Int. J. Biochem. Cell Biol. 2008;40:383–408. doi: 10.1016/j.biocel.2007.09.006. [DOI] [PubMed] [Google Scholar]
- 58.Schmierer B., Hill C.S. TGFbeta-SMAD signal transduction: molecular specificity and functional flexibility. Nat. Rev. Mol. Cell Biol. 2007;8:970–982. doi: 10.1038/nrm2297. [DOI] [PubMed] [Google Scholar]
- 59.Castronuovo J.J., Jr., Ghobrial I., Giusti A.M., Rudolph S., Smiell J.M. Effects of chronic wound fluid on the structure and biological activity of becaplermin (rhPDGF-BB) and becaplermin gel. Am. J. Surg. 1998;176(2A, Suppl):61S–67S. doi: 10.1016/s0002-9610(98)00175-5. [DOI] [PubMed] [Google Scholar]
- 60.Uhl E., Rösken F., Sirsjö A., Messmer K. Influence of platelet-derived growth factor on microcirculation during normal and impaired wound healing. Wound Repair Regen. 2003;11:361–367. doi: 10.1046/j.1524-475x.2003.11508.x. [DOI] [PubMed] [Google Scholar]
- 61.Borkham-Kamphorst E., Alexi P., Tihaa L., Haas U., Weiskirchen R. Platelet-derived growth factor-D modulates extracellular matrix homeostasis and remodeling through TIMP-1 induction and attenuation of MMP-2 and MMP-9 gelatinase activities. Biochem. Biophys. Res. Commun. 2015;457:307–313. doi: 10.1016/j.bbrc.2014.12.106. [DOI] [PubMed] [Google Scholar]
- 62.Martino M.M., Briquez P.S., Güç E., Tortelli F., Kilarski W.W., Metzger S., Rice J.J., Kuhn G.A., Müller R., Swartz M.A., Hubbell J.A. Growth factors engineered for super-affinity to the extracellular matrix enhance tissue healing. Science. 2014;343:885–888. doi: 10.1126/science.1247663. [DOI] [PubMed] [Google Scholar]
- 63.Caplice N.M., Mueske C.S., Kleppe L.S., Peterson T.E., Broze G.J., Jr., Simari R.D. Expression of tissue factor pathway inhibitor in vascular smooth muscle cells and its regulation by growth factors. Circ. Res. 1998;83:1264–1270. doi: 10.1161/01.res.83.12.1264. [DOI] [PubMed] [Google Scholar]
- 64.Planat-Benard V., Silvestre J.S., Cousin B., André M., Nibbelink M., Tamarat R., Clergue M., Manneville C., Saillan-Barreau C., Duriez M. Plasticity of human adipose lineage cells toward endothelial cells: physiological and therapeutic perspectives. Circulation. 2004;109:656–663. doi: 10.1161/01.CIR.0000114522.38265.61. [DOI] [PubMed] [Google Scholar]
Associated Data
This section collects any data citations, data availability statements, or supplementary materials included in this article.