Abstract
Blood glucose levels fluctuate considerably in diabetic patients with reduced secretion of endogenous insulin. We previously reported that glucagon is secreted excessively in these patients and that taurine increases glucagon secretion in vitro. Therefore, we hypothesized that glucose tolerance would further deteriorate when taurine was administered to diabetic mice incapable of insulin secretion. We generated four groups of streptozotocin (STZ)-treated C57BL/6J mice (STZ-mice): STZ-mice without taurine treatment (STZ-Con), STZ-mice treated with 0.5% (w/v) taurine (STZ-0.5% Tau), STZ-mice treated with 1% (w/v) taurine (STZ-1% Tau), and STZ-mice treated with 2% (w/v) taurine (STZ-2% Tau). Mice were treated for 4 weeks, and then, we evaluated glucose tolerance, pancreatic β-cell area and α-cell area, pancreatic insulin and glucagon content, and daily blood glucose variability. As a result, following the administration of taurine, glucose tolerance improved, both pancreatic β- and α-cell area increased, and both insulin and glucagon content increased. In the 1% taurine administration group, blood glucose variability decreased. These unexpected results suggest that taurine improves glucose tolerance, in spite of its subsequent increased glucagon production, partly by increasing pancreatic β-cells and insulin production in vivo.
Keywords: Insulin-dependent diabetes, Taurine, Glucagon, Glucose variability
Introduction
Pancreatic β-cell destruction is observed in diabetes mellitus, including type 1 diabetes, pancreatic diabetes, and mitochondrial diabetes with deafness [1]. In insulin-dependent diabetes with completely depleted endogenous insulin secretion, there is a subset of patients with large variations in blood glucose. These patients have difficulty controlling their blood glucose levels, a condition sometimes referred to as “brittle diabetes”. We previously reported that glucagon secretion ability contributes to blood glucose variability, independent of the residual pancreatic β-cell function in type 1 diabetes [2].
It has been reported that the glucose concentration affects glucagon secretion in pancreatic islets [3]. Recently, insulin receptor expression in pancreatic α-cells and insulin signaling have been reported to be important for proper glucagon secretion reactions [4, 5]. These reports suggest that a lack of a paracrine effect of insulin on pancreatic α-cells contributes to abnormalities in glucagon secretion, but there have been no reports clarifying the underlying mechanism from the viewpoint of the intracellular metabolism of pancreatic α-cells. Previously, we observed abnormal glucagon secretion in pancreatic α-cells with chronic insulin deficiency using insulin receptor knockdown αTC1-6 cells, derived from a pancreatic α-cell line. We also reported that the administration of taurine to these αTC1-6 cells further increased glucagon secretion abnormalities under high glucose concentrations, indicating the influence of taurine in this process [6].
Taurine is a semi-essential sulfur-containing amino acid derived from methionine and cysteine metabolism. Taurine exerts a variety of biological actions, including membrane stabilization, osmoregulation, cytoprotective effects, and antioxidant and anti-inflammatory activity [7–9]. Moreover, taurine interferes with the inflammatory cascade by diminishing nuclear factor kappa beta (NF-κB) production, which mediates pro-inflammatory signaling pathways [10]. The role of taurine in experimental and clinical type 1 and 2 diabetes mellitus and insulin resistance has been investigated [11]. While it has been reported that, in an animal model of type 1 diabetes, disease onset was suppressed by the administration of taurine [12–16], there have also been reports that hyperglycemia was not improved, even when taurine was administered at the onset of diabetes [17, 18]. It has not yet been clarified how the administration of taurine after the onset of type 1 diabetes affects glucose metabolism.
In this study, we hypothesized that in diabetes where insulin secretion is severely depleted, the administration of taurine may further worsen glucose tolerance by abnormally increasing glucagon secretion. We investigated this by administering taurine in a mouse model of depleted insulin secretion and evaluating insulin and glucagon secretion, pancreatic β- and α-cell areas, and glucose metabolism, including glucose variability.
Materials and methods
Animals and experimental procedures
All institutional and national guidelines for the care and use of laboratory animals were followed. Male 8-week-old C57BL/6J mice were purchased from CLEA Japan (Osaka, Japan). After acclimation for 2 weeks, experimental mice were randomly divided into control mice without streptozotocin (STZ) (Sigma-Aldrich Japan, Tokyo, Japan) (control) and diabetic mice injected with STZ (STZ-mice). All mice were housed in specific pathogen-free barrier facilities, maintained under a 12-h light/dark cycle, and fed standard rodent food and water ad libitum.
Induction of insulin-deficient diabetes
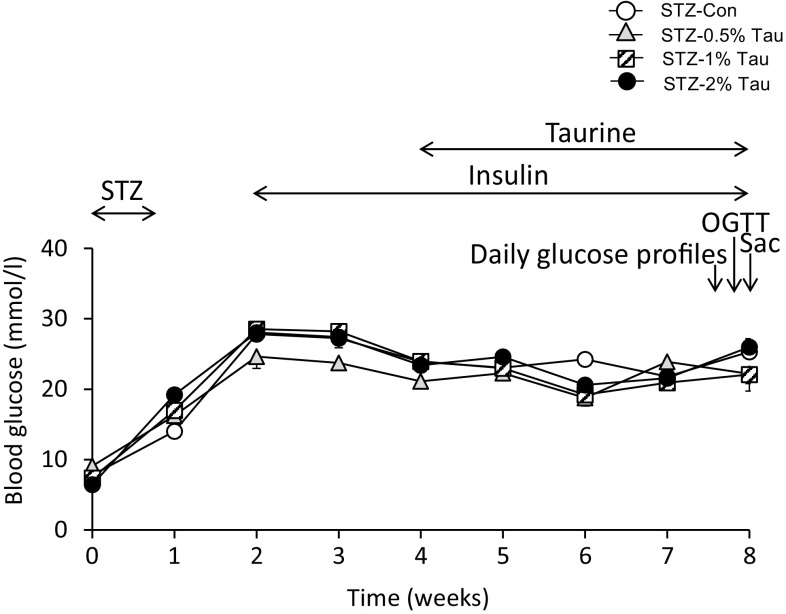
STZ dissolved in sodium citrate buffer (pH 4.5) was injected intraperitoneally in a single daily dose of 75 mg/kg body weight for 5 consecutive days and maintained for 4 weeks to allow animals to reach and surpass the peak incidence of β-cell apoptosis [19]. Control animals were injected with citrate buffer. During the experimental period, body weight and blood glucose concentration were monitored once a week. Mice with a glucose concentration exceeding 16.7 mmol/l were considered diabetic. All STZ-treated mice developed diabetes mellitus within 2 weeks of STZ injection and hyperglycemia persisted for the duration of the experimental period. Insulin therapy (degludec; Tresiba, Sanofi-Aventis US, Bridgewater, NJ, USA) was initiated at a dose of 1.0 U/day beginning 2 weeks after the initiation of STZ (Fig. 1).
Fig. 1.
Time course of changes in blood glucose after STZ injection. Data are expressed as mean ± SEM. STZ-Con STZ-mice without taurine treatment (n = 9), STZ-0.5% Tau STZ-mice treated with 0.5% taurine in drinking water (n = 6), STZ-1% Tau STZ-mice treated with 1% taurine in drinking water (n = 10), STZ-2% Tau STZ-mice treated with 2% taurine in drinking water (n = 5). OGTT oral glucose tolerance test, Sac sacrifice
Taurine treatment
Four weeks after the initial STZ injection, STZ mice were further subdivided into four subgroups for taurine treatment, which was provided in drinking water: STZ mice without taurine treatment (STZ-Con), STZ mice treated with 0.5% (w/v) taurine (STZ-0.5% Tau), STZ mice treated with 1% (w/v) taurine (STZ-1% Tau), and STZ mice treated with 2% (w/v) taurine (STZ-2% Tau) (Sigma-Aldrich, St. Louis, MO, USA).
Glucose variability
To evaluate blood glucose variability in mice, glycemic values were measured in the tail blood of each mouse via a glucose oxidase method using the Glutest sensor (Sanwa Kagaku, Kyoto, Japan) every 4 h beginning at 08.00 h 2 days before and ending at 12.00 h the day before the oral glucose tolerance test (OGTT), which was initiated 4 weeks after the start of taurine treatment. The SD (standard deviation) and MAGE (mean amplitude of glycemic excursions, and the mean of glycemic excursions > 1 SD) [20] were calculated from the measured glucose values.
Oral glucose tolerance test, serum insulin, and glucagon
After 4 weeks of treatment with taurine (week 8), OGTTs were performed after a 16-h fast following the oral administration of 1.5 g/kg glucose diluted in water. Blood samples were obtained sequentially from the tail vein before and after the administration of glucose and immediately used for glucose determination by the method described above or collected in small tubes and centrifuged at 4 °C (0- and 120-min samples). Serum was stored at − 30 °C for subsequent insulin or glucagon measurements. Insulin and glucagon levels in sera were determined by enzyme-linked immunosorbent assay (ELISA; Mercodia AB, Uppsala, Sweden). The area under the curve (AUC) was calculated according to the trapezoidal rule.
Insulin and glucagon content measurements
The pancreas was resected immediately the day after the OGTT. For hormone content measurements, isolated pancreata were placed in an acid–ethanol mixture (0.15 M HCl, 70% EtOH), incubated overnight (− 20 °C), and then homogenized; tissue insulin and glucagon were then extracted by centrifugation (5000×g, 30 min). Insulin and glucagon concentrations were measured using ELISA kits as described above and adjusted for total pancreatic protein concentration (BCA; Thermo Fisher Scientific Inc., Rockford, IL, USA).
Immunohistochemistry and morphometric analysis
An estimate of islet size and number per mm2 pancreas was obtained by morphometric analysis of fixed pancreatic sections with insulin labeled via immunohistochemistry. The entire paraffin-embedded pancreas from each animal was cut into 5-μm sections and placed onto microscope slides for staining and morphometry. Sections were systematically sampled throughout the entire pancreas to give 10–20 sections per animal for analysis. Sections were dewaxed, hydrated, and labeled with a guinea pig polyclonal antibody to insulin (1:5000; Dako Japan, Kyoto, Japan) or a rabbit antibody to glucagon (1:1000; Immunostar, Hudson, WI, USA). Positive cells were visualized with peroxidase-conjugated secondary antibodies to guinea pig or rabbit IgG (Vector Laboratories, Inc., Burlingame, CA, USA) and diaminobenzidine as a substrate. Sections were counterstained with hematoxylin, and digital images of sections were used for image analysis. The diameters of islets and areas of insulin- and glucagon-labeled cells throughout the entire pancreatic section were quantified digitally using Image J software (NIH, Bethesda, MD, USA; http://rsb.info.nih.gov/ij). Numbers of islets, defined as clusters of five or more β-cells in a section, were determined relative to the pancreatic area.
Statistical analysis
All data are expressed as mean ± SEM. Normality was assessed using the Kolmogorov–Smirnov test. For normally distributed data, statistical significance was assessed by one-way analysis of variance (ANOVA). Multiple experimental groups were compared using the Tukey–Kramer post hoc test. For all analyses, values of p < 0.05 were considered statistically significant. All statistical analyses were performed using StatView version 5.0 software (SAS Institute, Cary, NC, USA).
Results
Establishment of depleted insulin secretion diabetes mouse model and taurine administration by group
STZ was continuously administered at 75 mg/kg/day for 5 days to produce a mouse model of depleted insulin secretion. Changes in blood glucose levels in the tail vein and body weight were assessed once per week before the start of STZ administration. At 2 weeks from the start of STZ administration, the blood glucose level was at least 16.7 mmol/l in all mice, and subcutaneous administration of insulin degludec at 1 unit/day was initiated to support life (Fig. 1).
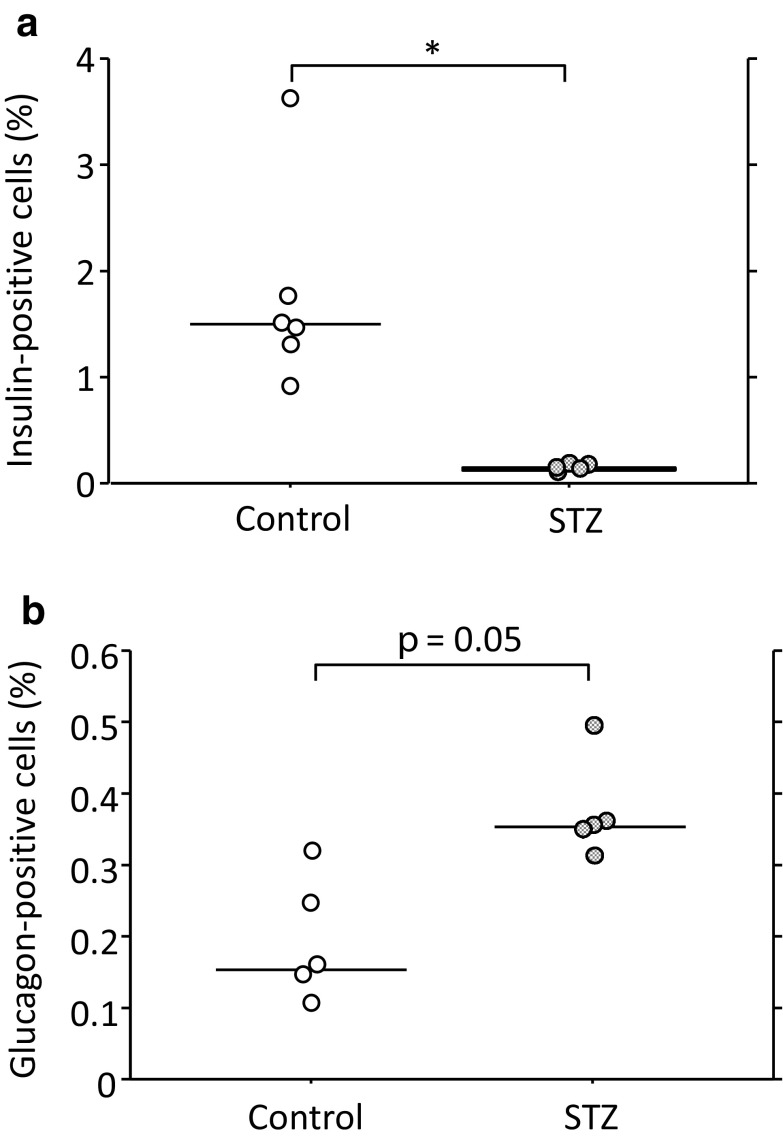
Upon examining the pancreatic tissue at 4 weeks after STZ administration, the insulin-positive cell areas of STZ mice were markedly smaller than those of non-STZ control mice (Fig. 2a). In contrast, the glucagon-positive cell areas of STZ-mice tended to be larger than those of non-STZ control mice (Fig. 2b).
Fig. 2.
Relative insulin- (a) and glucagon-positive cell area (b) to total observed pancreatic section. Con Control mice (n = 6 for insulin, n = 5 for glucagon), STZ 4 weeks after the start of STZ administration (n = 5). *p < 0.05
Effects of taurine administration on mean blood glucose and blood glucose variability
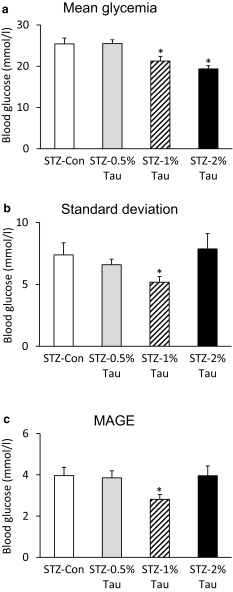
After 4 weeks of taurine administration to diabetic mice with depleted insulin secretion, blood glucose was measured every 4 h for 2 days, and the diurnal variation was examined. The mean blood glucose level was significantly lower in the STZ-1% Tau group and the STZ-2% Tau group than in the STZ-Con group, while the SD and MAGE were significantly lower only in the STZ-1% Tau group compared with the STZ-Con group (Fig. 3).
Fig. 3.
Mean glycemia (a) and indices of blood glucose variability, including standard deviation (b) and MAGE (mean amplitude of glucose excursion) (c), derived from 8 blood glucose measurements over 28 h taken at 4 weeks after the start of taurine treatment. Data are expressed as mean ± SEM. STZ-Con STZ-mice without taurine (n = 8), STZ-0.5% Tau STZ-mice treated with 0.5% taurine (n = 5), STZ-1% Tau STZ-mice treated with 1% taurine (n = 9), STZ-2% Tau STZ-mice treated with 2% taurine (n = 5). *p < 0.05 versus STZ-mice without taurine
Oral glucose tolerance test
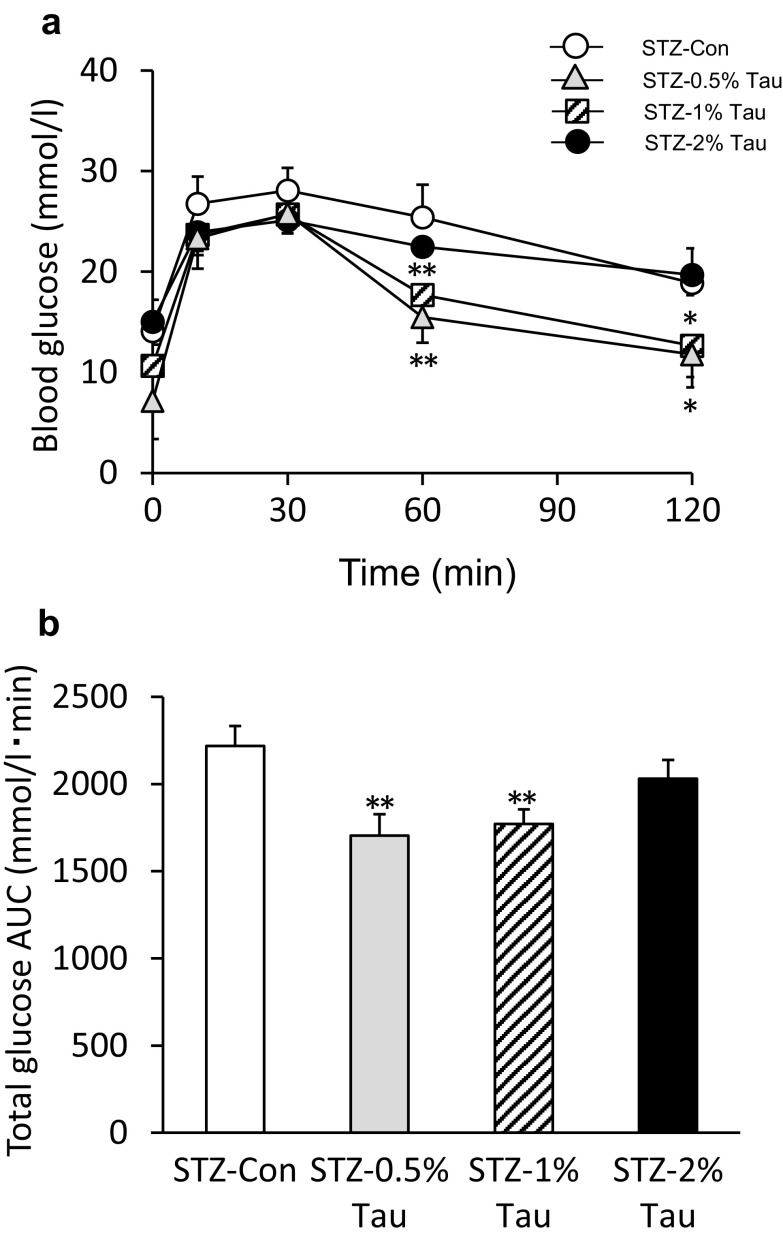
An OGTT was performed the day after checking blood glucose variability. The blood glucose levels at 60 min after a glucose load were significantly lower in the STZ-0.5% Tau and STZ-1% Tau groups than in the STZ-Con group (Fig. 4a). The total glucose AUC was also significantly lower in the STZ-0.5% Tau and STZ-1% Tau groups than in the STZ-Con group (Fig. 4b).
Fig. 4.
Changes in glucose (a) and total area under the glucose curve (AUC) (b) during the oral glucose tolerance test (OGTT) after 4 weeks of treatment with taurine. Data are expressed as mean ± SEM. STZ-Con STZ-mice without taurine (n = 16); STZ-0.5% Tau STZ-mice treated with 0.5% taurine (n = 10); STZ-1% Tau STZ-mice treated with 1% taurine (n = 13); STZ-2% Tau STZ-mice treated with 2% taurine (n = 5). *p < 0.05; **p < 0.01 versus STZ-mice without taurine
The serum insulin level before glucose loading was significantly higher in the STZ-1% Tau and STZ-2% Tau groups than in the STZ-Con group (Fig. 5a), and no difference in serum glucagon levels before or after glucose loading was observed among the STZ-Con group and the taurine treatment groups (Fig. 5b).
Fig. 5.
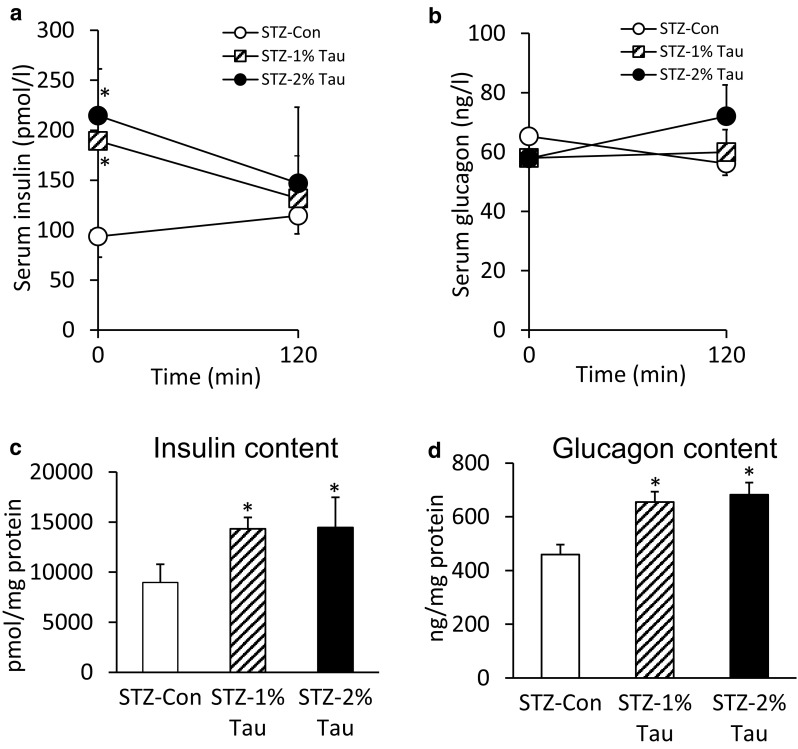
Serum insulin (a) and glucagon values (b) at 0 and 120 min during the OGTT. Pancreatic insulin (c) and glucagon content (d) the day after the OGTT (after 4 weeks of taurine treatment). Data are expressed as mean ± SEM. STZ-Con STZ-mice without taurine (n = 4), STZ-1% Tau STZ-mice treated with 1% taurine (n = 3), STZ-2% Tau STZ-mice treated with 2% taurine (n = 5). *p < 0.05 versus STZ-mice without taurine
Effects of taurine administration on insulin content, glucagon content, and insulin- and glucagon-positive cell area
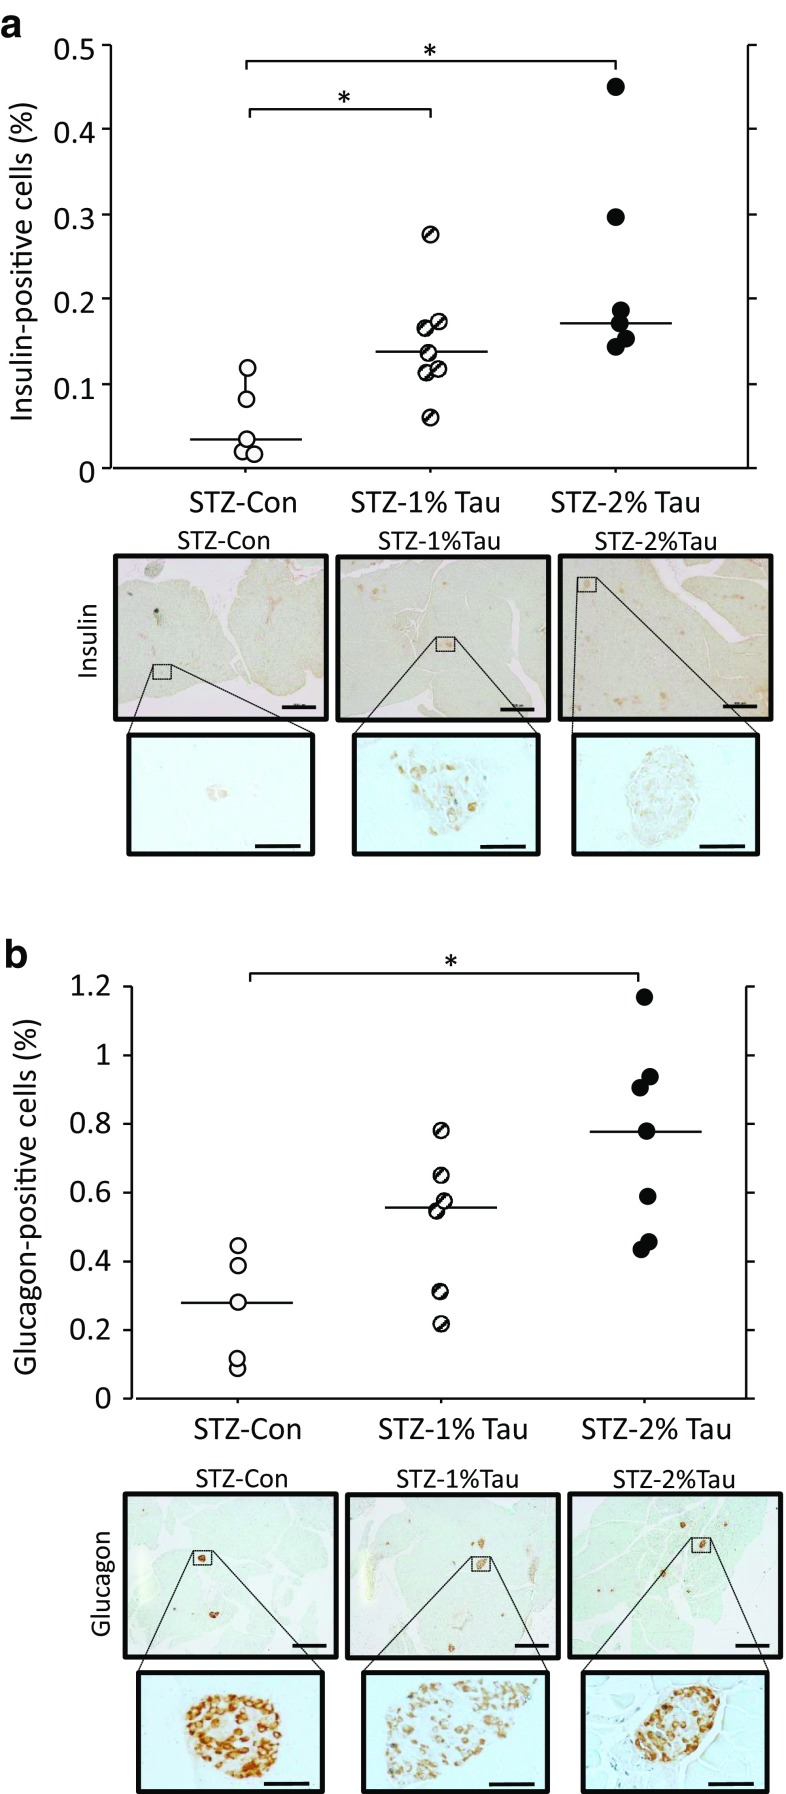
Both the insulin and glucagon contents of pancreatic tissue increased in the STZ-1% Tau and STZ-2% Tau groups compared with the STZ-Con group 4 weeks after the start of taurine administration (Fig. 5c, d). Upon histological examination, the insulin-positive cell area significantly increased with increasing concentrations of taurine administered (Fig. 6a). In addition, the glucagon-positive cell area was significantly higher in the STZ-2% Tau group compared with that in the STZ-Con group (Fig. 6b). Insulin-positive cells appeared to be scattered within the islets (Fig. 6a). Among glucagon-positive cells, some were located in areas of disrupted islet architecture as more centrally located α-cells, while some were predominantly located at the islet periphery (Fig. 6b).
Fig. 6.
Relative insulin-positive cell area to total observed pancreatic section and representative immunostaining for insulin (a), as well as relative glucagon-positive cell area to total observed pancreatic section and representative immunostaining for glucagon (b) after 4 weeks of treatment with taurine. Scale bar: Top = 500 μm, Bottom = 50 μm. STZ-Con STZ-mice without taurine (n = 5), STZ-1% Tau STZ-mice treated with 1% taurine (n = 7 for insulin, n = 6 for glucagon), STZ-2% Tau STZ-mice treated with 2% taurine (n = 6 for insulin, n = 7 for glucagon). *p < 0.05 versus STZ-mice without taurine
Effects of taurine administration on the number and size of pancreatic Langerhans islets
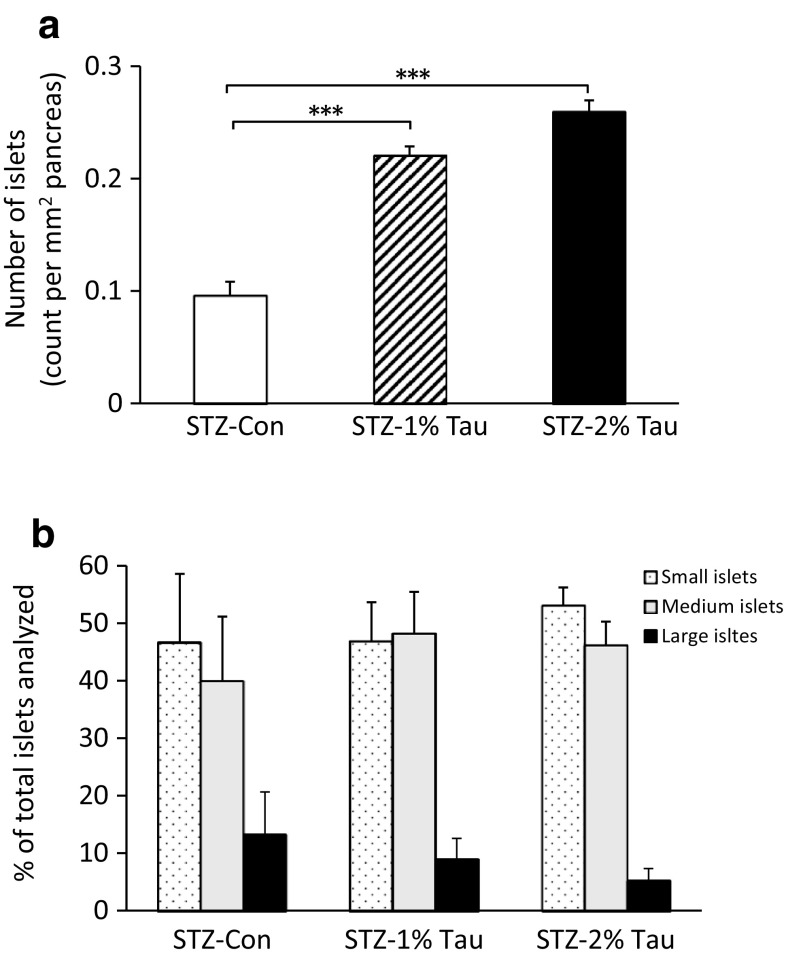
Since the insulin- and glucagon-positive cell areas increased with taurine administration, we examined how the pancreatic islet itself changes. After the administration of taurine for 4 weeks, the number of islets increased with increasing concentrations of taurine administered (Fig. 7a), but the size of the islet itself did not change (Fig. 7b).
Fig. 7.
Number of islets per mm2 of pancreas (a) and islet size (b) after 4 weeks of treatment with taurine. For analysis of islet size distribution, islets were classified as: small, < 5.0 μm2; medium, > 5.0 μm2 and < 20.0 μm2; and large, > 20.0 μm2. Data are expressed as mean ± SEM. STZ-Con STZ-mice without taurine (n = 5), STZ-1% Tau STZ-mice treated with 1% taurine (n = 6), STZ-2% Tau STZ-mice treated with 2% taurine (n = 7). ***p < 0.001 versus STZ-mice without taurine
Discussion
In the present study, model mice with depleted insulin secretion were created and treated with taurine, which served to improve their impaired glucose tolerance, increase the pancreatic β- and α-cell areas, increase both insulin and glucagon contents, and decrease blood glucose variability, at least in part.
First, glucose tolerance improved in the taurine-treated groups due to glucose loading. We previously reported that taurine enhances glucagon secretion in vitro in a pancreatic α-cell model in which paracrine insulin action was depleted [6]. This prompted us to speculate that glucose tolerance might be exacerbated via the abnormal secretion of glucagon when taurine is administered in vivo. However, in the present study, glucose tolerance improved following taurine administration.
Second, blood glucose variability decreased in the group treated with 1% taurine compared with that in the control group. Our previous studies suggested that excess glucagon secretion may be one of the factors that increases blood glucose variability in type 1 diabetes mellitus with endogenous insulin depletion [2]. In this study, the pancreatic islets, which were almost completely destroyed following STZ administration, increased in number after taurine administration. This indicates that both glucagon and insulin production increased, resulting in favorable effects on blood glucose variability.
Third, the administration of taurine increased both pancreatic β- and α-cells, resulting in small but significant increases in both insulin and glucagon contents in pancreatic tissue, and the insulin and glucagon responses to oral glucose load were not affected by taurine supplementation. The behavior of the new β- and α-cells induced by taurine supplementation may be physiologically different from that of normal islets. Moreover, the improved glucose tolerance may be due to other factors, such as an increase in non-insulin-dependent glucose disposal via an unknown mechanism.
There are several reports that taurine administration improves glucose tolerance in type 1 diabetes model animals before the onset of diabetes [12, 13, 21]. The protection of pancreatic β-cells by taurine has been suggested as a possible mechanism [17, 18]. However, there have been no detailed reports on the effects of taurine administration on type 1 diabetes after disease onset or on glucose metabolism, including in pancreatic α-cells. When taurine was administered to pregnant non-obese diabetic (NOD) mice, the onset of diabetes was delayed, with an increase in pancreatic islets in neonates [15].
In the current study, the number of islets, which were defined as clusters of five or more β-cells in a section, increased, while the size of the islet itself did not change, and the insulin- and glucagon-positive cell areas increased following taurine administration. In other words, the number of islets containing new α-cells and β-cells increased regardless of islet size following taurine treatment. Based on these findings, we speculate that proliferated β-cells might be converted from other endocrine cells, such as via α-to-β-cell transdifferentiation. α-Cells can be converted into β-cells under conditions of extreme β-cell damage [22]. Non-β endocrine cells have been proposed to be progenitors capable of replenishing lost β-cells [23–25]. Taurine is known to promote the differentiation of neural and retinal stem/progenitor cells [26, 27]; thus, it may promote α-cell to β-cell transdifferentiation. In addition, taurine may facilitate cell proliferation through antioxidant activity via an effect on the redox state of the cells, which is known to regulate DNA replication and improve mitochondrial functioning [28] in various cell types [29–31]. Taken together, these data indicate that taurine may stimulate islet differentiation and proliferation, which may result in an increased number of islets.
The optimal concentration of taurine for improving glucose tolerance was 0.5–1%. In the group of STZ-2% mice, both the insulin and glucagon contents increased, and glucagon values tended to increase after glucose loading as well. According to daily blood glucose profiles, mean glycemia decreased, while MAGE and SD did not improve compared to those in the non-taurine-treated group, suggesting the occurrence of a hidden glucose spike in the 2% taurine-treated group. These findings led to the conclusion that glucose tolerance did not improve in the STZ-2% group. While a taurine concentration of 2% was the most effective for increasing pancreatic β- or α-cells, all mice died within 4 weeks after the start of 5% taurine administration (data not shown). This suggests that high concentrations of taurine may induce some type of taurine toxicity in this model, irrespective of increases in β- or α-cells, due to, for example, cerebral edema caused by a sudden change in intracellular osmotic pressure [32].
The results of this study indicate that taurine administration in diabetes with depleted secretion of endogenous insulin may improve glucose tolerance, at least in part by increasing both pancreatic β- and α-cells. Therefore, it is expected that the concurrent administration of taurine may be effective for increasing pancreatic β-cells in type 1 diabetes.
Acknowledgements
This study was supported by a Grant-in-aid (25461367) from the Ministry of Science, Education and Culture of Japan (to Y.M–M.).
Animal rights
All institutional and national guidelines for the care and use of laboratory animals were followed.
Conflict of interest
TH. has received honoraria from Novo Nordisk Pharma for lectures. A.I. has received honoraria from Eli Lilly Japan for lectures. Y.N., Y.M–M., M.B-T., and J.T. declare that they have no conflict of interest.
References
- 1.American Diabetes Association Classification and diagnosis of diabetes. Diabetes Care. 2017;40(Supplement 1):S11–S24. doi: 10.2337/dc17-S005. [DOI] [PubMed] [Google Scholar]
- 2.Bessho M, Murase-Mishiba Y, Tsutsumi C, Haseda F, Imagawa A, Terasaki J, Hanafusa T. Glycaemic instability correlates with a hyperglucagonaemic response in patients with type 1 diabetes without residual beta-cell function. Diabetes Res Clin Pract. 2013;102(2):e38–e40. doi: 10.1016/j.diabres.2013.09.003. [DOI] [PubMed] [Google Scholar]
- 3.Zhang Q, Ramracheya R, Lahmann C, Tarasov A, Bengtsson M, Braha O, Braun M, Brereton M, Collins S, Galvanovskis J, Gonzalez A, Groschner LN, Rorsman NJ, Salehi A, Travers ME, Walker JN, Gloyn AL, Gribble F, Johnson PR, Reimann F, Ashcroft FM, Rorsman P. Role of KATP channels in glucose-regulated glucagon secretion and impaired counter regulation in type 2 diabetes. Cell Metab. 2013;18(6):871–882. doi: 10.1016/j.cmet.2013.10.014. [DOI] [PMC free article] [PubMed] [Google Scholar]
- 4.Diao J, Asghar Z, Chan CB, Wheeler MB. Glucose-regulated glucagon secretion requires insulin receptor expression in pancreatic alpha-cells. J Biol Chem. 2005;280(39):33487–33496. doi: 10.1074/jbc.M506276200. [DOI] [PubMed] [Google Scholar]
- 5.Kawamori D, Kurpad AJ, Hu J, Liew CW, Shih JL, Ford EL, Herrera PL, Polonsky KS, McGuinness OP, Kulkarni RN. Insulin signaling in alpha cells modulates glucagon secretion in vivo. Cell Metab. 2009;9(4):350–361. doi: 10.1016/j.cmet.2009.02.007. [DOI] [PMC free article] [PubMed] [Google Scholar]
- 6.Bessho M, Murase-Mishiba Y, Imagawa A, Terasaki J, Hanafusa T. Possible contribution of taurine to distorted glucagon secretion in intra-islet insulin deficiency: a metabolome analysis using a novel α-cell model of insulin-deficient diabetes. PLoS One. 2014;9(11):e113254. doi: 10.1371/journal.pone.0113254. [DOI] [PMC free article] [PubMed] [Google Scholar]
- 7.Weiss SJ, Klein R, Slivka A, Wei M. Chlorination of taurine by human neutrophils. Evidence for hypochlorous acid generation. J Clin Invest. 1982;70(3):598–607. doi: 10.1172/JCI110652. [DOI] [PMC free article] [PubMed] [Google Scholar]
- 8.Gürer H, Ozgünes H, Saygin E, Ercal N. Antioxidant effect of taurine against lead-induced oxidative stress. Arch Environ Contam Toxicol. 2001;41(4):397–402. doi: 10.1007/s002440010265. [DOI] [PubMed] [Google Scholar]
- 9.Marcinkiewicz J, Kontny E. Taurine and inflammatory diseases. Amino Acids. 2014;46(1):7–20. doi: 10.1007/s00726-012-1361-4. [DOI] [PMC free article] [PubMed] [Google Scholar]
- 10.Kontny E, Szczepańska K, Kowalczewski J, Kurowska M, Janicka I, Marcinkiewicz J, Maśliński W. The mechanism of taurine chloramine inhibition of cytokine (interleukin-6, interleukin-8) production by rheumatoid arthritis fibroblast-like synoviocytes. Arthritis Rheum. 2000;43(10):2169–2177. doi: 10.1002/1529-0131(200010)43:10<2169::AID-ANR4>3.0.CO;2-#. [DOI] [PubMed] [Google Scholar]
- 11.Franconi F, Loizzo A, Ghirlanda G, Seghieri G. Taurine supplementation and diabetes mellitus. Curr Opin Clin Nutr Metab Care. 2006;9(1):32–36. doi: 10.1097/01.mco.0000196141.65362.46. [DOI] [PubMed] [Google Scholar]
- 12.Tokunaga H, Yoneda Y, Kuriyama K. Streptozotocin-induced elevation of pancreatic taurine content and suppressive effect of taurine on insulin secretion. Eur J Pharmacol. 1983;87(2–3):237–243. doi: 10.1016/0014-2999(83)90333-3. [DOI] [PubMed] [Google Scholar]
- 13.Alvarado-Vásquez N, Zamudio P, Cerón E, Vanda B, Zenteno E, Carvajal-Sandoval G. Effect of glycine in streptozotocin-induced diabetic rats. Comp Biochem Physiol C Toxicol Pharmacol. 2003;134(4):521–527. doi: 10.1016/S1532-0456(03)00046-2. [DOI] [PubMed] [Google Scholar]
- 14.Tenner TE, Jr, Zhang XJ, Lombardini JB. Hypoglycemic effects of taurine in the alloxan-treated rabbit, a model for type 1 diabetes. Adv Exp Med Biol. 2003;526:97–104. doi: 10.1007/978-1-4615-0077-3_13. [DOI] [PubMed] [Google Scholar]
- 15.Arany E, Strutt B, Romanus P, Remacle C, Reusens B, Hill DJ. Taurine supplement in early life altered islet morphology, decreased insulitis and delayed the onset of diabetes in non-obese diabetic mice. Diabetologia. 2004;47(10):1831–1837. doi: 10.1007/s00125-004-1535-z. [DOI] [PubMed] [Google Scholar]
- 16.Winiarska K, Szymanski K, Gorniak P, Dudziak M, Bryla J. Hypoglycaemic, antioxidative and nephroprotective effects of taurine in alloxan diabetic rabbits. Biochimie. 2009;91(2):261–270. doi: 10.1016/j.biochi.2008.09.006. [DOI] [PubMed] [Google Scholar]
- 17.Chang KJ, Kwon W. Immunohistochemical localization of insulin in pancreatic beta-cells of taurine-supplemented or taurine-depleted diabetic rats. Adv Exp Med Biol. 2000;483:579–587. doi: 10.1007/0-306-46838-7_62. [DOI] [PubMed] [Google Scholar]
- 18.Gavrovskaya LK, Ryzhova OV, Safonova AF, Matveev AK, Sapronov NS. Protective effect of taurine on rats with experimental insulin-dependent diabetes mellitus. Bull Exp Biol Med. 2008;146(2):226–228. doi: 10.1007/s10517-008-0258-4. [DOI] [PubMed] [Google Scholar]
- 19.O’Brien BA, Harmon BV, Cameron DP, Allan DJ. Beta-cell apoptosis is responsible for the development of IDDM in the multiple low-dose streptozotocin model. J Pathol. 1996;178(2):176–181. doi: 10.1002/(SICI)1096-9896(199602)178:2<176::AID-PATH433>3.0.CO;2-8. [DOI] [PubMed] [Google Scholar]
- 20.Serrrvice FJ, Molnar GD, Rosevear JW, Ackerman E, Gatewood LC, Taylor WF. Mean amplitude of glycemic excursions, a measure of diabetic instability. Diabetes. 1970;19(9):644–655. doi: 10.2337/diab.19.9.644. [DOI] [PubMed] [Google Scholar]
- 21.Tokunaga H, Yoneda Y, Kuriyama K. Protective actions of taurine against streptozotocin-induced hyperglycemia. Biochem Pharmacol. 1979;28(18):2807–2811. doi: 10.1016/0006-2952(79)90566-5. [DOI] [PubMed] [Google Scholar]
- 22.Talchai C, Xuan S, Lin HV, Sussel L, Accili D. Pancreatic β cell dedifferentiation as a mechanism of diabetic β cell failure. Cell. 2012;150(6):1223–1234. doi: 10.1016/j.cell.2012.07.029. [DOI] [PMC free article] [PubMed] [Google Scholar]
- 23.Fernandes A, King LC, Guz Y, Stein R, Wright CV, Teitelman G. Differentiation of new insulin-producing cells is induced by injury in adult pancreatic islets. Endocrinology. 1997;138(4):1750–1762. doi: 10.1210/endo.138.4.5049. [DOI] [PubMed] [Google Scholar]
- 24.Guz Y, Nasir I, Teitelman G. Regeneration of pancreatic beta cells from intra-islet precursor cells in an experimental model of diabetes. Endocrinology. 2001;142(11):4956–4968. doi: 10.1210/endo.142.11.8501. [DOI] [PubMed] [Google Scholar]
- 25.Thorel F, Népote V, Avril I, Kohno K, Desgraz R, Chera S, Herrera PL. Conversion of adult pancreatic alpha-cells to beta-cells after extreme beta-cell loss. Nature. 2010;464(7292):1149–1154. doi: 10.1038/nature08894. [DOI] [PMC free article] [PubMed] [Google Scholar]
- 26.Hernández-Benítez R, Ramos-Mandujano G, Pasantes-Morales H. Taurine stimulates proliferation and promotes neurogenesis of mouse adult cultured neural stem/progenitor cells. Stem Cell Res. 2012;9(1):24–34. doi: 10.1016/j.scr.2012.02.004. [DOI] [PubMed] [Google Scholar]
- 27.Osakada F, Jin ZB, Hirami Y, Ikeda H, Danjyo T, Watanabe K, Sasai Y, Takahashi M. In vitro differentiation of retinal cells from human pluripotent stem cells by small-molecule induction. J Cell Sci. 2009;122(Pt 17):3169–3179. doi: 10.1242/jcs.050393. [DOI] [PubMed] [Google Scholar]
- 28.Ramos-Mandujano G, Hernández-Benítez R, Pasantes-Morales H. Multiple mechanisms mediate the taurine-induced proliferation of neural stem/progenitor cells from the subventricular zone of the adult mouse. Stem Cell Res. 2014;12(3):690–702. doi: 10.1016/j.scr.2014.02.009. [DOI] [PubMed] [Google Scholar]
- 29.Jong CJ, Azuma J, Schaffer S. Mechanism underlying the antioxidant activity of taurine: prevention of mitochondrial oxidant production. Amino Acids. 2012;42(6):2223–2232. doi: 10.1007/s00726-011-0962-7. [DOI] [PubMed] [Google Scholar]
- 30.Kim J, Wong PK. Loss of ATM impairs proliferation of neural stem cells through oxidative stress-mediated p38 MAPK signaling. Stem Cells. 2009;27(8):1987–1998. doi: 10.1002/stem.125. [DOI] [PubMed] [Google Scholar]
- 31.Sharma RK, Zhou Q, Netland PA. Effect of oxidative preconditioning on neural progenitor cells. Brain Res. 2008;1243:19–26. doi: 10.1016/j.brainres.2008.08.025. [DOI] [PubMed] [Google Scholar]
- 32.Trachtman H, Futterweit S, Sturman JA. Cerebral taurine transport is increased during streptozocin-induced diabetes in rats. Diabetes. 1992;41(9):1130–1140. doi: 10.2337/diab.41.9.1130. [DOI] [PubMed] [Google Scholar]


