Abstract
Chronic inflammation is a pathophysiology of insulin resistance in metabolic diseases, such as obesity and type 2 diabetes. Adipose tissue macrophages (ATMs) play important roles in this inflammatory process. SIRT1 is implicated in the regulation of glucose metabolism in some metabolic tissues, such as liver or skeletal muscle. This study was performed to investigate whether SIRT1 in macrophages played any roles in the regulation of inflammation and glucose metabolism. Myeloid cell-specific SIRT1-knockout mice were originally generated and analyzed under chow-fed and high-fat-fed conditions. Myeloid cell-specific SIRT1 deletion impaired insulin sensitivity and glucose tolerance assessed by the glucose- or insulin-tolerance test, which was associated with the enhanced expression of inflammation-related genes in epididymal adipose tissue of high-fat-fed mice. Interestingly, the M1 ATMs from the SIRT1-knockout mice showed more hypoxic and inflammatory phenotypes than those from control mice. The expressions of some inflammatory genes, such as Il1b and Nos2, which were induced by in vitro hypoxia treatment, were further enhanced by SIRT1 deletion along with the increased acetylation of HIF-1α in cultured macrophages. These results suggest that deletion of SIRT1 in myeloid cells impairs glucose metabolism by enhancing the hypoxia and inflammatory responses in ATMs, thereby possibly representing a novel therapeutic target for metabolic diseases, such as type 2 diabetes.
Electronic supplementary material
The online version of this article (doi:10.1007/s13340-015-0213-3) contains supplementary material, which is available to authorized users.
Keywords: SIRT1, Adipose tissue, Macrophage, Hypoxia, Insulin resistance, Obesity, HIF-1α
Introduction
Chronic and low-grade inflammation is closely associated with the pathophysiology of insulin resistance observed in various metabolic diseases, such as obesity and type 2 diabetes [1, 2]. Visceral adipose tissue is a major site of obesity-induced chronic inflammation, where a variety of immune cells are involved in the development of inflammation [3, 4]. In particular, adipose tissue macrophages (ATMs) accumulate in adipose tissues in individuals with increasing body weight and play important roles in this inflammatory process [5–7].
In general, tissue macrophages are phenotypically heterogeneous and are broadly characterized according to the activation (polarization) state by the M1/M2 classification system [8, 9]. Lumeng et al. [10] reported that ATMs could also be classified into two different phenotypes, M1 and M2 ATMs. M1 ATMs highly express genes related to inflammation or oxidative stress in visceral adipose tissues from obese mice, which reportedly induces insulin resistance. While M1 ATMs rarely exist in the visceral adipose tissue of lean mice, the number of M1 ATMs in visceral adipose tissue dramatically increases in obese mice [10–13], suggesting that M1 ATMs play some roles in the progress of obesity-induced insulin resistance.
Several recent studies have provided consistent evidence that adipose tissue hypoxia exists in obese mice and that it contributes to the initiation of chronic inflammation in the adipose tissue [14–17]. Reportedly, hypoxia directly promotes inflammatory responses through the activation of two major transcription factors: hypoxia-inducible factor-1α (HIF-1α) and NF-κB [18–20]. In addition, adipose tissue hypoxia also indirectly induces inflammatory responses via lipolysis and adipocyte death in adipose tissues [21]. We recently reported a novel relationship between adipose tissue hypoxia and the inflammatory response of M1 ATMs in high fat-fed mice [22]. The expression of hypoxia-related genes was higher and the uptake of pimonidazole, a hypoxia probe, was greater in M1 ATMs than in M2 ATMs. When bone marrow-derived macrophages were incubated in a 1 % hypoxia chamber, the expression of some inflammatory genes, such as Il1b and Nos2, was induced in an HIF-1α-dependent manner. Interestingly, some inflammatory genes, including Tnf, were not induced by a similar hypoxia treatment, suggesting that chronic inflammation in macrophages was induced by a hypoxia-dependent or -independent mechanism.
SIRT1, a mammalian homolog of yeast Sir2, is a NAD+-dependent histone deacetylase [23] that regulates many transcriptional regulators, including p53 [24], NF-κB [25], PGC-1α [26] and HIF-1α [27]. Among the various functions of SIRT1, many recent studies have demonstrated that SIRT1 regulates metabolic processes including lipolysis, fatty acid oxidation, mitochondrial activity and gluconeogenesis [28–30]. The roles of SIRT1 in metabolic tissues, including liver [31, 32] and skeletal muscle [33], have been demonstrated by analyses of tissue-specific SIRT1-deletion mice.
Recent studies have demonstrated that the antiinflammatory function of SIRT1 is associated with the metabolic regulation [31, 32, 34, 35]. The artificial overexpression of SIRT1 leads to the suppression of the inflammatory response, whereas the deletion of the protein in hepatocytes or myeloid cells results in an increase in local inflammation. In addition, the systemic administration of SIRT1-activating molecules, including resveratrol and pharmacologic activators, has been shown to protect mice against metabolic abnormalities and inflammation [28, 36–39]. Several mechanisms have been postulated for the antiinflammatory function of SIRT1, such as the inhibition of the transcriptional activity of NF-κB [25]. Another possible target of SIRT1 is HIF transcriptional factors, the activation of which is involved in the hypoxia-induced inflammatory response [40]. Recently, sirtuins have been shown to modulate HIF activity, strengthening the link between cellular stress and HIF responses [27, 41, 42].
In this study, we independently generated mutant mice in which SIRT1 protein was completely undetectable in bone marrow-derived macrophages (Mye-SIRT1 KO mice). By analyzing the mice, we tried to clarify the role of SIRT1 in myeloid cells in the regulation of systemic glucose metabolism under HFD conditions. Furthermore, we investigated the effects of Sirt1 gene deletion on hypoxia-dependent and -independent inflammatory responses in macrophages.
Methods
Generation of Mye-SIRT1 knockout mice
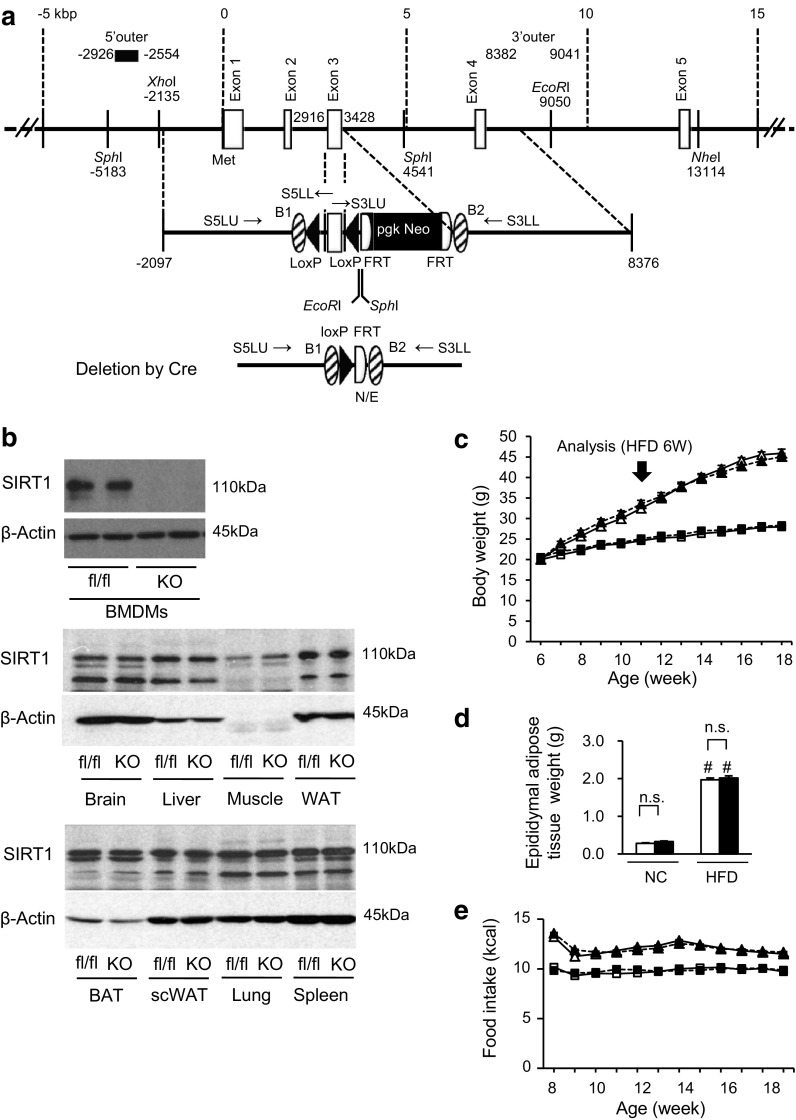
In this study, we independently generated Sirt1 flox/flox mice. A BAC genomic clone (RP23-243E2) originating from the DNA of C57BL/6 mice and containing the Sirt1 gene was obtained from the BACPAC Resource Center CHORI (Oakland). The counter-selection BAC modification kit (Gene Bridges) and the MultiSite Gateway Three-Fragment Vector Construction kit (Invitrogen) were modified for the targeting vector construction. The nucleotide sequence of the mouse genome was obtained from the National Center for Biotechnology Information (NCBI Map Viewer, Mus musculus Build 36.1); the initiation site for translation in the Sirt1 (the A of ATG) refers to position +1, and the proceeding residues are indicated by negative numbers in this report (Fig. 1a). The exon containing the initiation site for translation is regarded as exon 1 in this report. The 5′ arm of ~5 kb (no. −2097 to +2916) and the 3′ arm of ~5 kb (no. +3428 to +8376) were subcloned into pDONR P4-P1R and pDONER P2R-P3 vectors, respectively, using the counter-selection BAC modification kit. A 511-bp Sirt1 gene (no. +2917 to +3427) containing exon 3, part of intron 2 and part of intron 3 was amplified by PCR and subcloned between two loxP sequences of a modified pDONER 221 vector containing two loxP sequences and a pgk-Neo cassette flanked by two frt sites. To construct the targeting vector, these three plasmids were directionally subcloned into pDEST R4-R3 containing the diphtheria toxin gene (MC1-DTA) using the MultiSite Gateway LR recombination reaction. The targeting vector linearized with NotI was electroporated into the embryonic stem (ES) cell line RENKA derived from the C57BL/6 strain, as described previously [43]. After the selection with G418, recombinant ES clones were identified using a Southern blot analysis and the 5′ probe (no. −2926 to −2554) on SphI-digested genomic DNA, the 3′ probe (+8382 to +9041) on EcoRI-digested genomic DNA and the Neo probe [43] on EcoRI-digested genomic DNA. The PCR-amplified fragments were verified using the DNA sequencer PRISM 3100 (Applied Biosystems). Targeted clones were injected into eight-cell stage embryos of mouse strain CD-1. The embryos were cultured to blastocysts and transferred to a pseudopregnant CD-1 mouse uterus. Resulting male chimeric mice were crossed with female CAG-FLPe deleter mice [44] to remove the pgk-Neo cassette and to obtain the heterozygous Sirt1 flox/+ strain. Further genotyping of the Sirt1 flox mice was performed using PCR and the primers S5LU: 5′-GCC TGA TCT ACA GAG CAA GTT CCA G-3′, S5LL: 5′-GGA AGA AAG ACT CAC ATC AAT TCC ACT TC-3′, S3LU: 5′-AGT TCT GAC TGG AGC TGG GGT ATG-3′ and S3LL: 3′-CAA CAC CCA TTT CTG GCC TCT GTG-5′. The PCR products of the S5LU primer and the S5LL primer represent the floxed allele (318 bp) and the WT allele (248 bp), respectively. The PCR products of the S3LU primer and the S3LL primer represent the floxed allele (496 bp) and the WT allele (383 bp), respectively (Supplemental Fig. 1a).
Fig. 1.
Myeloid cell-specific SIRT1 deletion does not affect body weight and food intake in high-fat-fed mice. a Constructs of the Sirt1 gene, targeting vector and knocked out Sirt1 allele. b Amounts of SIRT1 protein in various tissues. BMDMs, bone marrow-derived macrophages; Muscle, quadriceps; WAT, white adipose tissue (epididymal adipose tissue); BAT, brown adipose tissue; scWAT, subcutaneous white adipose tissue; fl/fl, Sirt1 flox/flox control mouse; KO, Mye-SIRT1 KO mouse. c Body weight of Mye-SIRT1 KO mice (KO) and control mice (fl/fl) fed a normal chow diet (NC) or a high fat diet (HFD). n = 26–41. d Epididymal fat weight at 12 weeks of age. n = 26–41. e Food intake. n = 9–19. White triangles = fl/fl on HFD; black triangles = KO on HFD; white squares = fl/fl on NC; black squares = KO on NC (b, d). Data are shown as the mean ± SEM; n.s., not significant; # P < 0.01 vs. NC
LysM-Cre knock-in mice (LysM-CreKI/+), a mouse strain that expresses Cre recombinase in a manner driven by the lysozyme promoter [45], were obtained from the RIKEN Bio Resource Center (Ibaraki, Japan). A NLS-cre cDNA was inserted into the endogenous ATG start site of the Lyz2 gene. These mice express Cre recombinase in a manner driven by the lysozyme promoter, and they allow for both specific and highly efficient Cre-mediated deletion of loxP-flanked target genes in myeloid cells. Sirt1 flox/flox mice (C57BL/6 background) were mated with LysM-CreKI/+ mice (C57BL/6 background) to generate myeloid cell-specific SIRT1 knockout mice (Mye-SIRT1 KO, Sirt1 flox/flox; LysM-CreKI/+) and control mice (Sirt1 flox/flox). The expression of Sirt1 was evaluated using quantitative real-time RT-PCR and a Western blot analysis (Supplemental Fig. 1b, Fig. 1b). As expected, SIRT1 protein was undetectable only in bone marrow-derived macrophages (BMDMs), but detectable in the other tissues of Mye-SIRT1 KO mice (Fig. 1b). The animal care and experimental protocols were approved by the Animal Experiment Committee of the University of Toyama (authorization no. S2008-MED-48, S2009-MED-78 and A2012UH-1) and were carried out in accordance with the Guidelines for the Care and Use of Laboratory Animals of the University of Toyama, based on international policies.
Maintenance of mice and tissue sampling
The mice were maintained under standard light conditions (12-h light/dark cycle) and were allowed free access to water and food. Male 6-week-old Mye-SIRT1 KO mice and control mice were fed ad libitum on either a normal chow diet (NC) that obtained 10 % of its calories from fat (CLEA Japan) or a high-fat diet (HFD) that obtained 60 % of its calories from fat (D12492; Research Diets) for 6 or 12 weeks. The mice were anesthetized using sevoflurane, and tissues were excised and weighed. The epididymal adipose tissue was immediately frozen at −80 °C until experimental use.
Metabolic analyses
In the intraperitoneal glucose tolerance test (ipGTT), mice were subjected to a 16-h fast and then injected with glucose (1 mg/g body weight) intraperitoneally. In the intraperitoneal insulin tolerance test (ipITT), mice were injected intraperitoneally with 0.7 U/kg body weight (HFD-fed mice) human insulin after a 4-h fast. Blood samples were collected from the tail vein. The blood glucose levels were measured using STAT STRIP Express 900 (Nova Biomedical). The serum insulin levels were determined using the Mouse Insulin ELISA Kit (Morinaga Institute of Biological Science, Inc.).
RNA extraction and quantitative real-time PCR
Total RNA was extracted from the epididymal adipose tissue and BMDMs using the RNeasy Mini kit (Qiagen) and ISOGEN (Nippon Gene), respectively. Quantitative RT-PCR was performed as previously described [22, 39].
Immunoprecipitation and immunoblotting
Immunoblotting of mouse tissues was performed as described previously [39]. Briefly, the epididymal adipose tissue and other tissues were excised and homogenized in lysis buffer using a Multi-Beads Shocker (Yasui-kikai). The antibodies against SIRT1 (1:2000, Millipore) and β-actin (1:2000, Cell Signaling) were commercially available. Cultured cells were harvested in RIPA buffer after a 4-h hypoxic treatment with 1 μM MG132 (Enzo Life Sciences). For immunoprecipitation, the lysates were incubated with antiacetylated lysine antibody (1:100, Cell Signaling) or rabbit mAb IgG Isotype Control (1:100, Cell Signaling) overnight at 4 °C. Immunoblotting was performed using anti-HIF-1α antibody (2 μg/ml; R&D Systems) and anti-β-actin antibody (1:1000, Cell Signaling).
Immunohistochemistry of epididymal adipose tissue
After deparaffinization of the paraffin-embedded epididymal adipose tissue sections, microwave heating with target retrieval solution (TRS, Dako) was performed for antigen retrieval. Immunohistostaining of epididymal adipose tissue for F4/80 (rat monoclonal antibody, 1:100; AbD Serotec) was performed as previously described [11]. The Histofine-peroxidase kit for rats (Nichirei) was applied as a secondary antibody. 3,3′-Diaminobenzidine was used as the substrate for the peroxidase. For pimonidazole staining, FITC-conjugated mouse monoclonal anti-pimonidazole antibody (1:100, Hypoxyprobe) was applied. Samples were then incubated with alkaline-phosphatase-conjugated antibody against FITC. Fast red (Vector Laboratories) was used as the substrate for the alkaline phosphatase. Specimens were analyzed and photographed using a High Standard All-in-One Fluorescence Microscope (Biorevo BZ-9000; Keyence Japan), and the pimonidazole-positive area was measured using Hybrid Cell Count BZ-H2C software (Keyence).
Flow cytometry analysis
Epididymal adipose tissues were excised and isolated from the mice at 30 min after the intraperitoneal injection of pimonidazole (60 mg/kg body weight). Flow cytometry was performed as described previously [22]. Cells in the stromal-vascular fraction (SVF) were incubated with 2.4G2 (BD Biosciences), followed by the primary antibodies or matching control isotypes. A rat CD45 antibody conjugated with PE-Cy7 (eBioscience), a rat F4/80 antibody conjugated with APC-Cy7 (Bio Legend), a hamster CD11c antibody conjugated with phycoerythrin (BD Biosciences), a rat CD206 antibody conjugated with Alexa Fluor 647 (AbD-Serotec) and 7-amino-actinomycin D (BD Biosciences) were used as the primary antibodies. The cells were permeabilized and incubated with a pimonidazole antibody conjugated with FITC. The cells were analyzed using a FACSCantoII or a FACSAriaII (BD Biosciences). The data analysis was performed using FlowJo (Tree Star).
Culture of bone marrow-derived macrophages
Bone marrow-derived macrophages were prepared as described previously [22] and used after 6 days of cell culture. For the hypoxic treatment, the cells were incubated in a hypoxic chamber (CO2 Incubator 9000EX; Wakenyaku Co.) with 1 % O2, 5 % CO2 and 94 % N2 at 37 °C.
Statistical analysis
The statistical analysis was performed using Student's t test for the comparison of two groups, a two-factor ANOVA and post Tukey-Kramer test for four groups, or a two-factor factorial ANOVA for ipGTT and ipITT. Quantification in immunoblotting was performed using NIH ImageJ software. Differences were considered statistically significant at P < 0.05. The results were presented as the mean ± SEM.
Results
Myeloid cell-specific SIRT1 deletion impairs glucose tolerance without affecting body weight and food intake in high-fat-fed mice
Myeloid cell-specific SIRT1-knocked out mice (Mye-SIRT1 KO mice) and littermate control mice (Sirt1 flox/flox) were fed a normal chow diet (NC) or a high-fat diet (HFD), thereby producing four groups: i.e., control-NC, KO-NC, control-HFD and KO-HFD. These mice were analyzed after 6 weeks of diet treatment. The myeloid cell-specific SIRT1 deletion did not affect body weight, epididymal adipose tissue weight, or the amount of food intake in either the NC-fed or HFD-fed group (Fig. 1c, d, e).
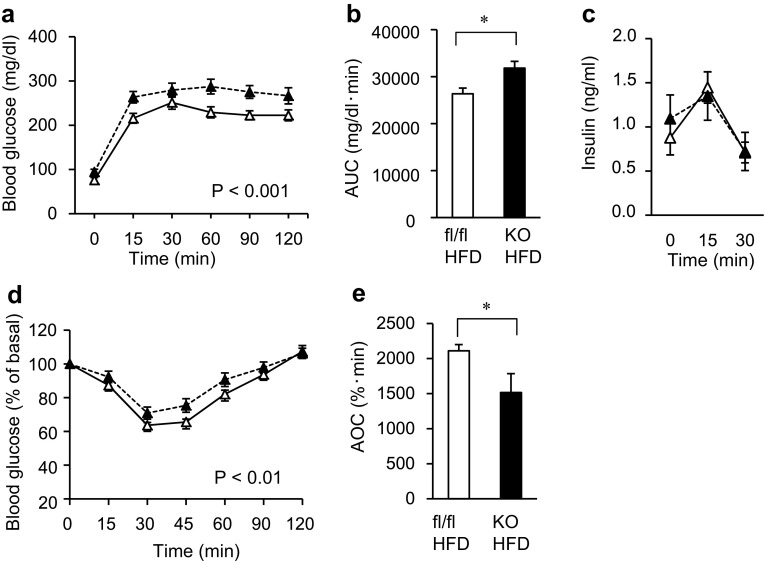
To evaluate glucose tolerance in the mice, we performed an intraperitoneal glucose tolerance test (ipGTT) and intraperitoneal insulin tolerance test (ipITT). In the mice treated with HFD, the glucose concentrations in both the ipGTT and ipITT were significantly higher in the Mye-SIRT1 KO mice than in the control mice when the values were statistically analyzed by two-factor factorial ANOVA (Fig. 2a, b, d, e). The insulin concentrations in the ipGTT were almost comparable in the control and Mye-SIRT1 KO mice (Fig. 2c). In contrast, among the NC groups, the glucose concentration in the ipGTT and ipITT was not significantly higher in the Mye-SIRT1 KO mice than in the control mice (Supplemental Fig. 2a, b). These results suggested that myeloid cell-specific Sirt1 gene deletion impaired glucose tolerance and caused insulin resistance after HFD treatment, with no significant changes in body weight.
Fig. 2.
Myeloid cell-specific SIRT1 deletion impairs glucose tolerance and insulin sensitivity in high-fat-fed mice. a, b Glucose concentration (a) and area under the curve of glucose concentration (b) in intraperitoneal glucose tolerance tests (ipGTT) for KO mice (n = 10) and control mice (n = 12). c Insulin concentration in ipGTT (n = 5). d, e Glucose levels shown as % of basal value (d) and area over the curve of glucose levels (e) in intraperitoneal insulin tolerance tests (ipITT) for KO mice (n = 10) and control mice (n = 12). All experiments were performed after 6 weeks of HFD treatment. White triangles = fl/fl on HFD; black triangles = KO on HFD (a, c, d). Data are shown as the mean ± SEM; *P < 0.05
Myeloid cell-specific SIRT1 deletion increases inflammation-related genes in epididymal adipose tissue and M1 ATMs
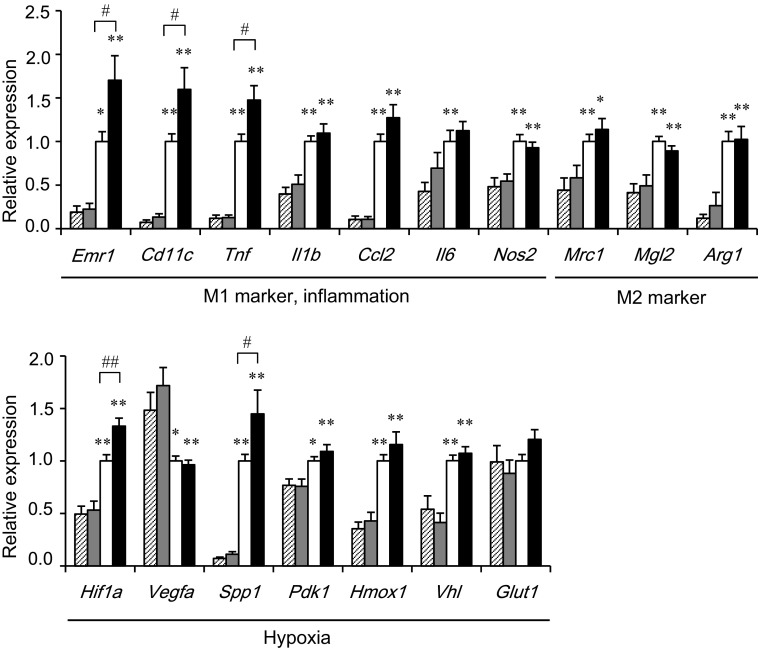
To clarify the mechanisms of insulin resistance in Mye-SIRT1 KO mice treated with the HFD, we examined the gene expressions in epididymal adipose tissues of the mice (Fig. 3). After HFD treatment, the Mye-SIRT1 KO mice displayed an enhanced expression of Emr1 (F4/80), a pan-marker for macrophages, and several M1 ATM markers, including Cd11c, Tnf and Il1b as well as some hypoxia-related genes, such as Hif1a and Spp1. In contrast, SIRT1 deletion did not affect the expression of these genes significantly in epididymal adipose tissue from NC-fed mice. Gene expressions associated with M2 ATMs, such as Mrc1 (CD206), Mgl2 and Arg1, were not affected by the myeloid cell-specific SIRT1 deletion in either NC- or HFD-fed mice (Fig. 3).
Fig. 3.
Myeloid cell-specific SIRT1 deletion increases inflammation and hypoxia-related genes in epididymal adipose tissue. Gene expressions in epididymal fat tissues in mice fed HFD or NC for 6 weeks. Values were normalized according to those for control HFD-fed mice (n = 23–37). Striped bars = fl/fl on NC; shaded bars = KO on NC; white bars for fl/fl on HFD; black bars = KO on HFD. Data are expressed as the mean ± SEM. *P < 0.05; **P < 0.01 vs. NC. # P < 0.05; ## P < 0.01 vs. fl/fl
Myeloid cell-specific SIRT1 deletion increases more hypoxic and inflammatory M1 ATMs in epididymal adipose tissue
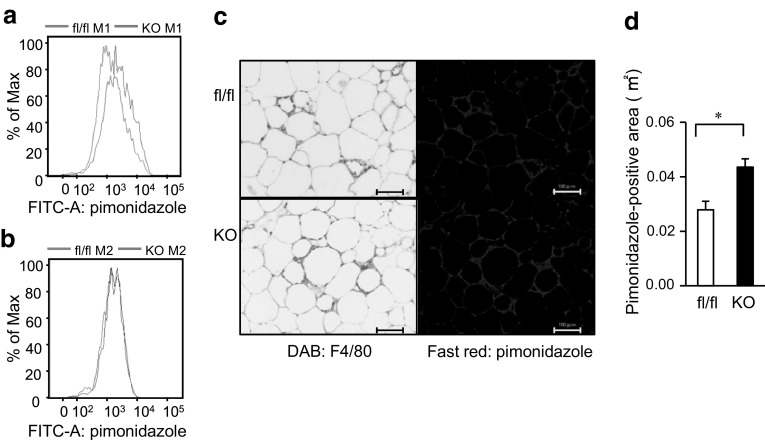
To further clarify the relationship between the SIRT1 deletion and hypoxia in ATMs, we injected pimonidazole, which is known to accumulate intracellularly at tissue oxygen levels <10 mmHg, into the mice and performed a flow cytometry analysis of M1 and M2 ATMs from epididymal adipose tissues as we recently reported [22]. We found that pimonidazole uptake into M1 ATMs was higher in the Mye-SIRT1 KO mice than in the control mice (Fig. 4a), while pimonidazole uptake into the M2 ATMs was not affected by the SIRT1 deletion (Fig. 4b). Immunostaining of the epididymal adipose tissues revealed that the pimonidazole-positive area in the epididymal adipose tissues was larger in Mye-SIRT1 KO mice than in the control mice (Fig. 4c, d). As shown in Fig. 4c, strong staining of pimonidazole was observed in the crown-like structures (CLSs), which reportedly consisted of M1 ATMs [11]. These results suggest that SIRT1 deletion increases the hypoxic area where M1 ATMs accumulate.
Fig. 4.
Myeloid cell-specific SIRT1 deletion increases pimonidazole uptake into M1 ATMs in epididymal adipose tissue of high-fat-fed mice. a, b Pimonidazole uptake into M1 (a) and M2 (b) ATMs. ATMs in epididymal adipose tissue of control mice (blue line) and Mye-SIRT1 KO mice (red line) fed a high-fat diet for 6 weeks were analyzed using flow cytometry. The representative results of four independent experiments are shown. c Staining with anti-F4/80 antibody (left panels) and immunostaining with anti-pimonidazole antibody (right panels) of epididymal fat tissues of mice fed a high-fat diet for 6 weeks. Scale bars indicate 100 μm. d Pimonidazole-positive area in epididymal adipose tissues of fl/fl (white bar) and KO mice (black bar). Data are shown as the mean ± SEM. *P < 0.01
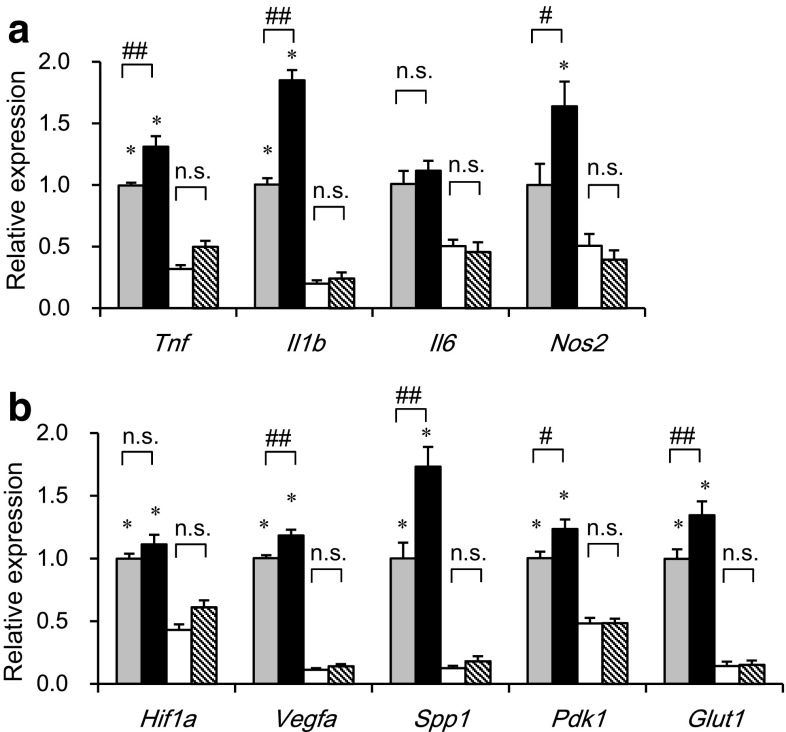
We next examined the effects of myeloid cell-specific SIRT1 deletion on gene expression separately in M1 and M2 ATMs, which were sorted by flow cytometry from epididymal adipose tissue of Mye-SIRT1 KO mice and control mice. Thus, we were able to examine the gene expression in M1 and M2 ATMs on a per cell basis. SIRT1 deletion enhanced the expression of inflammatory genes, such as Tnf, Il1b and Nos2, only in M1 ATMs, but not in M2 ATMs (Fig. 5a). As we recently reported [22], the expressions of hypoxia-related genes, such as Vegfa, Spp1, Pdk1 and Glut1, were higher in M1 ATMs than in M2 ATMs. SIRT1 deletion further enhanced such hypoxia-related genes only in M1 ATMs, but not in M2 ATMs (Fig. 5b). These results indicate that M1 ATMs of Mye-SIRT1 KO mice show a more hypoxic and inflammatory phenotype than those of control mice.
Fig. 5.
Myeloid cell-specific SIRT1 deletion increases inflammation-related genes in M1 ATMs. Expression of inflammation-related genes (a) and hypoxia-related genes (b) in M1 and M2 ATMs from mice fed an HFD for 6 weeks. Values were normalized according to those for M1 ATMs from control mice (n = 11–22). Dotted bars M1 ATMs from fl/fl mice; black bars M1 ATMs from KO mice; white bars M2 ATMs from fl/fl mice; striped bars M2 ATMs from KO mice. Data were expressed as the mean ± SEM. *P < 0.05; **P < 0.01 vs. M2 ATMs; # P < 0.05; ## P < 0.01 vs. fl/fl, n.s., not significant
SIRT1 deletion enhances the inflammatory response and acetylation of HIF-1α in bone marrow-derived macrophages under hypoxic conditions
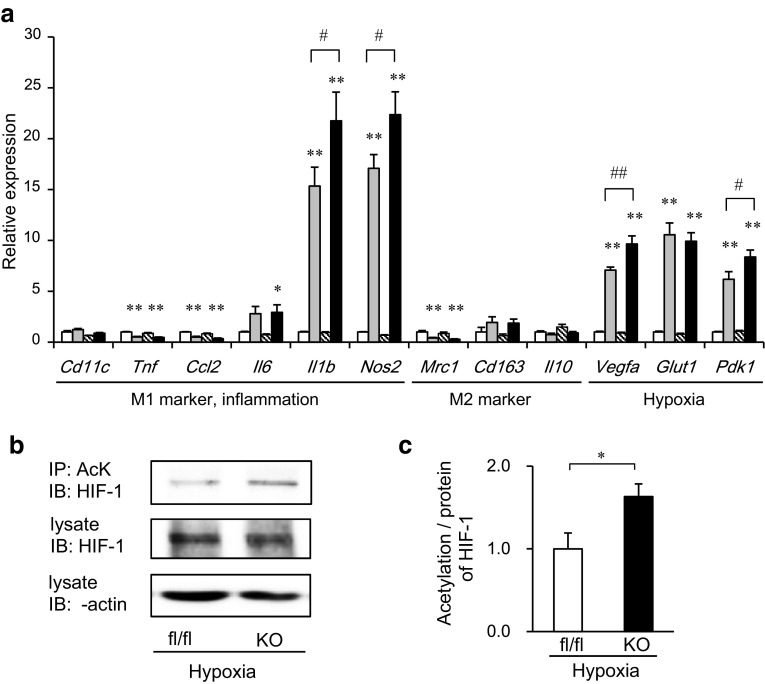
We presumed that hypoxia might affect the inflammatory characteristics of SIRT1-deleted macrophages. Thus, we performed in vitro experiments using bone marrow-derived macrophages (BMDMs). After the hypoxia treatment, BMDMs displayed the enhanced expression of inflammatory genes including Il1b and Nos2, which are known as M1 ATM markers, as well as hypoxia-related genes such as Vegfa, Glut1 and Pdk1 (Fig. 6a). Of note, the expression of some M1 marker genes, such as Tnf and Ccl2 (MCP-1), was not enhanced by the same hypoxia treatment, suggesting that the expressions of some M1 marker genes were able to be induced via hypoxia, while others were not, as we recently reported [22]. SIRT1 deletion further enhanced the hypoxia-dependent inflammatory genes, including Il1b and Nos2, as well as Vegfa, and Pdk1. In contrast, the expressions of hypoxia-independent inflammatory genes, including Tnf and Ccl2 and M2 marker genes were not affected by the SIRT1 deletion (Fig. 6a).
Fig. 6.
Myeloid cell-specific SIRT1 deletion enhances the inflammatory response and acetylation of HIF-1α in bone marrow-derived macrophages (BMDMs) under hypoxic conditions. BMDMs from fl/fl and KO mice were incubated in a normoxic or 1 % hypoxic chamber for 24 h (a; n = 6–13) or for 4 h (b, c; n = 4). a Gene expressions in BMDMs. Values were normalized according to those of fl/fl under normoxia. White bars fl/fl in normoxia; dotted bars fl/fl in hypoxia; striped bars KO in normoxia; black bars KO in hypoxia. Data are expressed as the mean ± SEM. *P < 0.05; **P < 0.01 vs. normoxia. # P < 0.05; ## P < 0.01 vs. fl/fl. b, c Immunoprecipitation and immunoblotting were performed using the indicated antibodies. The intensities of the bands were quantified and shown as the mean ± SEM. *P < 0.05
From the results in Fig. 6a, we hypothesized that SIRT1 might negatively regulate HIF-1α activity, thus inhibiting the inflammatory response in macrophages. To address this hypothesis, we examined the acetylation of HIF-1α, which was reported to be necessary for its transcriptional activation [27] in BMDMs. We found that the acetylation/protein ratio of HIF-1α was higher in SIRT1-deleted cells than in control cells under hypoxic conditions in the presence of a proteasomal inhibitor (Fig. 6b, c). These results suggest that SIRT1 may inhibit the acetylation of HIF-1α, thereby inhibiting its transcriptional activity in BMDMs.
Discussion
We recently reported that inflammatory M1 ATMs were more hypoxic than antiinflammatory M2 ATMs and that the inflammatory responses in macrophages were enhanced via a hypoxia-dependent or -independent mechanism [22]. In this study, we found that M1 ATMs derived from Mye-SIRT1 KO mice showed more hypoxic and inflammatory phenotypes (Figs. 4, 5) than those from control mice. HIF-1α is a well-known transcriptional factor that can be activated by hypoxia [46, 47]. A hypoxia-responsive element (HRE) is located in the promoter region of Il1b. In our in vitro study, SIRT1 deletion further elevated the expressions of only the hypoxia-responsive genes, including Il1b and Nos2, among the inflammation-related genes as well as some HIF-1α target genes, such as Vegfa and Pdk1 (Fig. 6a). Furthermore, the acetylation of HIF-1α in SIRT1-deleted macrophages was higher than in control cells after hypoxic stimuli (Fig. 6b, c). Because we could not find a negative regulation of NFκB by SIRT1 deletion at least in our current study, we suggest that a candidate for SIRT1’s target is HIF-1α, the activation of which mediates the inflammatory response to hypoxia. Thus, SIRT1 may selectively suppress the hypoxia-dependent inflammatory process in ATMs, thereby improving insulin resistance in HFD-fed mice.
In this study, we have shown that myeloid cell-specific SIRT1 deletion impairs glucose metabolism and insulin resistance in mice fed a high-fat diet for 6 weeks by analyzing an independently generated mouse model. Recently, Schug’s group also examined glucose metabolism in myeloid cell-specific SIRT1 deletion mice [35]. Their mice exhibited impaired glucose metabolism with a significantly increased body weight compared with control mice after high-fat treatment. Thus, they could not distinguish the direct effect of myeloid cell-specific SIRT1 deletion on glucose metabolism from the indirect effect of body weight gain. In contrast, our Mye-SIRT1 KO mice did not show any difference in body weight compared with control mice fed either an NC or HFD (Fig. 1b). The reasons for the different effects of SIRT1 deletion on body weight changes are not known, but we speculate that they may be as follows. Our mice had the Cre-loxP-mediated deletion in exon 3 of the SIRT1 coding region. The resulting frame-shift mutation led to the complete loss of SIRT1 protein without the expression of any truncated form of the SIRT1 protein, unlike the situation in Schug’s mice. In addition, our Mye-SIRT1 KO mice were generated from C57BL/6-derived embryonic stem (ES) cells, while Schug’s mice had a mixed genetic background. The report from Schug’s group may still have the value of showing the effects of myeloid SIRT1 deletion on both body weight gain and glucose metabolism. However, the direct effects of myeloid SIRT1 deletion on insulin sensitivity and adipose tissue inflammation independent of body weight changes can be clarified only from our mouse model.
Recently, chronic inflammation has been recognized as a fundamental pathology for many metabolic diseases, including type 2 diabetes mellitus. However, chronic inflammation has not been a good therapeutic target for such metabolic diseases. In this study, we have shown that myeloid cell SIRT1 protects against the formation of more hypoxic M1 ATMs and adipose tissue inflammation during adipose tissue expansion, thus contributing to the improvement of insulin resistance. These data may provide a new concept for the development of therapeutic strategies for metabolic diseases involving the activation of SIRT1 in macrophages.
Electronic supplementary material
Below is the link to the electronic supplementary material.
Acknowledgments
This work was supported by Grants-in-Aid for Scientific Research from the Ministry of Education, Science, Sports, and Culture, Japan (18209033 and 21591126 to K.T., 21790867 to Y.K., 22590971 and 50377272 to I.U. and 30512082 to S.F.). We thank Ms. Kana Sugihara and Dr. Qun Zhang for their excellent technical assistance. We also thank Dr. Hikari Suzuki and Dr. Yu Kato for their useful discussions.
Conflict of interest
The authors have no conflict of interest related to the current study.
Ethical standard
All institutional and national guidelines for the care and use of laboratory animals were followed.
Contributor Information
Isao Usui, Phone: +81-76-434-7287, Email: isaousui-tym@umin.ac.jp.
Kazuyuki Tobe, Email: tobe@med.u-toyama.ac.jp.
References
- 1.Gregor MF, Hotamisligil GS. Inflammatory mechanisms in obesity. Annu Rev Immunol. 2011;29:415–445. doi: 10.1146/annurev-immunol-031210-101322. [DOI] [PubMed] [Google Scholar]
- 2.Shoelson SE, Herrero L, Naaz A. Obesity, inflammation, and insulin resistance. Gastroenterology. 2007;132(6):2169–2180. doi: 10.1053/j.gastro.2007.03.059. [DOI] [PubMed] [Google Scholar]
- 3.Winer S, et al. Normalization of obesity-associated insulin resistance through immunotherapy. Nat Med. 2009;15(8):921–929. doi: 10.1038/nm.2001. [DOI] [PMC free article] [PubMed] [Google Scholar]
- 4.Elgazar-Carmon V, et al. Neutrophils transiently infiltrate intra-abdominal fat early in the course of high-fat feeding. J Lipid Res. 2008;49(9):1894–1903. doi: 10.1194/jlr.M800132-JLR200. [DOI] [PubMed] [Google Scholar]
- 5.Weisberg SP, et al. CCR2 modulates inflammatory and metabolic effects of high-fat feeding. J Clin Invest. 2006;116(1):115–124. doi: 10.1172/JCI24335. [DOI] [PMC free article] [PubMed] [Google Scholar]
- 6.Weisberg SP, et al. Obesity is associated with macrophage accumulation in adipose tissue. J Clin Invest. 2003;112(12):1796–1808. doi: 10.1172/JCI200319246. [DOI] [PMC free article] [PubMed] [Google Scholar]
- 7.Xu H, et al. Chronic inflammation in fat plays a crucial role in the development of obesity-related insulin resistance. J Clin Invest. 2003;112(12):1821–1830. doi: 10.1172/JCI200319451. [DOI] [PMC free article] [PubMed] [Google Scholar]
- 8.Martinez FO, Helming L, Gordon S. Alternative activation of macrophages: an immunologic functional perspective. Annu Rev Immunol. 2009;27:451–483. doi: 10.1146/annurev.immunol.021908.132532. [DOI] [PubMed] [Google Scholar]
- 9.Mosser DM, Edwards JP. Exploring the full spectrum of macrophage activation. Nat Rev Immunol. 2008;8(12):958–969. doi: 10.1038/nri2448. [DOI] [PMC free article] [PubMed] [Google Scholar]
- 10.Lumeng CN, Bodzin JL, Saltiel AR. Obesity induces a phenotypic switch in adipose tissue macrophage polarization. J Clin Invest. 2007;117(1):175–184. doi: 10.1172/JCI29881. [DOI] [PMC free article] [PubMed] [Google Scholar]
- 11.Fujisaka S, et al. Regulatory mechanisms for adipose tissue M1 and M2 macrophages in diet-induced obese mice. Diabetes. 2009;58(11):2574–2582. doi: 10.2337/db08-1475. [DOI] [PMC free article] [PubMed] [Google Scholar]
- 12.Lumeng CN, et al. Phenotypic switching of adipose tissue macrophages with obesity is generated by spatiotemporal differences in macrophage subtypes. Diabetes. 2008;57(12):3239–3246. doi: 10.2337/db08-0872. [DOI] [PMC free article] [PubMed] [Google Scholar]
- 13.Shaul ME, et al. Dynamic, M2-like remodeling phenotypes of CD11c + adipose tissue macrophages during high-fat diet–induced obesity in mice. Diabetes. 2010;59(5):1171–1181. doi: 10.2337/db09-1402. [DOI] [PMC free article] [PubMed] [Google Scholar]
- 14.Hosogai N, et al. Adipose tissue hypoxia in obesity and its impact on adipocytokine dysregulation. Diabetes. 2007;56(4):901–911. doi: 10.2337/db06-0911. [DOI] [PubMed] [Google Scholar]
- 15.Rausch ME, et al. Obesity in C57BL/6J mice is characterized by adipose tissue hypoxia and cytotoxic T-cell infiltration. Int J Obes (Lond) 2008;32(3):451–463. doi: 10.1038/sj.ijo.0803744. [DOI] [PubMed] [Google Scholar]
- 16.Ye J, et al. Hypoxia is a potential risk factor for chronic inflammation and adiponectin reduction in adipose tissue of ob/ob and dietary obese mice. Am J Physiol Endocrinol Metab. 2007;293(4):E1118–E1128. doi: 10.1152/ajpendo.00435.2007. [DOI] [PubMed] [Google Scholar]
- 17.Halberg N, et al. Hypoxia-inducible factor 1alpha induces fibrosis and insulin resistance in white adipose tissue. Mol Cell Biol. 2009;29(16):4467–4483. doi: 10.1128/MCB.00192-09. [DOI] [PMC free article] [PubMed] [Google Scholar]
- 18.Cummins EP, et al. Prolyl hydroxylase-1 negatively regulates IkappaB kinase-beta, giving insight into hypoxia-induced NFkappaB activity. Proc Natl Acad Sci USA. 2006;103(48):18154–18159. doi: 10.1073/pnas.0602235103. [DOI] [PMC free article] [PubMed] [Google Scholar]
- 19.Rius J, et al. NF-kappaB links innate immunity to the hypoxic response through transcriptional regulation of HIF-1alpha. Nature. 2008;453(7196):807–811. doi: 10.1038/nature06905. [DOI] [PMC free article] [PubMed] [Google Scholar]
- 20.Tannahill GM, et al. Succinate is an inflammatory signal that induces IL-1beta through HIF-1alpha. Nature. 2013;496(7444):238–242. doi: 10.1038/nature11986. [DOI] [PMC free article] [PubMed] [Google Scholar]
- 21.Ye J. Adipose tissue vascularization: its role in chronic inflammation. Curr Diab Rep. 2011;11(3):203–210. doi: 10.1007/s11892-011-0183-1. [DOI] [PMC free article] [PubMed] [Google Scholar]
- 22.Fujisaka S, et al. Adipose tissue hypoxia induces inflammatory M1 polarity of macrophages in an HIF-1alpha-dependent and HIF-1alpha-independent manner in obese mice. Diabetologia. 2013;56(6):1403–1412. doi: 10.1007/s00125-013-2885-1. [DOI] [PubMed] [Google Scholar]
- 23.Imai S, et al. Transcriptional silencing and longevity protein Sir2 is an NAD-dependent histone deacetylase. Nature. 2000;403(6771):795–800. doi: 10.1038/35001622. [DOI] [PubMed] [Google Scholar]
- 24.Luo J, et al. Negative control of p53 by Sir2alpha promotes cell survival under stress. Cell. 2001;107(2):137–148. doi: 10.1016/S0092-8674(01)00524-4. [DOI] [PubMed] [Google Scholar]
- 25.Yeung F, et al. Modulation of NF-kappaB-dependent transcription and cell survival by the SIRT1 deacetylase. EMBO J. 2004;23(12):2369–2380. doi: 10.1038/sj.emboj.7600244. [DOI] [PMC free article] [PubMed] [Google Scholar]
- 26.Rodgers JT, et al. Nutrient control of glucose homeostasis through a complex of PGC-1alpha and SIRT1. Nature. 2005;434(7029):113–118. doi: 10.1038/nature03354. [DOI] [PubMed] [Google Scholar]
- 27.Lim JH, et al. Sirtuin 1 modulates cellular responses to hypoxia by deacetylating hypoxia-inducible factor 1alpha. Mol Cell. 2010;38(6):864–878. doi: 10.1016/j.molcel.2010.05.023. [DOI] [PubMed] [Google Scholar]
- 28.Baur JA, et al. Resveratrol improves health and survival of mice on a high-calorie diet. Nature. 2006;444(7117):337–342. doi: 10.1038/nature05354. [DOI] [PMC free article] [PubMed] [Google Scholar]
- 29.Gerhart-Hines Z, et al. Metabolic control of muscle mitochondrial function and fatty acid oxidation through SIRT1/PGC-1alpha. EMBO J. 2007;26(7):1913–1923. doi: 10.1038/sj.emboj.7601633. [DOI] [PMC free article] [PubMed] [Google Scholar]
- 30.Zhong L, Mostoslavsky R. Fine tuning our cellular factories: sirtuins in mitochondrial biology. Cell Metab. 2011;13(6):621–626. doi: 10.1016/j.cmet.2011.05.004. [DOI] [PMC free article] [PubMed] [Google Scholar]
- 31.Purushotham A, et al. Hepatocyte-specific deletion of SIRT1 alters fatty acid metabolism and results in hepatic steatosis and inflammation. Cell Metab. 2009;9(4):327–338. doi: 10.1016/j.cmet.2009.02.006. [DOI] [PMC free article] [PubMed] [Google Scholar]
- 32.Wang RH, et al. Hepatic Sirt1 deficiency in mice impairs mTorc2/Akt signaling and results in hyperglycemia, oxidative damage, and insulin resistance. J Clin Invest. 2011;121(11):4477–4490. doi: 10.1172/JCI46243. [DOI] [PMC free article] [PubMed] [Google Scholar]
- 33.Schenk S, et al. Sirt1 enhances skeletal muscle insulin sensitivity in mice during caloric restriction. J Clin Invest. 2011;121(11):4281–4288. doi: 10.1172/JCI58554. [DOI] [PMC free article] [PubMed] [Google Scholar]
- 34.Pfluger PT, et al. Sirt1 protects against high-fat diet-induced metabolic damage. Proc Natl Acad Sci USA. 2008;105(28):9793–9798. doi: 10.1073/pnas.0802917105. [DOI] [PMC free article] [PubMed] [Google Scholar]
- 35.Schug TT, et al. Myeloid deletion of SIRT1 induces inflammatory signaling in response to environmental stress. Mol Cell Biol. 2010;30(19):4712–4721. doi: 10.1128/MCB.00657-10. [DOI] [PMC free article] [PubMed] [Google Scholar]
- 36.Lagouge M, et al. Resveratrol improves mitochondrial function and protects against metabolic disease by activating SIRT1 and PGC-1alpha. Cell. 2006;127(6):1109–1122. doi: 10.1016/j.cell.2006.11.013. [DOI] [PubMed] [Google Scholar]
- 37.Milne JC, et al. Small molecule activators of SIRT1 as therapeutics for the treatment of type 2 diabetes. Nature. 2007;450(7170):712–716. doi: 10.1038/nature06261. [DOI] [PMC free article] [PubMed] [Google Scholar]
- 38.Feige JN, et al. Specific SIRT1 activation mimics low energy levels and protects against diet-induced metabolic disorders by enhancing fat oxidation. Cell Metab. 2008;8(5):347–358. doi: 10.1016/j.cmet.2008.08.017. [DOI] [PubMed] [Google Scholar]
- 39.Yamazaki Y, et al. Treatment with SRT1720, a SIRT1 activator, ameliorates fatty liver with reduced expression of lipogenic enzymes in MSG mice. Am J Physiol Endocrinol Metab. 2009;297(5):E1179–E1186. doi: 10.1152/ajpendo.90997.2008. [DOI] [PubMed] [Google Scholar]
- 40.Majmundar AJ, Wong WJ, Simon MC. Hypoxia-inducible factors and the response to hypoxic stress. Mol Cell. 2010;40(2):294–309. doi: 10.1016/j.molcel.2010.09.022. [DOI] [PMC free article] [PubMed] [Google Scholar]
- 41.Dioum EM, et al. Regulation of hypoxia-inducible factor 2alpha signaling by the stress-responsive deacetylase sirtuin 1. Science. 2009;324(5932):1289–1293. doi: 10.1126/science.1169956. [DOI] [PubMed] [Google Scholar]
- 42.Zhong L, et al. The histone deacetylase Sirt6 regulates glucose homeostasis via Hif1alpha. Cell. 2010;140(2):280–293. doi: 10.1016/j.cell.2009.12.041. [DOI] [PMC free article] [PubMed] [Google Scholar]
- 43.Miya K, et al. Serine racemase is predominantly localized in neurons in mouse brain. J Comp Neurol. 2008;510(6):641–654. doi: 10.1002/cne.21822. [DOI] [PubMed] [Google Scholar]
- 44.Kanki H, Suzuki H, Itohara S. High-efficiency CAG-FLPe deleter mice in C57BL/6J background. Exp Anim. 2006;55(2):137–141. doi: 10.1538/expanim.55.137. [DOI] [PubMed] [Google Scholar]
- 45.Clausen BE, et al. Conditional gene targeting in macrophages and granulocytes using LysMcre mice. Transgenic Res. 1999;8(4):265–277. doi: 10.1023/A:1008942828960. [DOI] [PubMed] [Google Scholar]
- 46.Keith B, Johnson RS, Simon MC. HIF1alpha and HIF2alpha: sibling rivalry in hypoxic tumour growth and progression. Nat Rev Cancer. 2012;12(1):9–22. doi: 10.1038/nrc3183. [DOI] [PMC free article] [PubMed] [Google Scholar]
- 47.Wang GL, Semenza GL. General involvement of hypoxia-inducible factor 1 in transcriptional response to hypoxia. Proc Natl Acad Sci USA. 1993;90(9):4304–4308. doi: 10.1073/pnas.90.9.4304. [DOI] [PMC free article] [PubMed] [Google Scholar]
Associated Data
This section collects any data citations, data availability statements, or supplementary materials included in this article.


