Abstract
Background
Ingestion of ethanol before a glucose challenge enhances the insulin response by an unknown mechanism. In addition, epidemiological studies consistently indicate that moderate alcohol consumption reduces the risk of developing type 2 diabetes (T2D). The purposes of this study were to evaluate the potential involvement of glucose-dependent insulinotropic peptide (GIP) and glucagon-like peptide 1 (GLP-1) in alcohol-induced augmentation of the insulin response and to determine if red wine acutely improves glucose tolerance during an oral glucose tolerance test (OGTT).
Methods
Nine subjects (eight T2D and one pre-diabetes) completed two OGTT 30 min after consumption of 263 ml water or red wine (28 g ethanol). Blood samples were obtained for 3 h and analyzed for glucose, insulin, C-peptide, GIP, and GLP-1.
Results
Compared with water, consumption of red wine increased the incremental area under the curve (iAUC) for insulin by 50 % (14,837 ± 4759 vs. 9885 ± 2686 µU/ml × min; p < 0.05) and for GIP by 25 % (7729 ± 1548 vs. 6191 ± 1049 pmol/l × min; p < 0.05). Glucose and GLP-1 responses were not affected by red wine.
Conclusion
Wine consumption before an OGTT augments the insulin response, which may be partially driven by a greater GIP response. Because glucose levels were not reduced, acute wine consumption may not be effective treatment for enhancing glycemic control or may need to be combined with therapy that improves insulin sensitivity.
Keywords: Type 2 diabetes, Incretins, Glucose-dependent insulinotropic peptide, Glucagon-like peptide 1, Insulin, Alcohol
Introduction
Type 2 diabetes (T2D) is characterized by the inability of insulin to stimulate glucose uptake and reduce hepatic glucose production, and by reduced insulin secretion from pancreatic beta cells [1]. In addition, patients with type 2 diabetes often experience reductions in the incretin effect, the postprandial augmentation of insulin secretion by intestinal hormones. The incretin hormones, glucose-dependent insulinotropic peptide (GIP) and glucagon-like peptide 1 (GLP-1), are released from the small intestine by K and L cells, respectively, in response to ingested nutrients. Compared with healthy subjects, GIP secretion is slightly reduced and GLP-1 secretion substantially reduced for T2D patients, for whom sensitivity of pancreatic beta cells to the insulinotropic actions of both GIP and GLP-1 is also reduced [2]. Therefore, the inability of patients with T2D to dispose of orally ingested glucose is related to failure of the incretin hormones to adequately increase insulin secretion [2].
Because lifestyle factors are prominent in the etiology of T2D, efforts to combat the disease have often focused on exercise and dietary intervention [3]. One dietary intervention with plausible preventive or therapeutic potential is consumption of alcoholic beverages. Epidemiological studies have consistently reported that moderate alcohol consumption, defined as 0.5–2 drinks (7–28 g ethanol) per day, is associated with a reduced incidence of T2D [4–7], with wine having a greater effect than liquor [6, 7]. Despite abundant evidence that suggests alcoholic beverages, especially wine, may alter glucose metabolism in a way that enhances glycemic control, a physiological mechanism has not been elucidated. Because the preponderance of evidence indicates that insulin sensitivity of peripheral tissues is unaffected by alcohol after both chronic and acute ingestion [8–12], an alternative mechanism of ethanol’s affect may be an altered hormonal response to ingested glucose. Ethanol itself does not affect basal insulin release, but when given before a glucose challenge alcohol augments insulin secretion [10, 13–18]. Thus, it is possible that regular doses of alcohol act similarly to the sulfonylurea medications commonly used for treatment of T2D. Sulfonylureas stimulate insulin secretion from the pancreas, with the ultimate effect being lower blood glucose levels.
Although few studies have been undertaken to investigate alcohol-induced augmentation of insulin release, on the basis of the above explanation of the incretin effect, GIP and GLP-1 are potential mediators of this phenomenon. Adner and colleagues were able to abolish the alcohol-enhanced insulin response by blocking calcium channels with nifedipine and preventing phospholipid breakdown with indomethacin, but reported no involvement of GLP-1 [15, 17]. In an investigation of the effect of ethanol on postprandial lipemia, Dalgaard et al. [19] reported that alcohol reduced incretin responses to ingestion of a mixed meal, which suggests that neither GLP-1 nor GIP is involved in augmentation of insulin release. However, because of the methods used in these studies, the results are difficult to interpret. First, Adner and colleagues [15, 17] induced pancreatic insulin release by intravenous infusion of glucose, which bypasses the stimulus for GLP-1 secretion. Second, in the study of Dalgaard et al. [19] the mixed meals used for comparison differed in their carbohydrate content, leaving no true control group.
Because there are no available data showing the effects of wine on incretin responses to an oral glucose load, the purposes of this study were:
to evaluate the potential involvement of GIP and GLP-1 in the alcohol-induced augmentation of the insulin response; and
to determine whether red wine acutely affects glycemic control during an oral glucose tolerance test (OGTT) in T2D and insulin resistant subjects.
Methods
Participants
Nine participants (six women and three men) with either T2D (n = 8) or pre-diabetes (n = 1) completed the study. Characteristics of the subjects are listed in Table 1. Participants completed a questionnaire to provide information on medications, amount of exercise, and habitual alcohol consumption. All participants were taking medications for cardiovascular and/or diabetic complications, including metformin (n = 7), ACE inhibitors (n = 6), and statins (n = 6). None of the participants reported an exercise frequency of greater than 4 days per week or more than 30 min per session and four subjects reported no exercise at all. Weekly alcohol consumption was low to moderate, ranging from 0 to 6 drinks per week; seven subjects reported less than one drink per week. All subjects provided informed consent to participate in the study, which was approved by the Institutional Review Board of the University of Missouri.
Table 1.
Participants’ baseline characteristics
| Characteristic | Value |
|---|---|
| Age (years) | 55.6 ± 2.4 |
| Sex (M/F) | 6/3 |
| Weight (kg) | 102.0 ± 6.0 |
| BMI (kg/m2) | 36.2 ± 2.2 |
| HbA1C (%) | 6.4 ± 0.1 |
| HOMA2-IR | 2.75 ± 0.51 |
| Time since diagnosis (years) | 9.1 ± 2.4 |
| Metformin | n = 7 |
| Statins | n = 6 |
| ACE inhibitors | n = 6 |
| Sulfonylureas | n = 2 |
| DPP-IV inhibitors | n = 1 |
Experimental design
The study followed a randomized crossover design, in which each subject completed two different OGTT on separate days. Because each OGTT, subjects consumed 263 ml of either water or red wine (Cabernet Sauvignon Monterey County, Chalone Vineyard, 2009; 13.5 % alcohol; 28 g ethanol). One gram of dextrose was added to the water to match the glucose concentration of the wine (personal communication with Diageo). Thus, the total caloric intake was 200 kcal, with 98 % of calories supplied by ethanol and 2 % by carbohydrates. Thirty minutes after consuming the treatment beverage, subjects consumed 75 g glucose (Azer Scientific, Morgantown, PA, USA) and started an OGTT in which blood samples were taken periodically for 3 h (as discussed in the section “Experimental protocol”).
Each trial was separated by 1–2 weeks and all subjects were asked to refrain from taking their glucose-lowering medications on the morning of the laboratory visit. Participants were also instructed to abstain from alcohol and exercise for 48 h before each OGTT, and to follow a consistent diet for the 24 h before each laboratory session; this was verified by a diet and exercise questionnaire.
Experimental protocol
Subjects reported to the laboratory at approximately 7:00–8:00 AM after an overnight fast. An intravenous catheter was placed in an antecubital vein and a baseline blood sample was taken at time −30 min, after which the subjects consumed either water or wine. After 30 min, another venous blood sample was taken and the OGTT commenced with ingestion of a 75-g glucose drink, which was consumed within 2 min. Subsequent blood samples (~5 ml) were taken every 15 min for 3 h and placed in SST and EDTA tubes supplemented with aprotinin and dipeptidyl peptidase 4 (DPP-4) inhibitor. EDTA tubes were immediately placed on ice whereas SST tubes were left at room temperature for 15 min before centrifugation. Resulting plasma and serum were divided into sub-samples and stored at −80 °C for subsequent analysis of serum glucose, insulin, C-peptide, and plasma GIP and GLP-1 concentrations.
Blood analysis
Baseline blood samples were sent to a commercial laboratory (Boyce and Bynum Pathology Labs, Columbia, MO, USA) for analysis of HbA1c and lipids. Serum samples collected during the OGTT were analyzed for glucose by use of a glucose analyzer (YSI 2700; YSI Life Sciences, Yellow Springs, OH, USA) and insulin and C-peptide by enzyme-linked immunosorbent assays (Immulite 1000; Siemens, Deerfield, IL, USA). GIP and GLP-1 were analyzed by use of enzyme-linked immunosorbent assays (EMD Millipore, Bellerica, MA, USA) specific for total human GIP and GLP-1 peptides.
Calculations and statistical analysis
Incremental AUC (iAUC) values for glucose, insulin, C-peptide, GIP, and GLP-1 were determined for each OGTT by the trapezoid method, in accordance with Wolever [20]. This method of calculation considers only plasma concentrations above baseline; thus, the iAUC is an expression of both the magnitude and duration of the plasma responses, while correcting for baseline values. To evaluate beta cell function, we calculated the ratio of the change in C-peptide to the change in glucose (ΔC-pep/Δglucose) over the duration of each OGTT. Variables for the water and wine OGTT were compared by use of repeated measures ANOVA, with the Sidak correction. Statistical analysis was performed with SPSS software and significance was accepted if p < 0.05. Results are presented as mean ± SE.
Results
Glucose
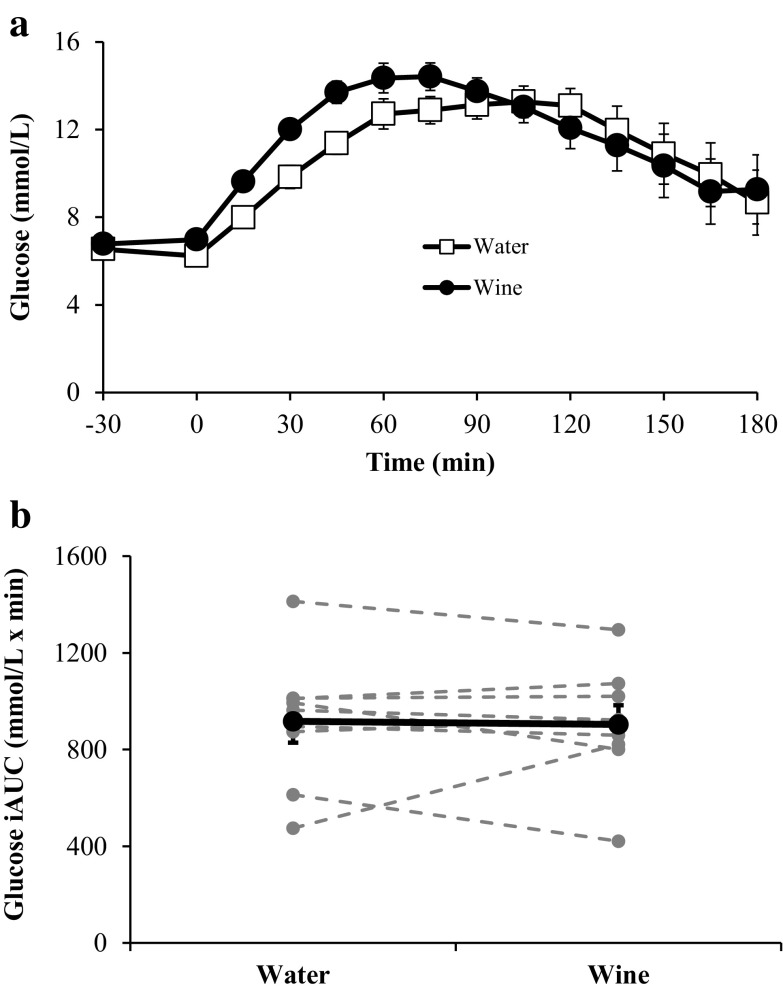
Figure 1 depicts the glucose responses during the OGTT. Whereas there was no difference between glucose concentrations at −30 min in the trials, plasma glucose was lower in the water trial at time 0 (6.2 ± 0.21 vs. 7.0 ± 0.18 mmol/l for water and wine, respectively; p < 0.05). Despite a higher rate of increase in glucose (Δ glucose/Δ time) over the first 45 min after treatment with wine (0.15 ± 0.01 vs. 0.11 ± 0.01 mmol/l/min; p < 0.01), the iAUC was similar in both trials (917 ± 88 vs. 904 ± 79 mmol/l × min for water and wine, respectively; p = 0.82).
Fig. 1.
Serum glucose concentrations before and during each OGTT (a) and the corresponding glucose iAUC values (b). In b, bold markers represent the mean values whereas gray markers represent individual responses. The rate of increase in glucose concentration is significantly greater after treatment with red wine at time points 15–45 min (p < 0.01). Data are expressed as mean ± SE
Insulin and C-peptide
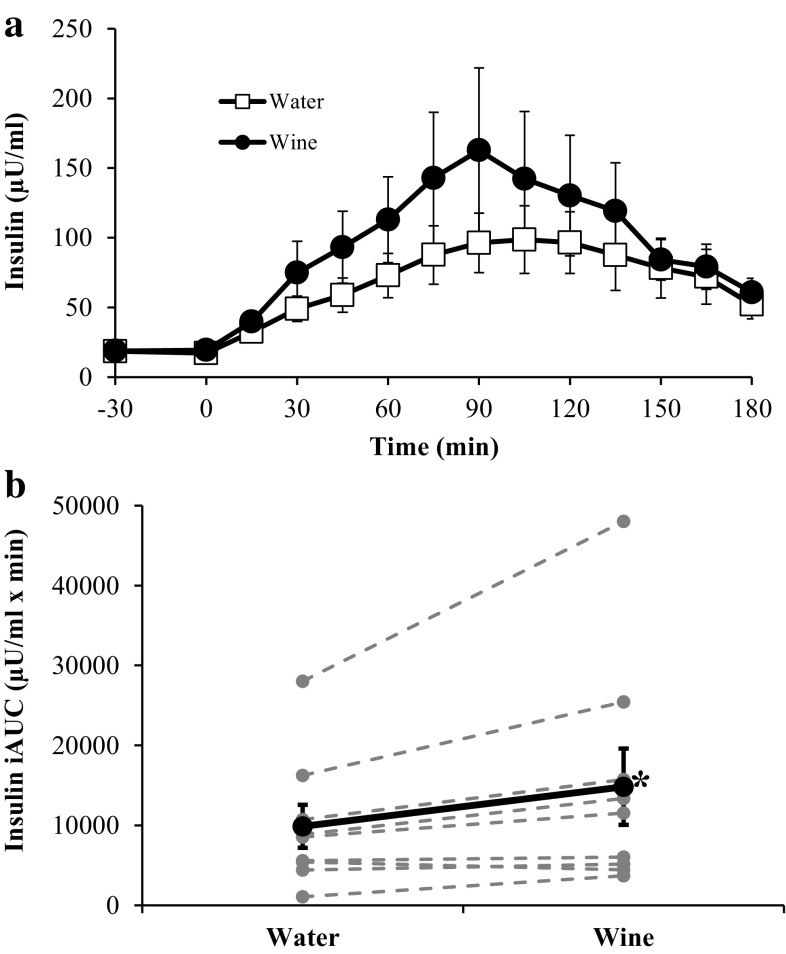
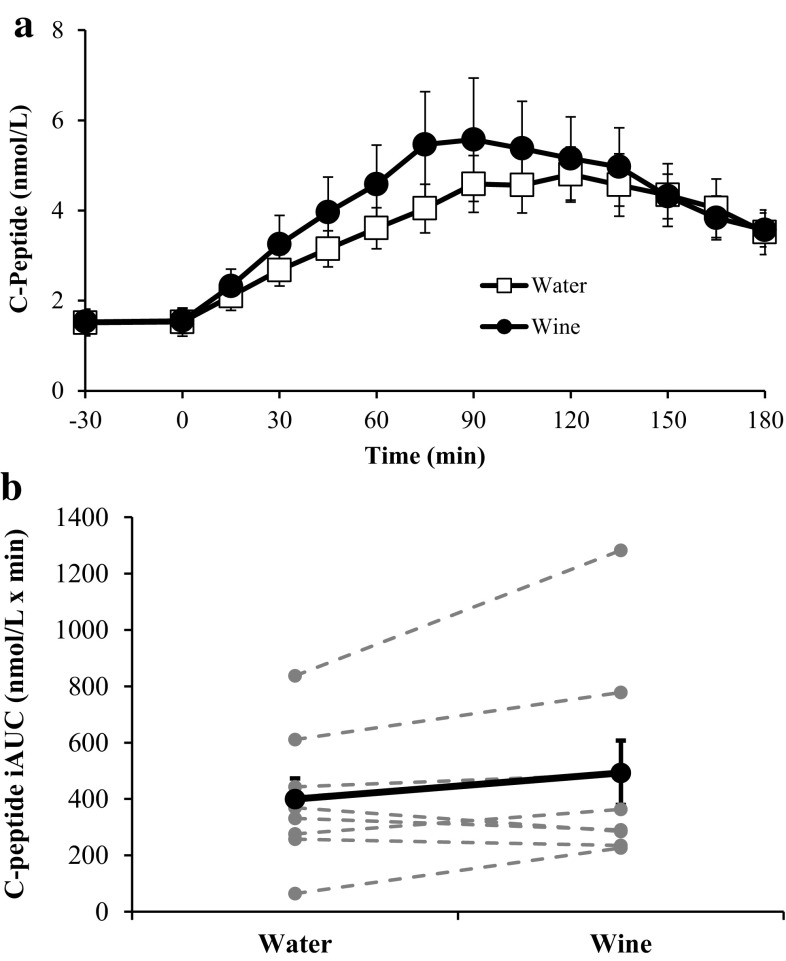
The insulin responses to each OGTT are shown in Fig. 2. Although ingestion of wine or water at −30 min did not induce an insulin response, during the OGTT wine increased integrated insulin responses for eight of the nine subjects, compared with water. The insulin iAUC was 50 % greater after wine than after water (14,837 ± 4759 vs. 9885 ± 2686 µU/ml × min; p < 0.05). C-peptide responses followed similar patterns to those of insulin (Fig. 3). After treatment with wine, C-peptide iAUC was 23 % greater than after water (493 ± 114.4 vs. 400 ± 73.7 nmol/l × min), but this difference did not reach statistical significance (p = 0.11). Although the C-peptide response tended to be higher after ingestion of wine, beta cell function was not altered, because ΔC-pep/Δglucose values were similar at each time point.
Fig. 2.
Serum insulin concentrations before and during each OGTT (a) and the corresponding insulin iAUC values (b). In b, bold markers represent the mean values whereas gray markers represent individual responses. *Insulin iAUC is significantly greater after treatment with red wine (p < 0.05). Data are expressed as mean ± SE
Fig. 3.
Serum C-peptide concentrations before and during each OGTT (a) and the corresponding C-peptide iAUC values (b). In b, bold markers represent the mean values whereas gray markers represent individual responses. Data are expressed as mean ± SE
Incretin hormones
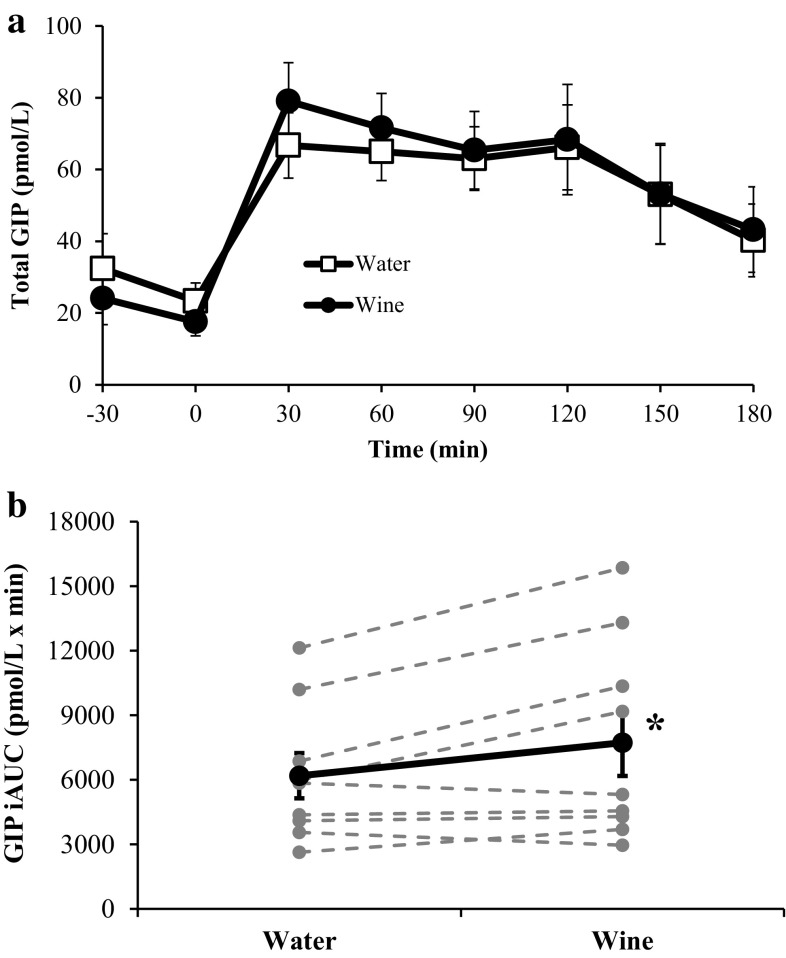
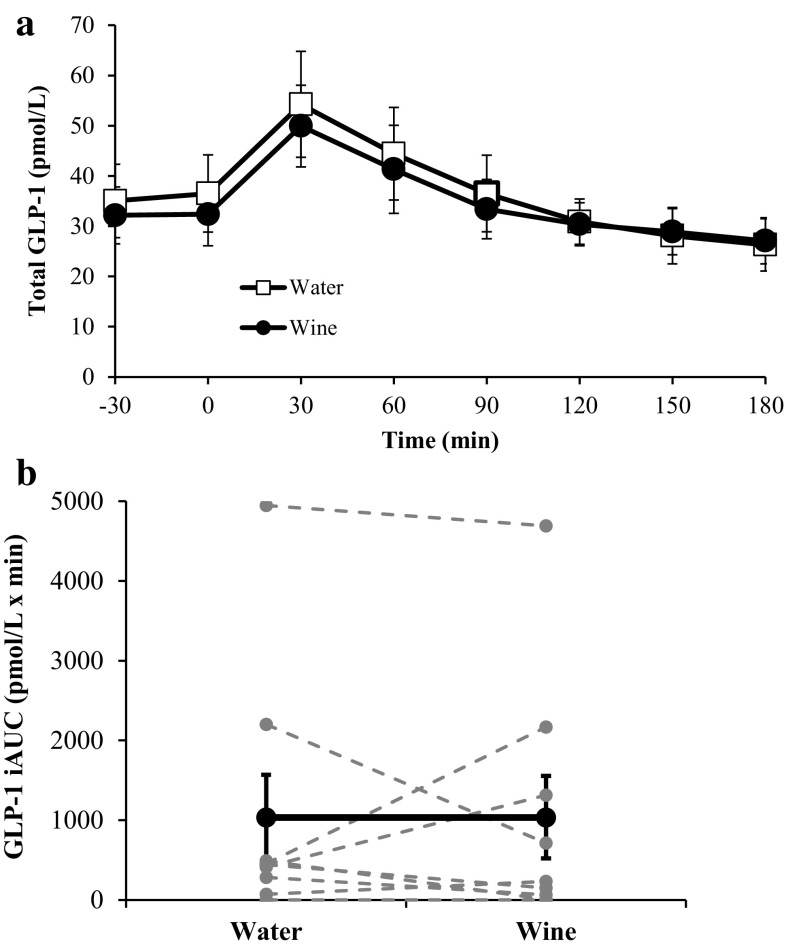
The responses of GIP and GLP-1 are shown in Figs. 4 and 5, respectively. Treatment with wine induced a significant 25 % increase in GIP iAUC (7729 ± 1548 vs. 6191 ± 1049 pmol/l × min; p < 0.05). GLP-1 iAUC was no different in the water and wine trials (1034 ± 535 vs. 1038 ± 518 pmol/l × min; p = 0.99).
Fig. 4.
Plasma GIP concentrations before and during each OGTT (a) and the corresponding GIP iAUC values (b). In b, bold markers represent the mean values whereas gray markers represent individual responses. *GIP iAUC is significantly greater after treatment with red wine (p < 0.05). Data are expressed as mean ± SE
Fig. 5.
Plasma GLP-1 concentrations before and during each OGTT (a) and the corresponding GLP-1 iAUC values (b). In b, bold markers represent the mean values whereas gray markers represent individual responses. Data are expressed as mean ± SE
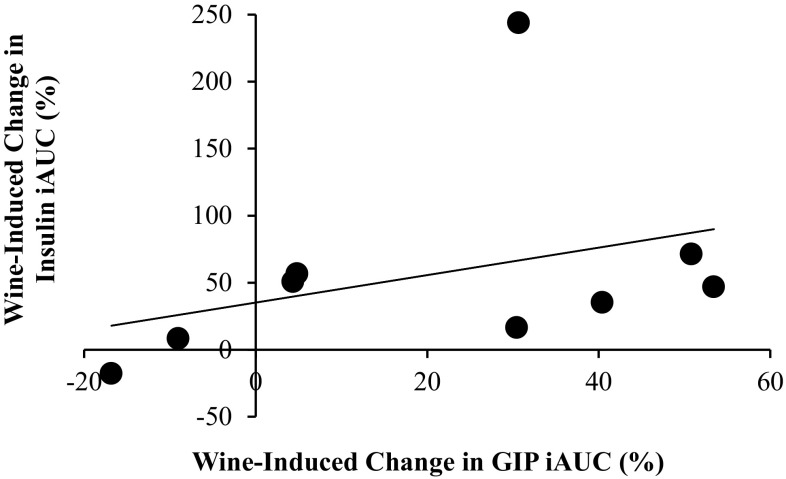
The correlation coefficient between the relative wine-induced changes (%) in GIP iAUC and insulin iAUC was 0.35, which was not statistically significant (p = 0.18). This is depicted in Fig. 6. However, for one subject insulin iAUC after red wine increased an inordinate 3.4-fold compared with the control trial, despite a typical GIP response. If this outlier is removed from the calculation, the correlation coefficient increased to 0.62 and approached statistical significance (p = 0.051).
Fig. 6.
Relationship between wine-induced changes in GIP iAUC and insulin iAUC, expressed as percentage increase. As drawn, the correlation coefficient (r) is 0.35 and r 2 = 0.12. If the outlier is removed from the calculation, r = 0.62 and r 2 = 0.38
Discussion
In this study, we evaluated the acute effect of red wine on hormonal responses to glucose ingestion during OGTT. The novel findings were that red wine enhanced both GIP and insulin responses in T2D. These results suggest that the alcohol-induced augmentation of insulin release may be mediated at least partially by an increase in GIP. However, this is not true for incretins in general, because GLP-1 levels were similar in the two trials. Despite a greater insulin response after ingestion of wine, there was no change in glucose iAUC and, therefore, no enhancement of glycemic control.
Regarding the effect of alcohol on the incretin hormones, our results differ from those of Dalgaard et al. [19]. In that study, participants with T2D consumed a mixed meal with or without ethanol; it was concluded that ethanol reduced both GIP and GLP-1 responses. Unfortunately, the mixed meals used by Dalgaard et al. [19] for comparison of the incretin effect differed in their carbohydrate contents and this lack of a control group complicates interpretation. Also, it is unclear whether participants consumed alcohol before eating their mixed meals or the ethanol and food were consumed simultaneously. On the other hand, our results seem to confirm those of Svartberg et al. [17], who concluded that GLP-1 was not involved in alcohol-induced augmentation of insulin release. However, their use of intravenous glucose tolerance tests is problematic, because GLP-1 release is not stimulated by infused glucose [21]; thus, there can be little meaningful comparison between the current investigation and that of Svartberg et al. [17].
Because both GIP and insulin responses to ingested glucose were enhanced after pretreatment with red wine, it is tempting to infer causality. GIP, with GLP-1, is released from the intestinal mucosa in the presence of ingested nutrients and signals the pancreas to release insulin; these incretin hormones have been shown to account for up to 50-70 % of postprandial insulin secretion [22]. Therefore, it seems logical to conclude that red wine ingestion enhanced the GIP response and that this increase in GIP had an insulinotropic effect on the pancreas. The relationship between the wine-induced increases in GIP iAUC and insulin iAUC (Fig. 6) indicates a weak positive relationship, with a correlation coefficient of 0.35 (r 2 = 0.12). However, this calculation was heavily affected by a single data point for one subject for whom wine induced an unusually large, 3.4-fold, increase in insulin iAUC compared with the control trial, despite a typical GIP response. If this outlier is removed from the data set, the correlation coefficient increases to 0.62 and r 2 to 0.38, which implies that the GIP response is accountable for 38 % of the variation in the insulin response. These data must be interpreted with caution, because even a strong correlation simply indicates a relationship exists and does not imply causality.
Because of the rationale for this experiment, the large 3.4-fold increase in iAUC induced by red wine for one subject is of interest. First, the veracity of this unexpected insulin response is not in doubt, because this subject’s C-peptide iAUC during the wine trial was 3.5-fold higher than after treatment with water, which corroborates the insulin data. Also, it is apparent that GLP-1 was not involved, because no GLP-1 response to glucose ingestion was observed for this subject in either trial. Regarding personal characteristics, this participant was the only subject to report moderate levels of alcohol consumption (6 drinks of wine per week); however, whether or not habitual alcohol consumption affected the insulin response during this participant’s OGTT is unknown, and we are unaware of any study that directly addresses this issue. Thus, future investigation of the effects of chronic alcohol consumption on acute hormonal responses to glucose ingestion is warranted.
Despite a positive relationship between wine-induced changes in GIP and insulin, other potential mechanisms must be considered. First, plasma glucose concentration increased more rapidly in the red wine trial than in the water trial (Fig. 1). Because insulin secretion is primarily controlled by the prevailing concentration of glucose [23], the greater rate of increase of plasma glucose over the first 45 min of the OGTT may have elicited greater insulin secretion that is apparent over 90 min (Figs. 1, 2). Second, the greater rate of increase of plasma glucose may be indicative of an increased rate of gastric emptying. Both GIP and GLP-1 responses to ingested glucose depend on the glucose load, such that higher rates of glucose entry into the duodenum induce greater incretin secretion [24]. Although we do not know the reason for the greater rate of increase of plasma glucose, it seems unlikely that it is related to gastric emptying, because alcohol has been consistently shown to inhibit the rate of gastric emptying of both liquid and solid food [25–27]. Finally, it must be noted that an enhanced insulin response after pretreatment with alcohol can be elicited via intravenous infusion of glucose, which bypasses the stimulus for GIP and GLP-1 secretion [14, 15, 17]. Whereas this does not preclude involvement of GIP in this study, it does indicate that the incretins are not necessary for alcohol-induced augmentation of insulin release.
Because GIP and GLP-1 have similar stimuli for release and similar effects on target cells, they are often grouped together as “incretin hormones.” However, our results show that red wine enhanced the GIP response whereas GLP-1 iAUC values were nearly identical in the two trials (Fig. 5). Different responses of GIP and GLP-1 to identical stimuli have been reported previously. For both healthy men [24] and lean rats [28], GIP-secreting cells were more sensitive to intestinal carbohydrate content than GLP-1-secreting cells. Because no data exist regarding the effect of wine on incretin hormone release, we can only speculate that wine may affect sensitivity of K and L cells to glucose differently.
Because T2D is characterized by defective GIP [29] and glucose-stimulated insulin secretion [1, 30], our findings of enhanced GIP (25 %) and insulin responses (50 %) could be interpreted as a positive outcome with regard to management of blood glucose levels. However, there was no improvement in glucose iAUC and, therefore, no enhancement of glycemic control during this three-hour period. That the glucose response was unchanged after red wine ingestion, despite a large increase in insulin iAUC, can probably be explained by the insulin resistance of the subjects. In addition to being clinically diagnosed with T2D or pre-diabetes, the subjects’ average HOMA2-IR value of 2.75 is well above published cutoffs for insulin resistance [31, 32]. Further, the glucose response in the control trial (Fig. 1a) reveals that plasma glucose values were above 13 mmol/l after 120 min and nearly 9 mmol/l after 180 min; thus, these participants sustained very high glucose levels for the duration of the test. An alternative explanation is that red wine somehow directly reduced insulin sensitivity or interfered with glucose transport into tissues. This scenario seems unlikely, because hyperinsulinemic, euglycemic clamp, and frequently-sampled intravenous glucose tolerance tests showed no effect of ethanol on insulin sensitivity [11, 12]. Therefore, although ingestion of red wine elicited a greater insulin response, as predicted, it is apparent that underlying insulin resistance rendered these participants unable to improve their glycemic control.
Although there has been no previous evaluation of the effect of red wine on plasma glucose and hormonal responses during an OGTT in T2D, our results are qualitatively similar to previous reports regarding alcohol and insulin. Among healthy women, red wine increased the insulin peak during an OGTT, which subsequently reduced plasma glucose levels [18]. Koivisto [16] showed for T2D patients that a mixed meal with a combination of an aperitif of vodka, red wine with the meal, and cognac after dinner enhanced meal-induced insulin secretion and reduced blood glucose concentration the following morning. Christiansen et al. [10] reported that insulin iAUC increased dose-dependently with alcohol content in the form of beer. Other studies using acute alcohol ingestion simultaneously with a mixed meal have not reported an enhanced insulin response [33, 34], but this may be because the alcoholic beverage was consumed with the meal rather than before food consumption.
Wine, which contains hundreds of phytochemicals in addition to ethanol, is a chemically complex beverage. However, because all types of alcoholic beverages enhance insulin release, we consider the physiological effects reported in this study to be derived from alcohol. Red wine was chosen as the alcoholic beverage treatment because its consumption is associated with larger reductions in the risk of developing T2D compared with liquor [6, 7], and dry wine is commonly consumed as an aperitif. It should be noted, however, that some of the phenolic compounds in red wine, for example tannic acid and resveratrol, have been reported to affect glucose metabolism independently of an ethanol effect [34, 35]. Thus, future studies are warranted in which incretin responses to alcoholic and non-alcoholic components of wine are evaluated.
This study has several limitations that should be addressed. First, the experimental procedure requiring participants to ingest alcohol after an overnight fast is rarely experienced by free-living humans. However, this research design ensured consistent baseline values for glucose, insulin, GIP, and GLP-1. Future studies might be undertaken in which red wine is provided before the evening meal. Second, the 3-h time frame for analysis of glycemic control may be too brief for our subjects. After 3 h, plasma glucose levels were near 9.0 mmol/l and insulin levels remained well above baseline. Thus, it is possible that a longer time period for analysis would reveal differences that had not yet developed at 3 h. Finally, our measurements of GIP and GLP-1 did not include assays of the intact (active) forms. It is the active forms, before enzymatic inactivation by DPP-IV, that have insulinotropic effects. Because the half-lives of these hormones are quite brief (GIP: 5–7 min; GLP-1: <2 min; [36] ), blood samples must be taken frequently to evaluate changes over time. We analyzed total (both active and inactive peptides) incretin levels at 30-min increments, which provides a clearer picture of the overall incretin response.
In conclusion, we have shown that ingestion of red wine before an OGTT induces a greater insulin response in T2D, which may be partially driven by an enhanced GIP response. However, glucose levels were not reduced, which indicates that elevated insulin levels did not improve glycemic control. Therefore, acute consumption of red wine may not be an effective treatment of T2D or may need to be combined with therapy that improves insulin sensitivity.
Acknowledgments
We thank Ying Liu, Jin Yan, Abby Felthaus, and Chelsea Diamond for their technical assistance. This research was supported by the Kenan Fund for student and faculty development at Transylvania University (KAA) and National Institutes of Health T32-AR048523 (LJR).
Conflict of interest
The authors declare that they have no conflict of interest.
Ethics policy
All procedures followed were in accordance with the ethical standards of the responsible committee on human experimentation (institutional and national) and with the Helsinki Declaration of 1964 and later versions. Informed consent or a substitute for it was obtained from all patients before inclusion in the study.
Contributor Information
Kirk A. Abraham, Phone: (859) 233-8363, Email: kabraham@transy.edu
Monica L. Kearney, Email: mlkkc3@mail.missouri.edu
Leryn J. Reynolds, Email: Leryn.Reynolds@uky.edu
John P. Thyfault, Email: jthyfault@kumc.edu
References
- 1.Ohtsubo K, Chen MZ, Olefsky JM, et al. Pathway to diabetes through attenuation of pancreatic beta cell glycosylation and glucose transport. Nat Med. 2011;17:1067–1075. doi: 10.1038/nm.2414. [DOI] [PMC free article] [PubMed] [Google Scholar]
- 2.Holst JJ, Knop FK, Vilsbøll T, et al. Loss of incretin effect is a specific, important, and early characteristic of type 2 diabetes. Diabetes Care. 2011;34:S251–S257. doi: 10.2337/dc11-s227. [DOI] [PMC free article] [PubMed] [Google Scholar]
- 3.Mikus CR, Oberlin DJ, Libla J, et al. Glycaemic control is improved by 7 days of aerobic exercise training in patients with type 2 diabetes. Diabetologia. 2012;55:1417–1423. doi: 10.1007/s00125-012-2490-8. [DOI] [PMC free article] [PubMed] [Google Scholar]
- 4.Buelens JWJ, Stolk RP, van der Schouw YT, et al. Alcohol consumption and risk of type 2 diabetes among older women. Diabetes Care. 2005;28:2933–2938. doi: 10.2337/diacare.28.12.2933. [DOI] [PubMed] [Google Scholar]
- 5.Conigrave KM, Hu BF, Camargo CA, Jr, et al. A prospective study of drinking patterns in relation to risk of type 2 diabetes among men. Diabetes. 2001;50:2390–2395. doi: 10.2337/diabetes.50.10.2390. [DOI] [PubMed] [Google Scholar]
- 6.Hodge AM, English DR, O’Dea K, et al. Alcohol intake, consumption pattern and beverage type, and the risk of type 2 diabetes. Diabetic Med. 2006;23:690–697. doi: 10.1111/j.1464-5491.2006.01864.x. [DOI] [PubMed] [Google Scholar]
- 7.Wannamethee SG, Camargo CA, Jr, et al. Alcohol drinking patterns and risk of type 2 diabetes mellitus among younger women. Arch Intern Med. 2003;163:1329–1336. doi: 10.1001/archinte.163.11.1329. [DOI] [PubMed] [Google Scholar]
- 8.Cordain L, Melby CL, Hamamoto AE, et al. Influence of moderate chronic wine consumption on insulin sensitivity and other correlates of syndrome X in moderately obese women. Metabolism. 2000;49:1473–1478. doi: 10.1053/meta.2000.17672. [DOI] [PubMed] [Google Scholar]
- 9.Beulens JWJ, van Beers RM, Stolk RP, et al. The effect of moderate alcohol consumption on fat distribution and adipocytokines. Obesity. 2006;14:60–66. doi: 10.1038/oby.2006.8. [DOI] [PubMed] [Google Scholar]
- 10.Christiansen C, Thomsen C, Rasmussen O, et al. Acute effects of graded alcohol intake on glucose, insulin, and FFA levels in non-insulin dependent (NIDDM) subjects. Eur J Clin Nutr. 1993;47:648–652. [PubMed] [Google Scholar]
- 11.Christiansen C, Thomsen C, Rasmussen O, et al. The acute impact of ethanol on glucose, insulin, triacylglycerol, and free fatty acid responses and insulin sensitivity in type 2 diabetes. Br J Nutr. 1996;76:669–675. doi: 10.1079/BJN19960074. [DOI] [PubMed] [Google Scholar]
- 12.Trojan N, Pavan P, Iori E, et al. Effect of different times of administration of a single ethanol dose on insulin action, insulin secretions and redox state. Diabetic Med. 1999;16:400–407. doi: 10.1046/j.1464-5491.1999.00060.x. [DOI] [PubMed] [Google Scholar]
- 13.Nikkilä EA, Taskinen MR. Ethanol-induced alterations of glucose tolerance, postglucose hypoglycemia, and insulin secretion in normal, obese, and diabetic subjects. Diabetes. 1975;24:933–943. doi: 10.2337/diab.24.10.933. [DOI] [PubMed] [Google Scholar]
- 14.Adner N. Influence of naloxone, atropine, and metoclopramide on ethanol augmentation of insulin secretion after intravenous glucose stimulation. Pancreas. 1990;5:460–466. doi: 10.1097/00006676-199007000-00014. [DOI] [PubMed] [Google Scholar]
- 15.Adner N. The influence of indomethacin, theophylline, and propranolol on ethanol augmentation of glucose-induced insulin secretion. Metabolism. 1992;41:1165–1170. doi: 10.1016/0026-0495(92)90004-T. [DOI] [PubMed] [Google Scholar]
- 16.Koivisto VA, Tulokas S, Toivonen M, et al. Alcohol with a meal has no adverse effects on postprandial glucose homeostasis in diabetic patients. Diabetes Care. 1993;16:1612–1614. doi: 10.2337/diacare.16.12.1612. [DOI] [PubMed] [Google Scholar]
- 17.Svartberg J, Holst JJ, Gutniak M, et al. The ethanol augmentation of glucose-induced insulin secretion is abolished by calcium antagonism with nifedipine: no evidence for a role of glucagon-like peptide-1 (GLP-1) Pancreas. 1998;16:66–71. doi: 10.1097/00006676-199801000-00011. [DOI] [PubMed] [Google Scholar]
- 18.Abraham KA. Acute red wine consumption elevates plasma insulin and decreases plasma glucose in women during an oral glucose tolerance test. Int J Diabetes Metab. 2010;18:95–98. [Google Scholar]
- 19.Dalgaard M, Thomsen C, Rasmussen BM, et al. Ethanol with a mixed meal decreases the incretin levels early postprandially and increases postprandial lipemia in type 2 diabetic patients. Metabolism. 2004;53:77–83. doi: 10.1016/j.metabol.2003.08.011. [DOI] [PubMed] [Google Scholar]
- 20.Wolever TM. Effect of blood sampling schedule and method of calculating the area under the curve on validity and precision of glycaemic index values. Br J Nutr. 2004;91:295–301. doi: 10.1079/BJN20031054. [DOI] [PubMed] [Google Scholar]
- 21.Nauck M, Stöckmann F, Ebert R, et al. Reduced incretin effect in type 2 (non-insulin-dependent) diabetes. Diabetologia. 1986;29:46–54. doi: 10.1007/BF02427280. [DOI] [PubMed] [Google Scholar]
- 22.Koliaki C, Doupis J. Incretin-based therapy: a powerful and promising weapon in the treatment of type 2 diabetes mellitus. Diabetes Ther. 2011;2:101–121. doi: 10.1007/s13300-011-0002-3. [DOI] [PMC free article] [PubMed] [Google Scholar]
- 23.Meier JJ. The contribution of incretin hormones to the pathogenesis of type 2 diabetes. Best Pract Res Clin Endocrinol Metab. 2009;23:433–441. doi: 10.1016/j.beem.2009.03.007. [DOI] [PubMed] [Google Scholar]
- 24.Polichiewicz AN, Chaikomin R, Brennan IM, et al. Load-dependent effects of duodenal glucose on glycemia, gastrointestinal hormones, antropyloroduodenal motility, and energy intake in healthy men. Am J Physiol Endocrinol Metab. 2007;293:E743–E753. doi: 10.1152/ajpendo.00159.2007. [DOI] [PubMed] [Google Scholar]
- 25.Franke A, Nakchbandi IA, Schneider A, et al. The effect of ethanol and alcoholic beverages on gastric emptying of solid meals in humans. Alcohol Alcohol. 2005;40:187–193. doi: 10.1093/alcalc/agh138. [DOI] [PubMed] [Google Scholar]
- 26.Franke A, Teyssen S, Harder H, et al. Effect of ethanol and some alcoholic beverages on gastric emptying in humans. Scand J Gastroenterol. 2004;39:638–644. doi: 10.1080/00365520410005009. [DOI] [PubMed] [Google Scholar]
- 27.Kasicka-Jonderko A, Jonderko K, Bozek M, et al. Potent inhibitory effect of alcoholic beverages upon gastrointestinal passage of food and gallbladder emptying. J Gastroenterol. 2013;48:1311–1323. doi: 10.1007/s00535-013-0752-y. [DOI] [PMC free article] [PubMed] [Google Scholar]
- 28.Yoder SM, Yang Q, Kindel TL, et al. Differential responses of the incretin hormones GIP and GLP-1 to increasing doses of dietary carbohydrate but not dietary protein in lean rats. Am J Physiol Gastrointest Liver Physiol. 2010;299:G476–G485. doi: 10.1152/ajpgi.00432.2009. [DOI] [PMC free article] [PubMed] [Google Scholar]
- 29.Škrha J, Holgertova J, Jarolimkova M, et al. Meal test for glucose-dependent insulinotropic peptide (GIP) in obese and type 2 diabetic patients. Physiol Res. 2010;59:749–755. doi: 10.33549/physiolres.931893. [DOI] [PubMed] [Google Scholar]
- 30.Wolever TMS, Chiasson J-L, Csima A, et al. Variation of postprandial plasma glucose, palatability, and symptoms associated with a standardized mixed test meal versus 75 g oral glucose. Diabetes Care. 1998;21:336–340. doi: 10.2337/diacare.21.3.336. [DOI] [PubMed] [Google Scholar]
- 31.Exebio JC, Ajabshir S, Zarini GG, et al. Use of homeostatic model assessment indexes for the identification of metabolic resistance and insulin resistance among Cuban-Americans: a cross-sectional study. Br J Med Medical Res. 2014;4:4824–4833. doi: 10.9734/BJMMR/2014/8988. [DOI] [PMC free article] [PubMed] [Google Scholar]
- 32.Geloneze B, Vasques ACJ, Stabe CFC, et al. HOMA1-IR and HOMA2-IR indexes in identifying insulin resistance and metabolic syndrome—Brazilian metabolic syndrome study (BRAMS) Arq Bras Endocrinol Metab. 2009;53:281–287. doi: 10.1590/S0004-27302009000200020. [DOI] [PubMed] [Google Scholar]
- 33.Gin H, Morlat P, Ragnaud JM, et al. Short-term effect of red wine (consumed during meals) on insulin requirement and glucose tolerance in diabetic patients. Diabetes Care. 1992;15:546–548. doi: 10.2337/diacare.15.4.546. [DOI] [PubMed] [Google Scholar]
- 34.Gin H, Rigalleau V, Caubet O, et al. Effects of red wine, tannic acid, or ethanol on glucose tolerance in non-insulin-dependent diabetic patients and on starch digestibility in vitro. Metabolism. 1999;48:1179–1183. doi: 10.1016/S0026-0495(99)90135-X. [DOI] [PubMed] [Google Scholar]
- 35.Su H-C, Hung L-M, Chen J-K. Resveratrol, a red wine antioxidant, possesses an insulin-like effect in streptozotocin-induced diabetic rats. Am J Physiol Endocrinol Metab. 2006;290:E1339–E1346. doi: 10.1152/ajpendo.00487.2005. [DOI] [PubMed] [Google Scholar]
- 36.Baggio LL, Drucker DJ. Biology of incretins: GLP-1 and GIP. Gastroenterol. 2007;132:2131–2157. doi: 10.1053/j.gastro.2007.03.054. [DOI] [PubMed] [Google Scholar]


