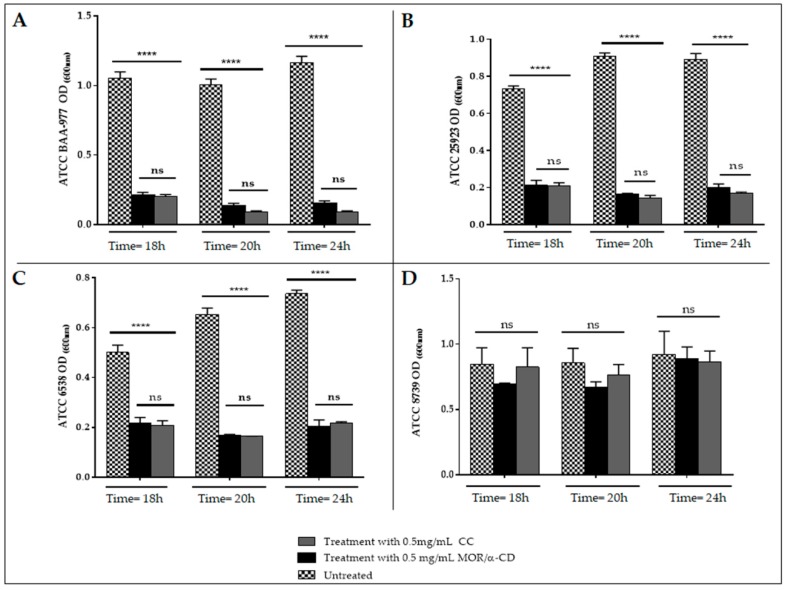
Figure 2.
The MIC evaluation of MOR/α-CD against S. aureus ATCC BAA-977 (A), S. aureus ATCC 25923 (B), S. aureus ATCC 6538 (C) and E. coli ATCC 8739 (D); MIC value of MOR/α-CD was evaluated using a starting inoculum of 5 × 10⁵ CFU/mL and measuring the optical density (OD) at 18 h–20 h and 24 h. We assessed different doses of MOR/α-CD, but in the graph, we represented only the dose of 0.5 mg/mL, which was able to affect the growth after 24 h of incubation. Experiments were done in triplicate to obtain the mean and the standard deviation (SD). Statistical analysis (Two-way ANOVA) was performed by the GraphPad Prism6 software and the p value < 0.0001 (****) showed significant difference.

