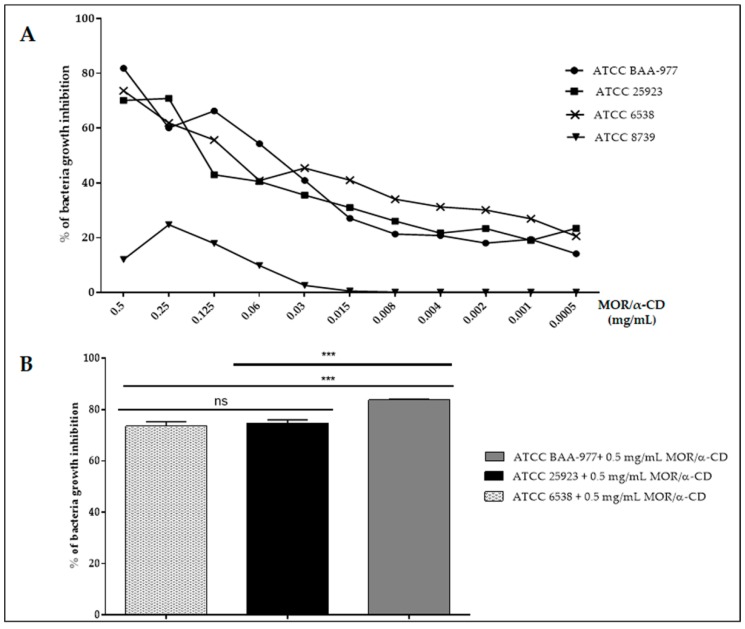
Figure 3.
The percentage of relative bacterial growth inhibition among the strains. (A) Percentage of bacterial growth inhibition by different doses of MOR/α-CD complex calculated as [(Ac − At)/Ac] × 100, where Ac was the OD reached by untreated bacteria after 24 h of incubation and At was the OD reached by treated bacteria after 24 h of incubation. (B) A statistical analysis (one-way ANOVA test) was performed by GraphPad Prism6 software to compare the most effective dose of the MOR/α-CD complex (0.5 mg/mL) among the strains. Experiments were assessed in triplicate to obtain the mean and the standard deviation (SD). p value < 0.0002 (***) showed a significant difference.

