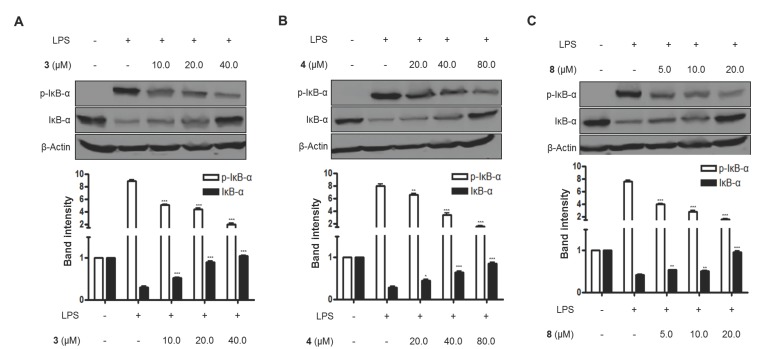
Figure 7.
The effects of compounds (A) 3, (B) 4, and (C) 8 on LPS-induced IκB-α phosphorylation and degradation in BV2 microglial cells. (A–C) The cells were pretreated for 3 h with the indicated concentrations of compounds 3, 4, and 8, and then stimulated for 1 h with LPS (1.0 μg/mL). The data are presented as the means ± SD of three experiments. The band intensity was quantified by densitometry and normalized to the intensity of the β-actin band; lower panel, summarized bar graphs show band intensity presented as ratio of targeting protein over β-actin. The significance of the comparison against the LPS-treated group is indicated as follows: * p < 0.05; ** p < 0.01; *** p < 0.001. “+” is treated, while “-“ is not treated.

