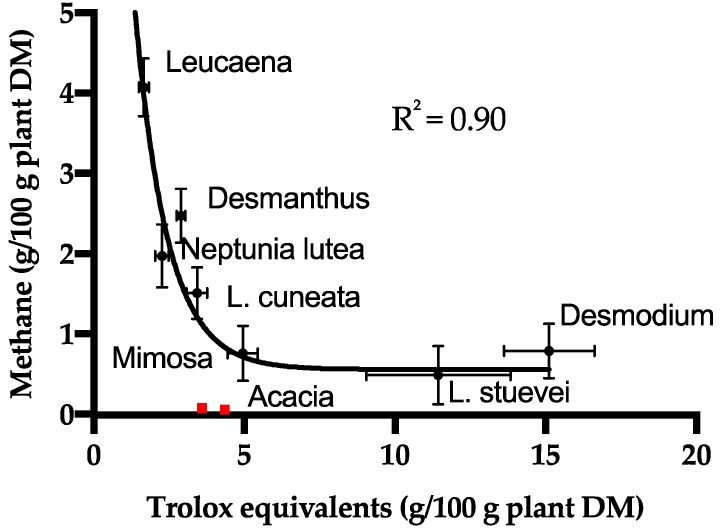
Figure 3.
Relationship between methane production [23] and antioxidant activity for the forages. The non-linear exponential fit (Y = 11.64(exp(−0.772X)) + 0.6433) does not include the Acacia CT data (red markers). The points are average for the ORAC method (n = 3) and the in vitro gas production (n = 3) and the error bars indicate standard deviations.

